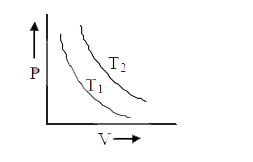
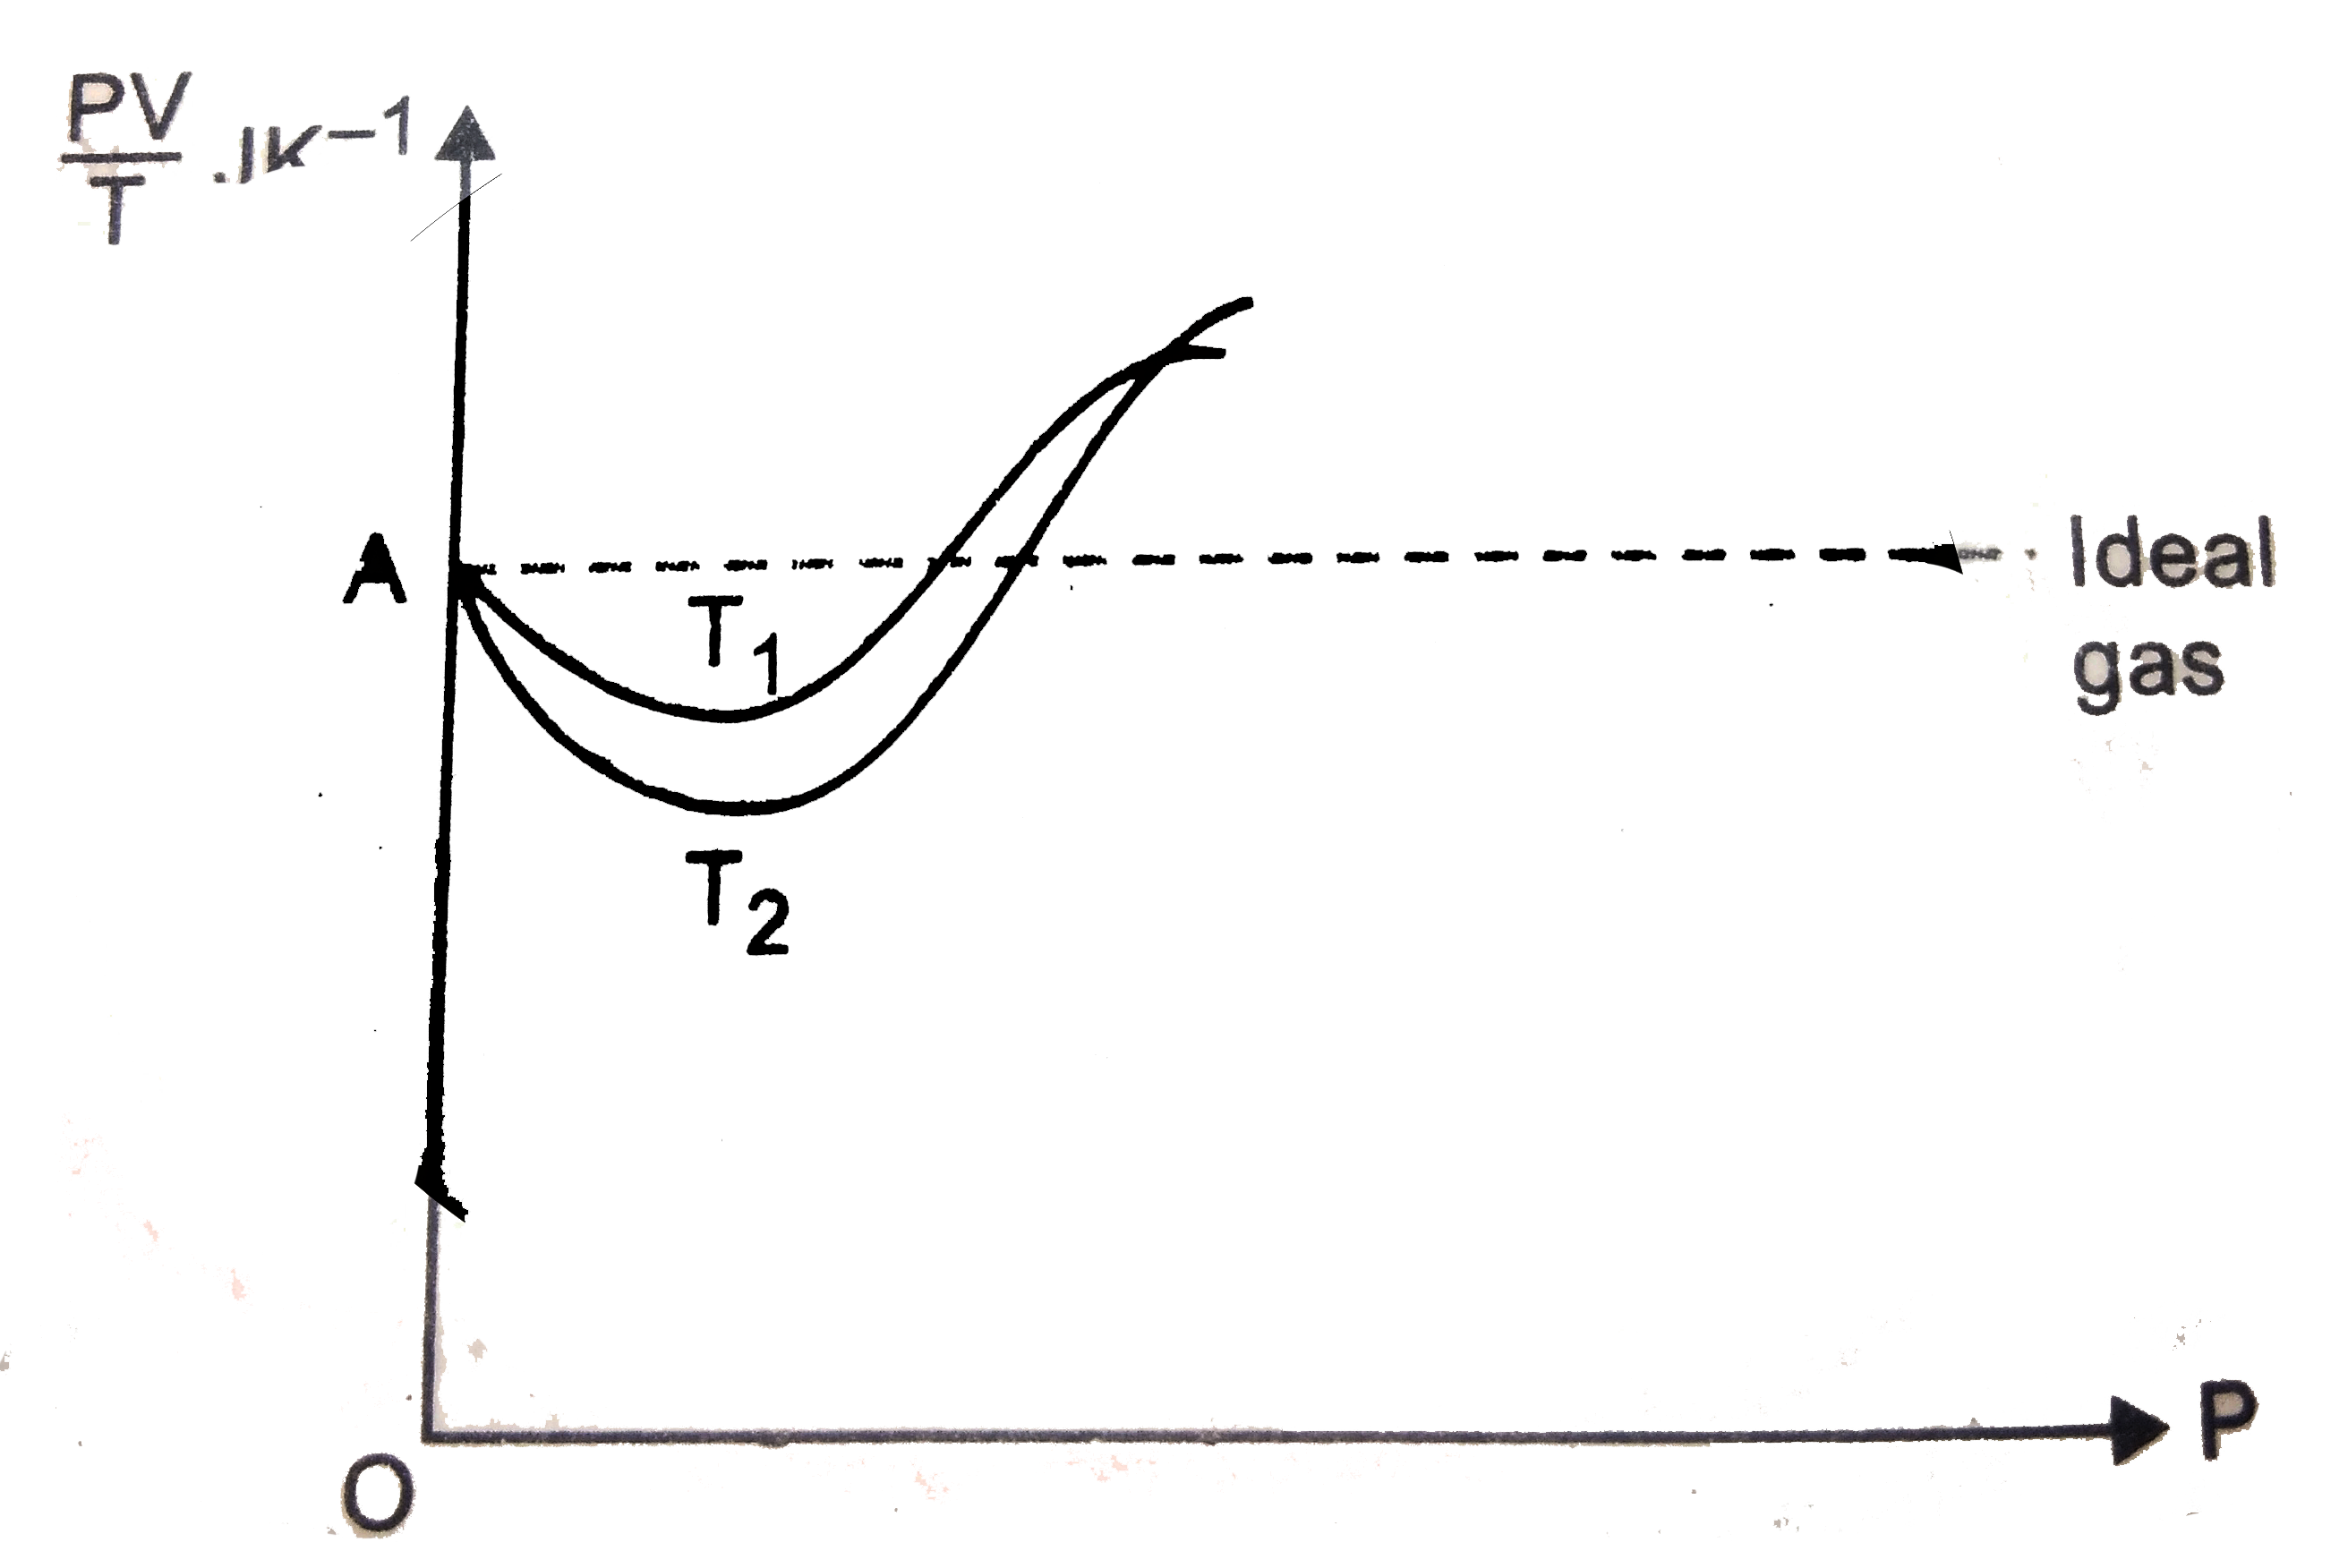
Given is the graph between PVT and P for 1 gm of oxygen gas at two different temperatures T1andT2 Fig. Given, density of oxygen =1.427kgm−3. The value of (PV)/(T) at the point A and the relation between T1andT2 are respectively :
A
0.256JK−1andT1<T(2)
B
8.314mol−1K−1andT1>T(2)
C
0.256JK−1andT1>T(2)
D
4.28JK−1andT1<T(2)
Video Solution
Text Solution
The correct Answer is:C
PV=nRT=mMRT
Where m = mass of the gas
and mM=n= number of moles
PVT=nR=a constant for all value of P.
That is why, ideally it is a straight line.
∴PVT=1gm32gm×8.31Jmole−1K−1
=0.256JK−1. Also, T1>T2.
|
Topper's Solved these Questions
- BEHAVIOUR OF PERFECT GAS & KINETIC THEORYBOOK - PRADEEPCHAPTER - BEHAVIOUR OF PERFECT GAS & KINETIC THEORYEXERCISE - Multiple choice questions-II
8 Videos
- BEHAVIOUR OF PERFECT GAS & KINETIC THEORYBOOK - PRADEEPCHAPTER - BEHAVIOUR OF PERFECT GAS & KINETIC THEORYEXERCISE - Multiple choice questions-III
12 Videos
- BEHAVIOUR OF PERFECT GAS & KINETIC THEORYBOOK - PRADEEPCHAPTER - BEHAVIOUR OF PERFECT GAS & KINETIC THEORYEXERCISE - Problems for practice
47 Videos
- GRAVIATIONBOOK - PRADEEPCHAPTER - GRAVIATIONEXERCISE - Assertion-Reason Type Questions
19 Videos
Similar Questions
Knowledge Check
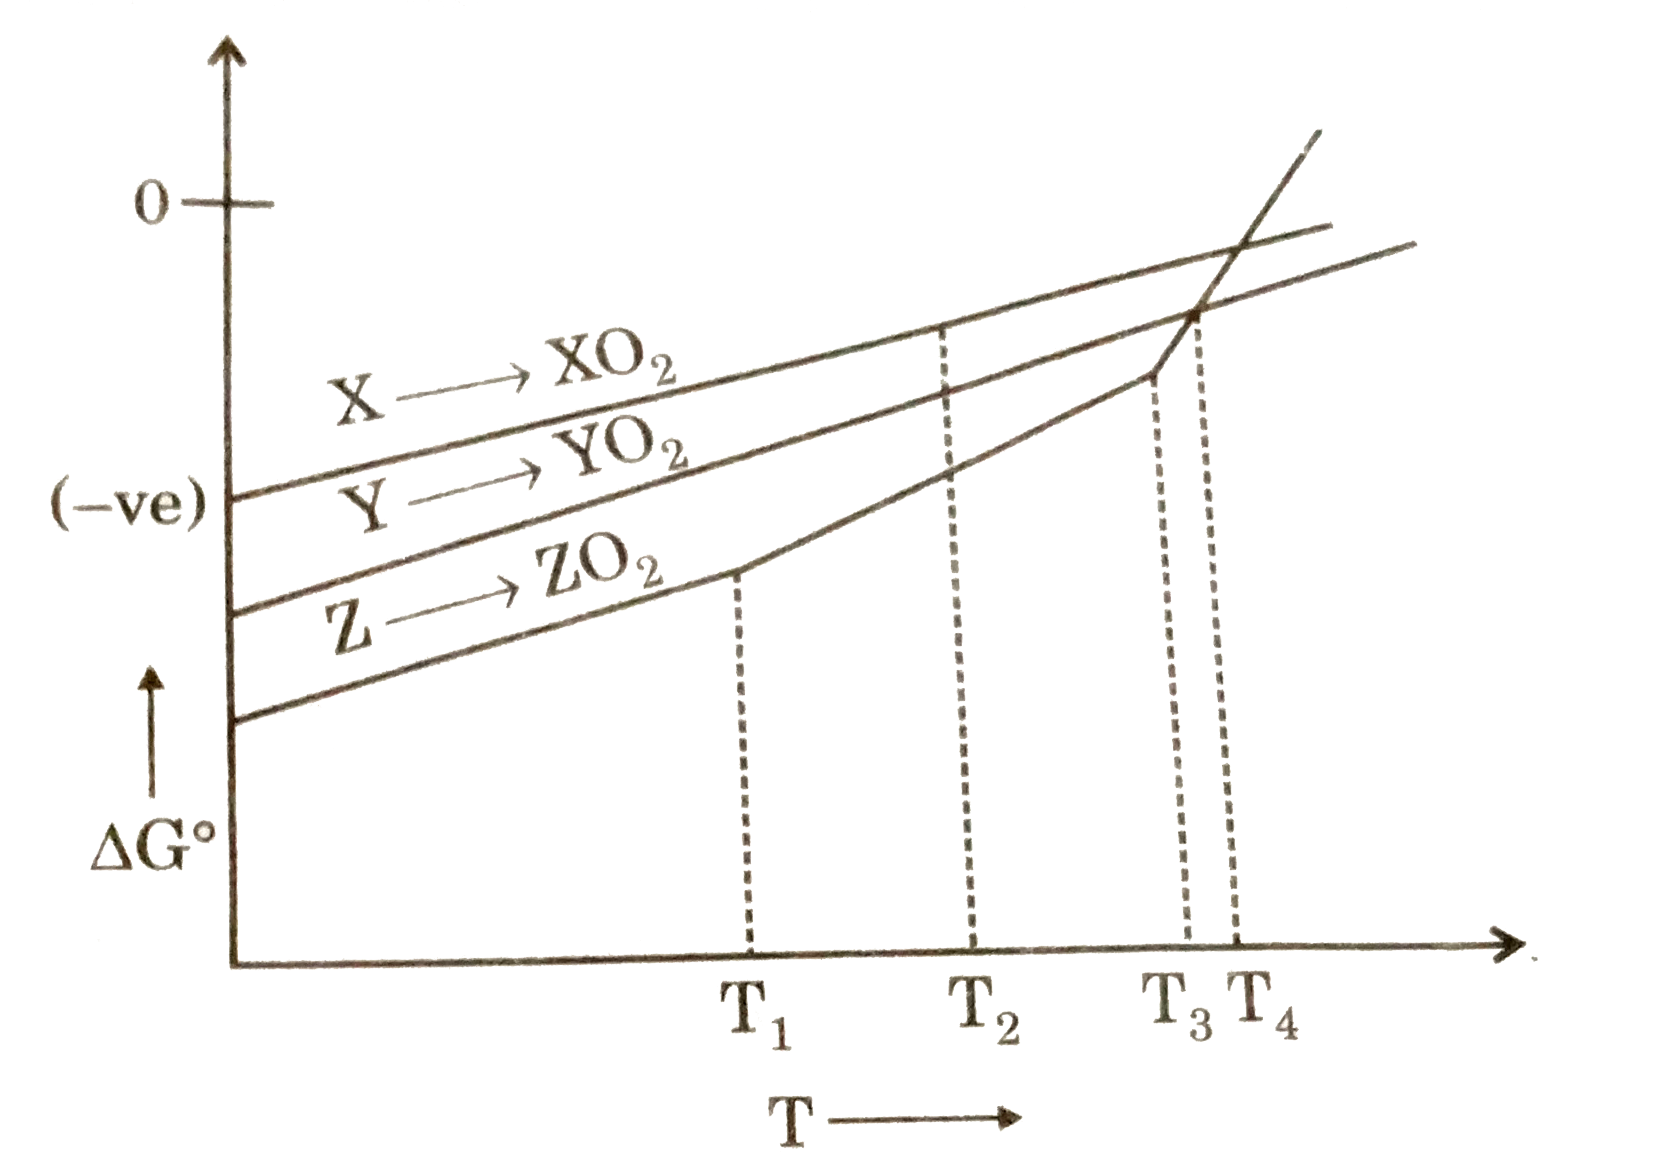
Temperature T1andT3 represents respectively:Amelting point and boiling point of ZBmelting point and boiling point of ZO2Cmelting point of Z and ZO2Dboiling point of Z and ZO2The isothermal diagram of a gas at three different temperatures T1,T2and_(3), is show in the given figure .Then
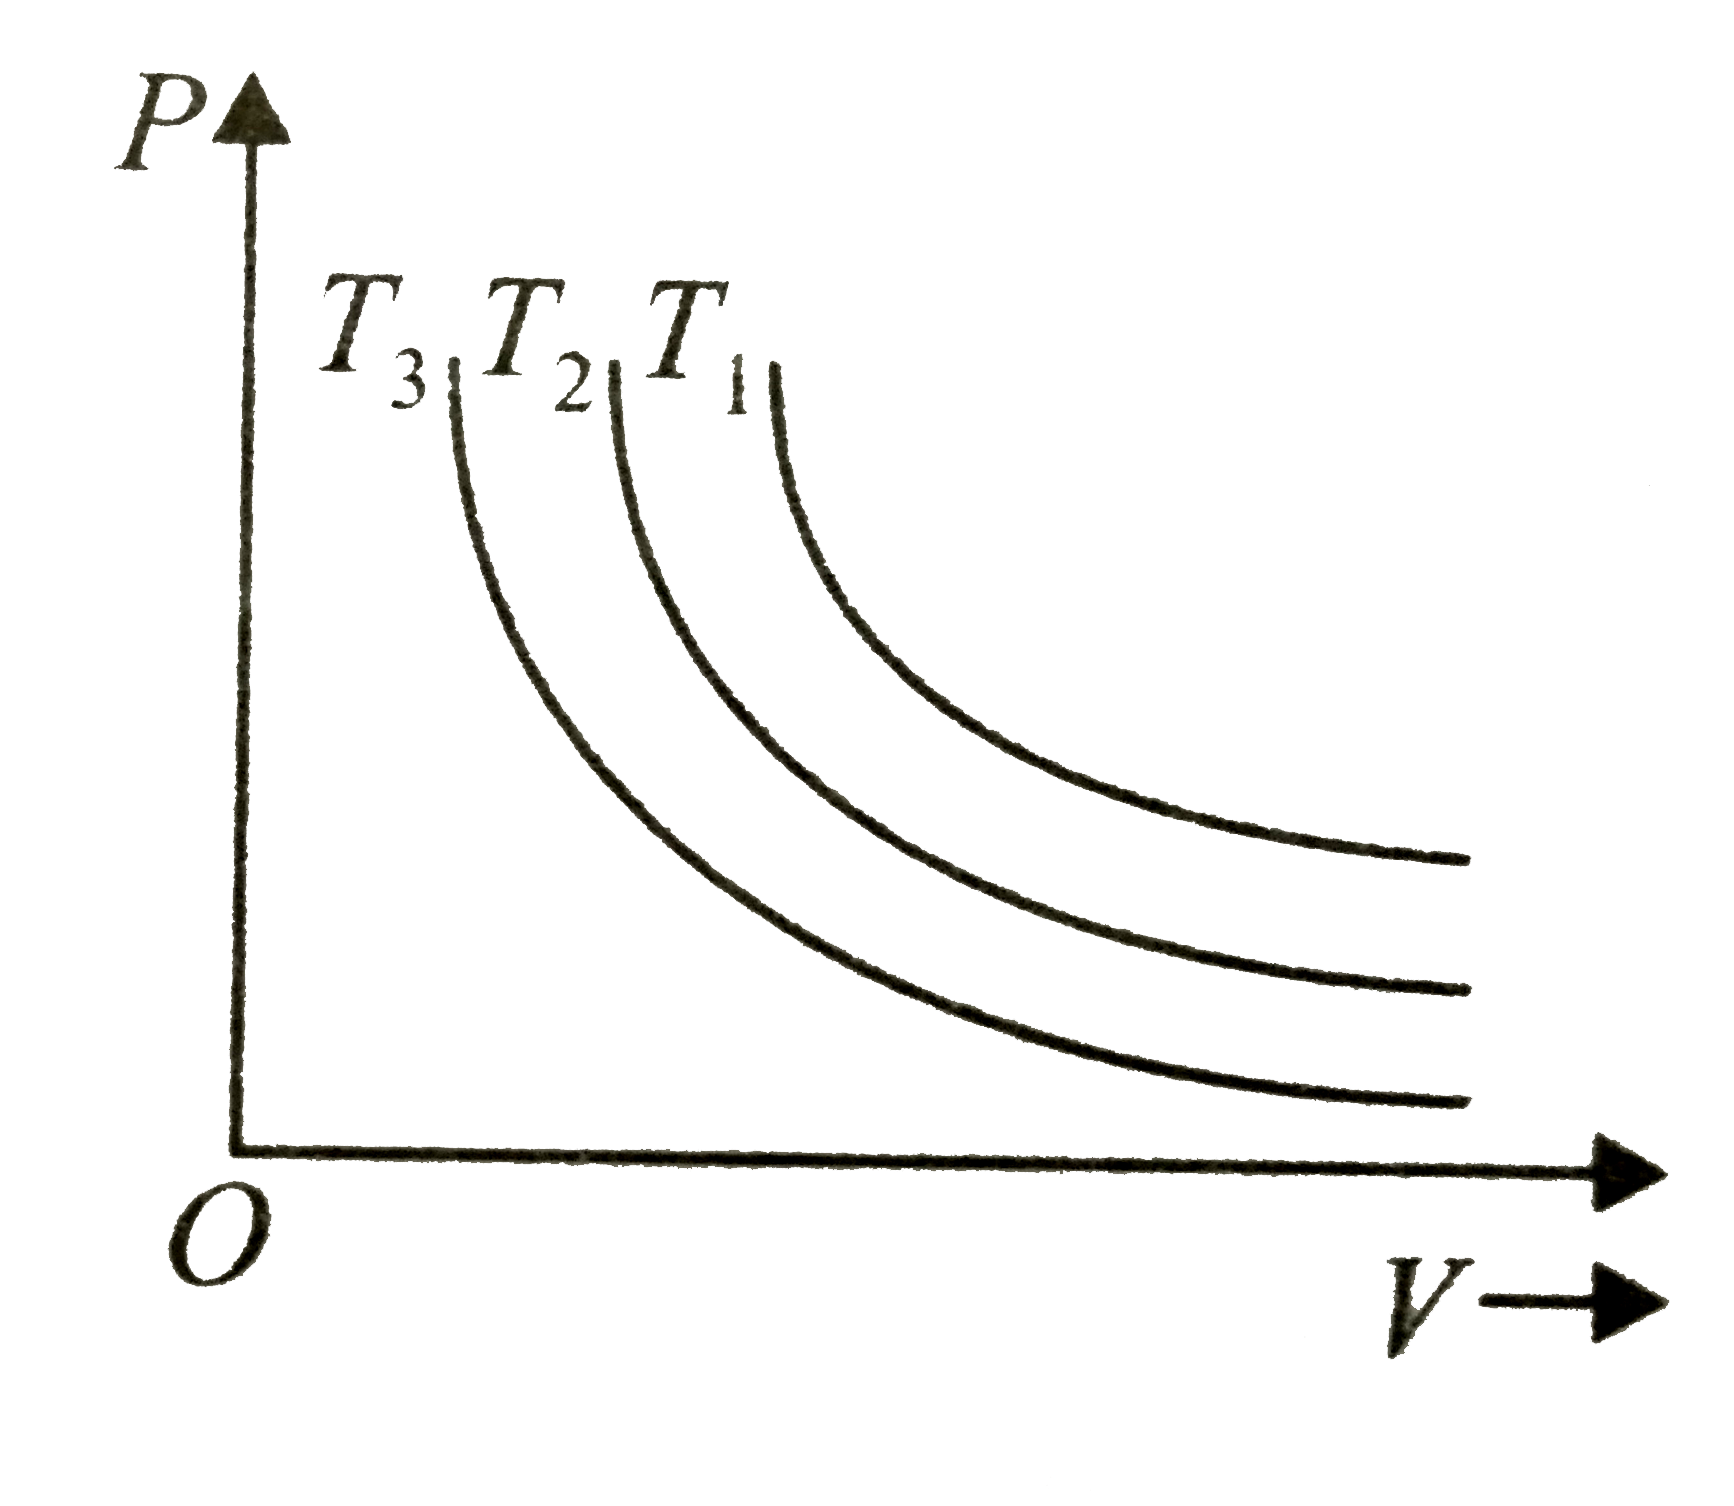 AT1<T2<T3BT1<T2>T3CT1>T2>T3DT1>T2<T3
Difference between t34 and t12 - Radioactivity
At(34)=2t12Bt(34)=t12Ct(34)=3t12Dno≠
The normal at t1 on the parabola meets again at t2 then find relation between t1 and t2
View SolutionIdentify correct graph between PV and T for an ideal gas of given number of moles:
View SolutionThe stress-strain graph for a metallic wire is shown at two different temperature, T1 and T2 which temperature is high T1 or T2 ?
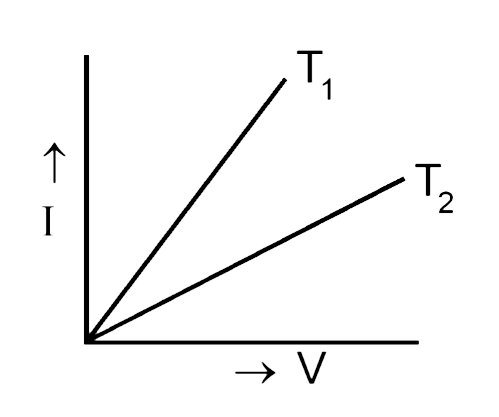
View SolutionThe current (I) and voltage (V) graphs for a given metallic wire at two different temperature (T1) and (T2) are shown in fig. It is concluded that
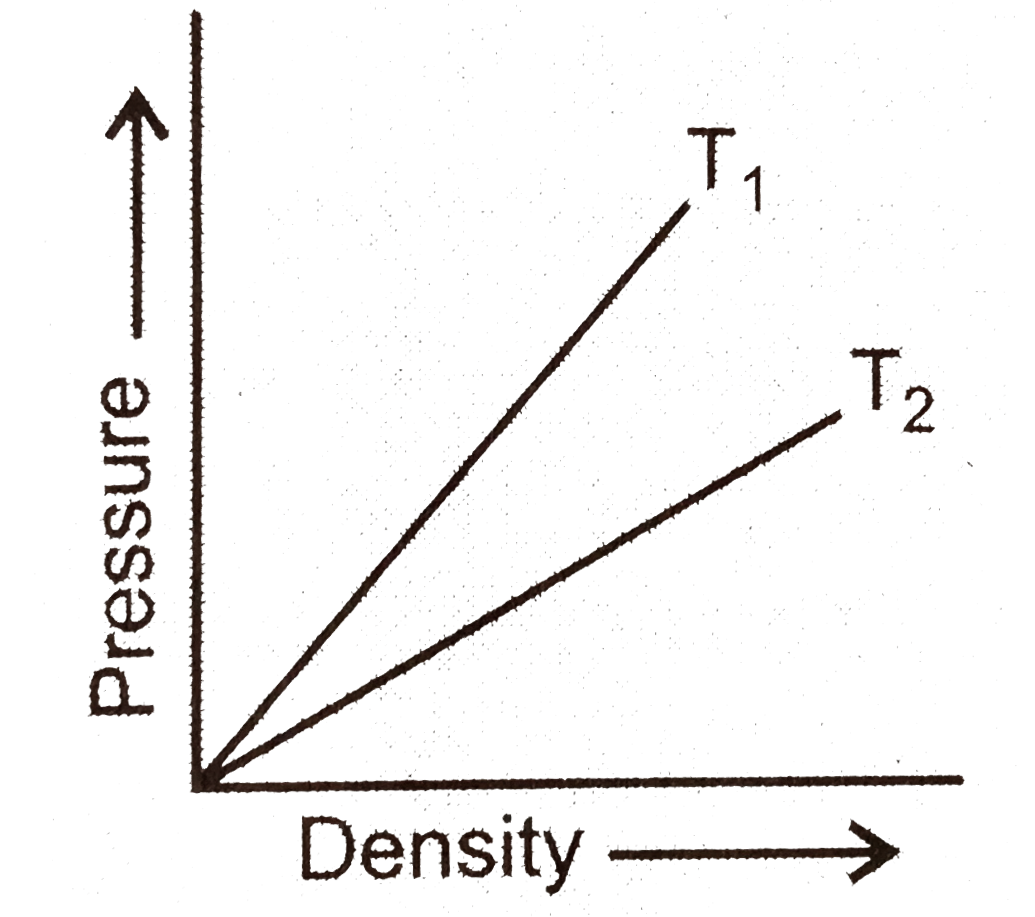
View SolutionFigure shows graphs of pressure versus density for an ideal gas at two temperatures T1 and T2 Which is correct ?
 .
.
View Solution

