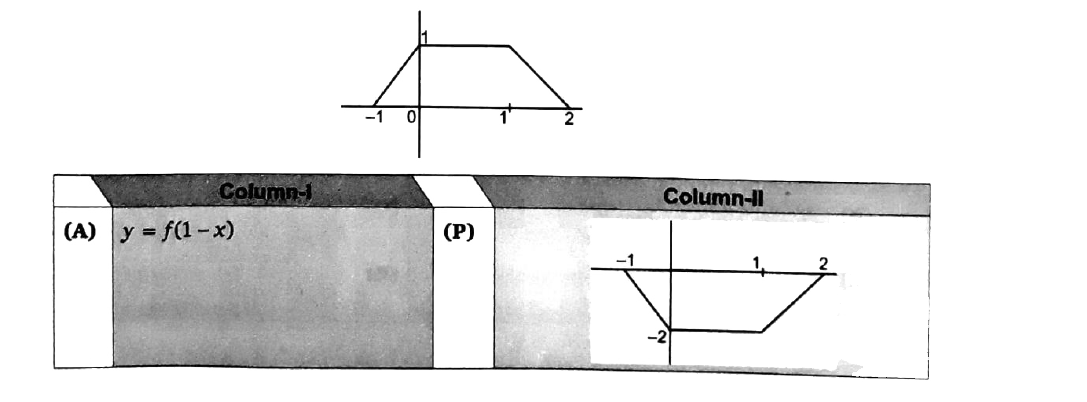
Given the graph of y=f(x)
The correct Answer is:N//S
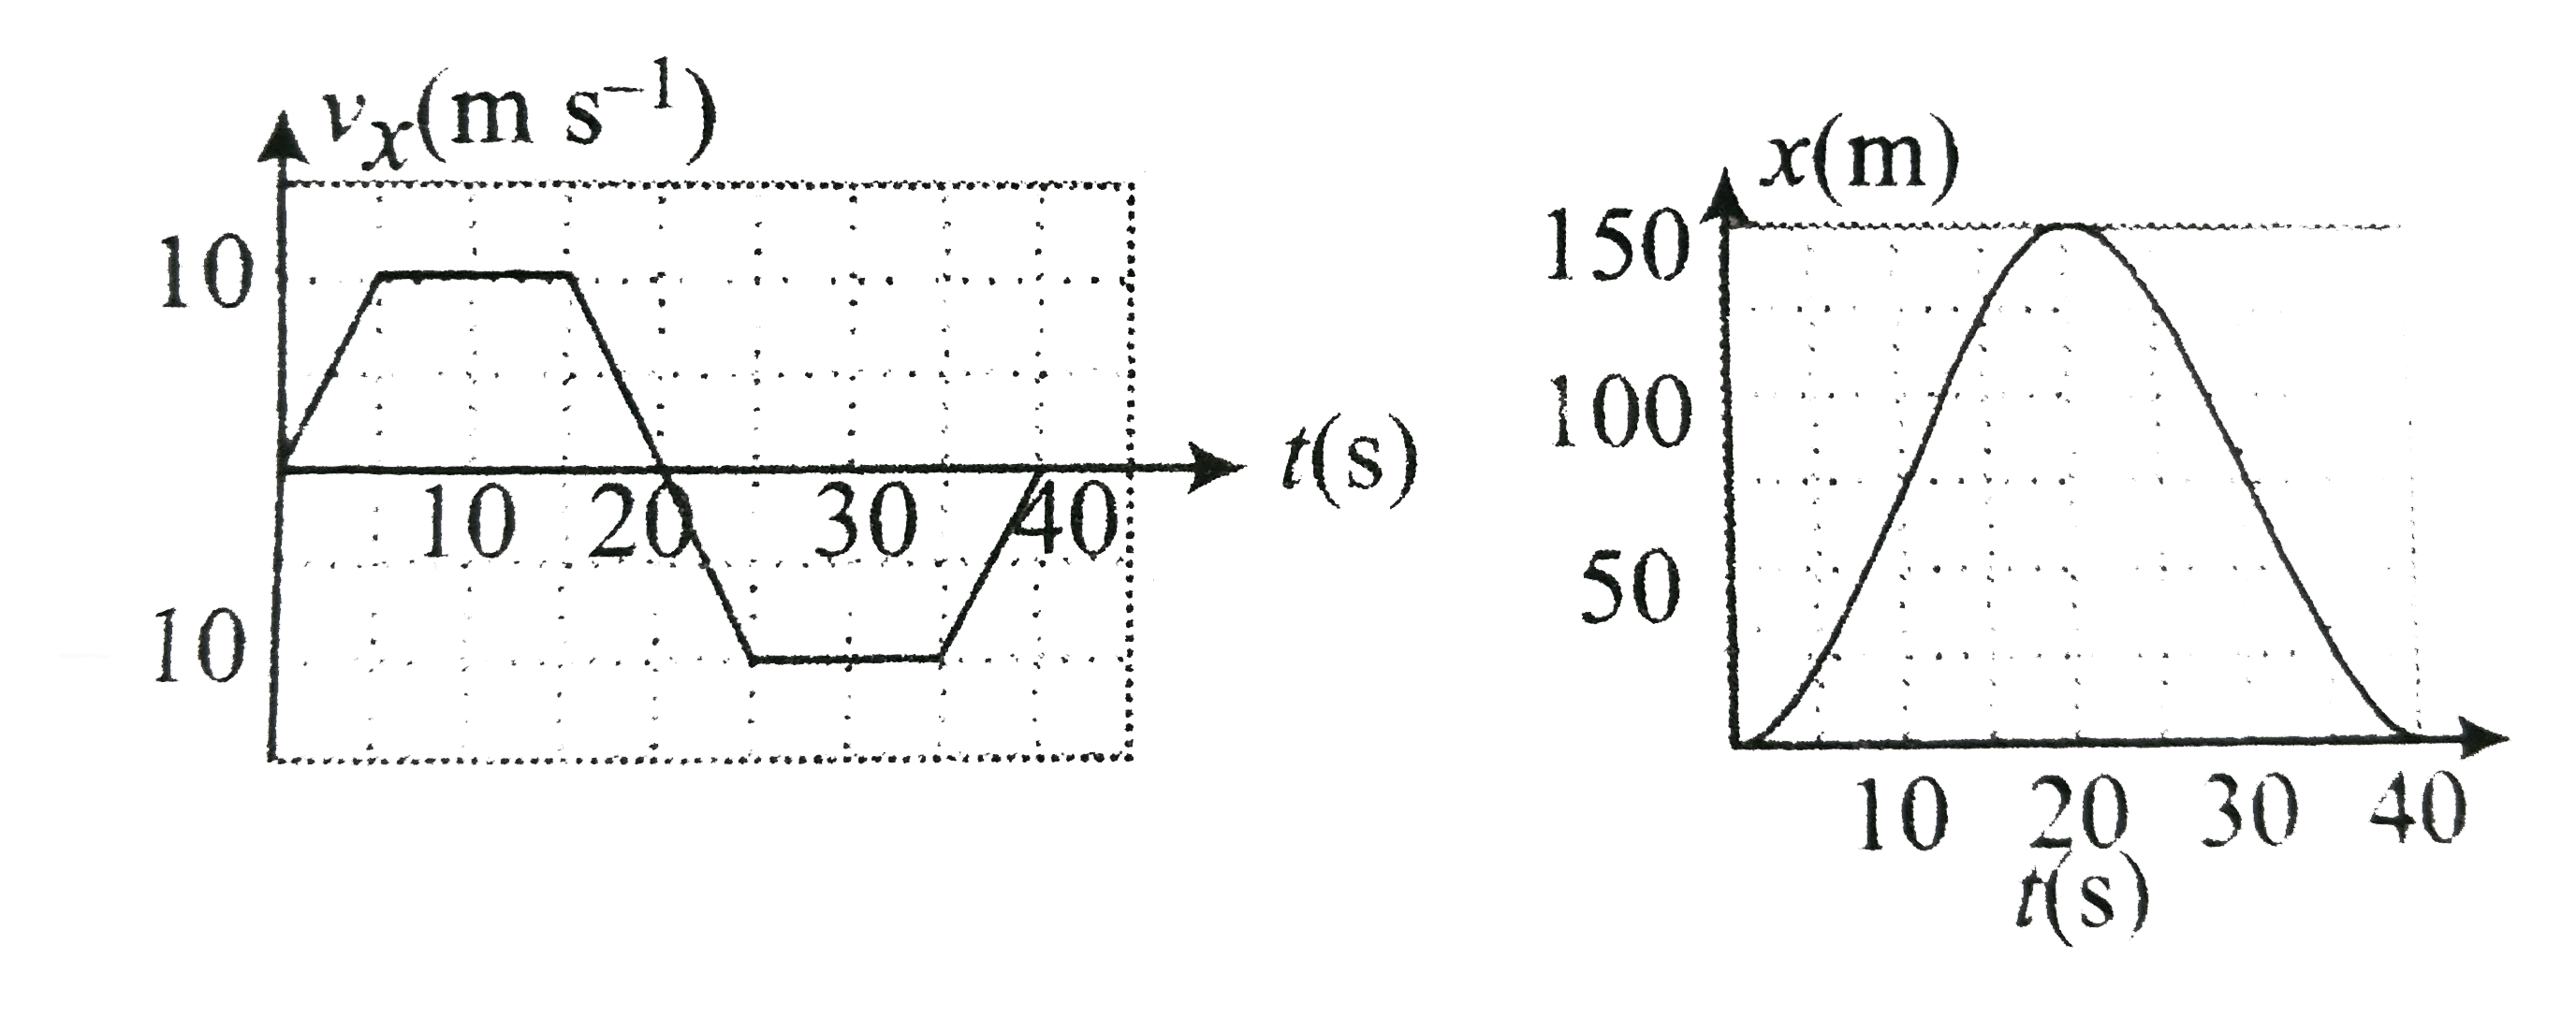
At t=5s,v1=u+at=0+2×5=10ms−1
At t=15s,v1=10ms−1
At t=25s,v2=v1+at=10−2×10=−10ms−1
At t=35s,v2=−10ms−1
At t=40s,v3=v2+at=−102×50ms−1
To find x ,
For 0 to 5 s, x=12×2×52=25m
For 5 to 15, x=25+10×10=125m
For 15 to 20,x=125+v1t+12at2
=125+10×12(−2)52=150m
For 20 to 25 s, x=150+0×5+12(−2)52=125m
For 25 to 35s,x=125+v2t=125−10×10=25m
For 35 to 40s, x=25+v2t+12at2
12−10×5+12×2×52=0
 .
.
Topper's Solved these Questions
- BOOK - CENGAGE PHYSICS ENGLISHCHAPTER - KINEMATICS-1EXERCISE - Single Correct52videos
KINEMATICS-1
- BOOK - CENGAGE PHYSICS ENGLISHCHAPTER - KINEMATICS-1EXERCISE - Graphical Concept17videos
KINEMATICS-1
- BOOK - CENGAGE PHYSICS ENGLISHCHAPTER - KINEMATICS-1EXERCISE - Exercise 4.416videos
KINEMATICS-1
- BOOK - CENGAGE PHYSICS ENGLISHCHAPTER - GRAVITATIONEXERCISE - INTEGER_TYPE1videos
GRAVITATION
- BOOK - CENGAGE PHYSICS ENGLISHCHAPTER - KINEMATICS-2EXERCISE - Exercise Integer9videos
KINEMATICS-2
Similar Questions
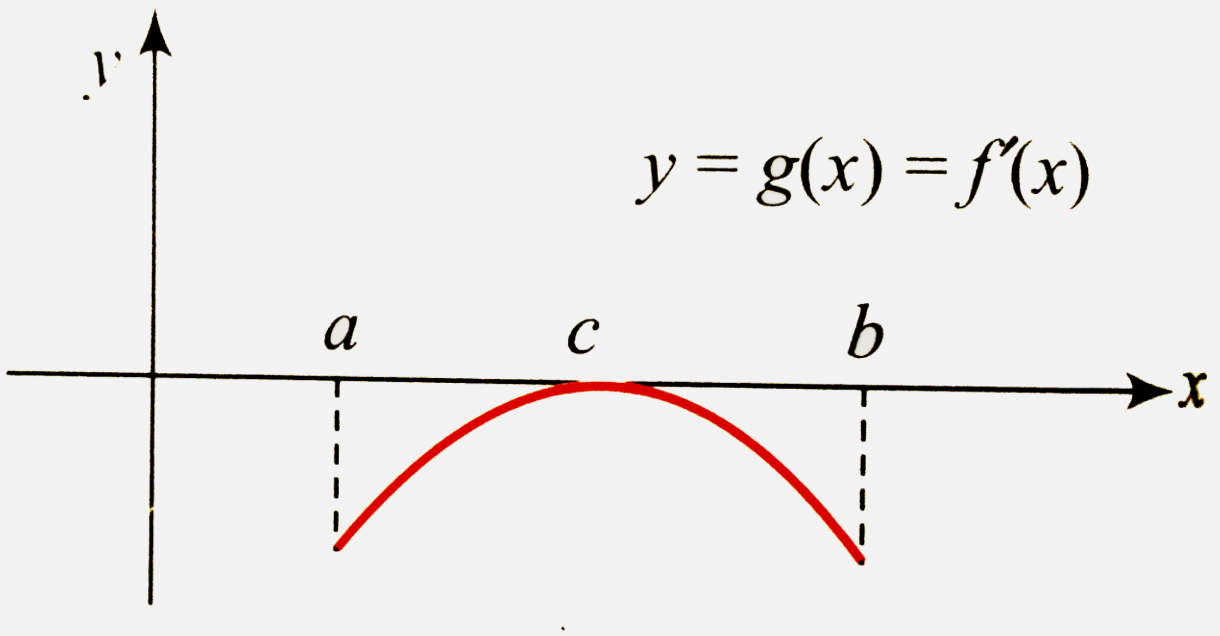
Following is the graph of y = f' (x) , given that f(c) = 0. Analyse the graph and answer the following questions.
(a) How many times the graph of y = f(x) will intersect the x - axis?
(b) Discuss the type of roots of the equation f (x) = 0, a≤x≤b.
(c) How many points of inflection the graph of y=f(x),a≤x≤b, has?
(d) Find the points of local maxima/minima ofy=f(x),a<xb.
(e) How many roots equation f''(x)=0 has?
 View Solution
Given the graph of f(x), draw the graph each one of the following functions :
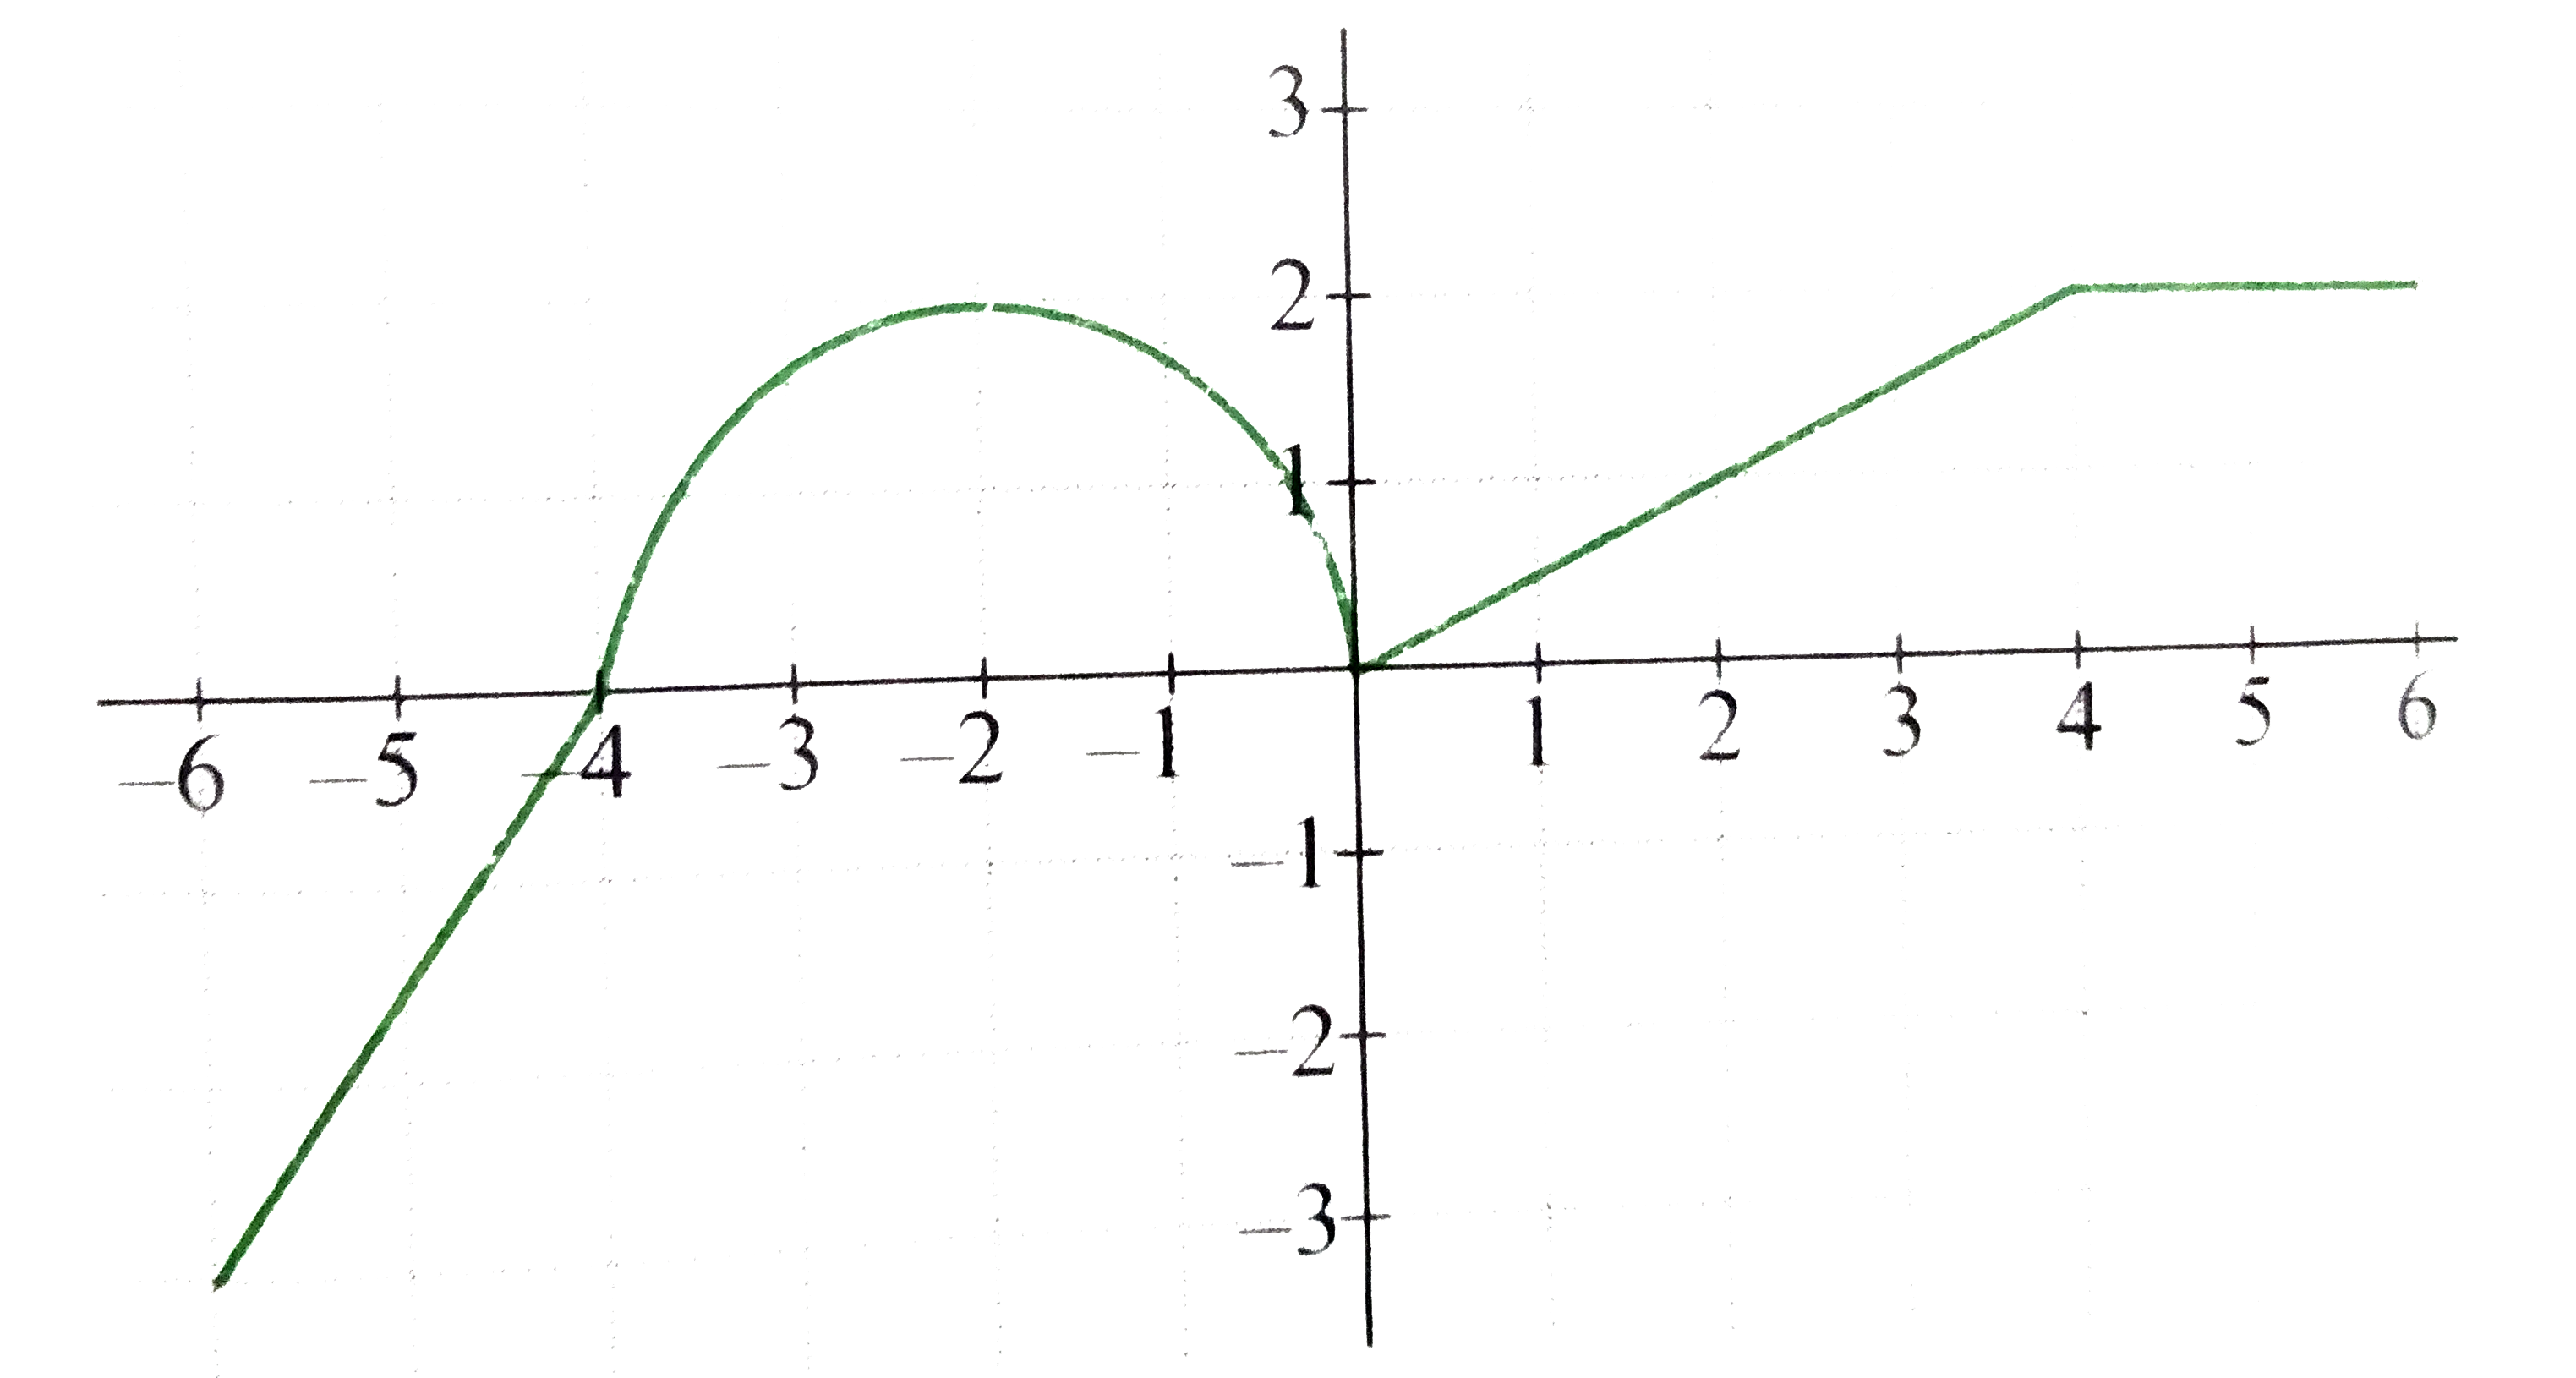
(a) y=f(x)+3 (b) y=−f(x)+2
(c ) y=f(x+1)−2 (d) y=−f(x−1)
(e ) y=f(−x) (f) y=f(|x|)
(g) y=f(1−x)View Solution
Knowledge Check
- Question 1 - Select One
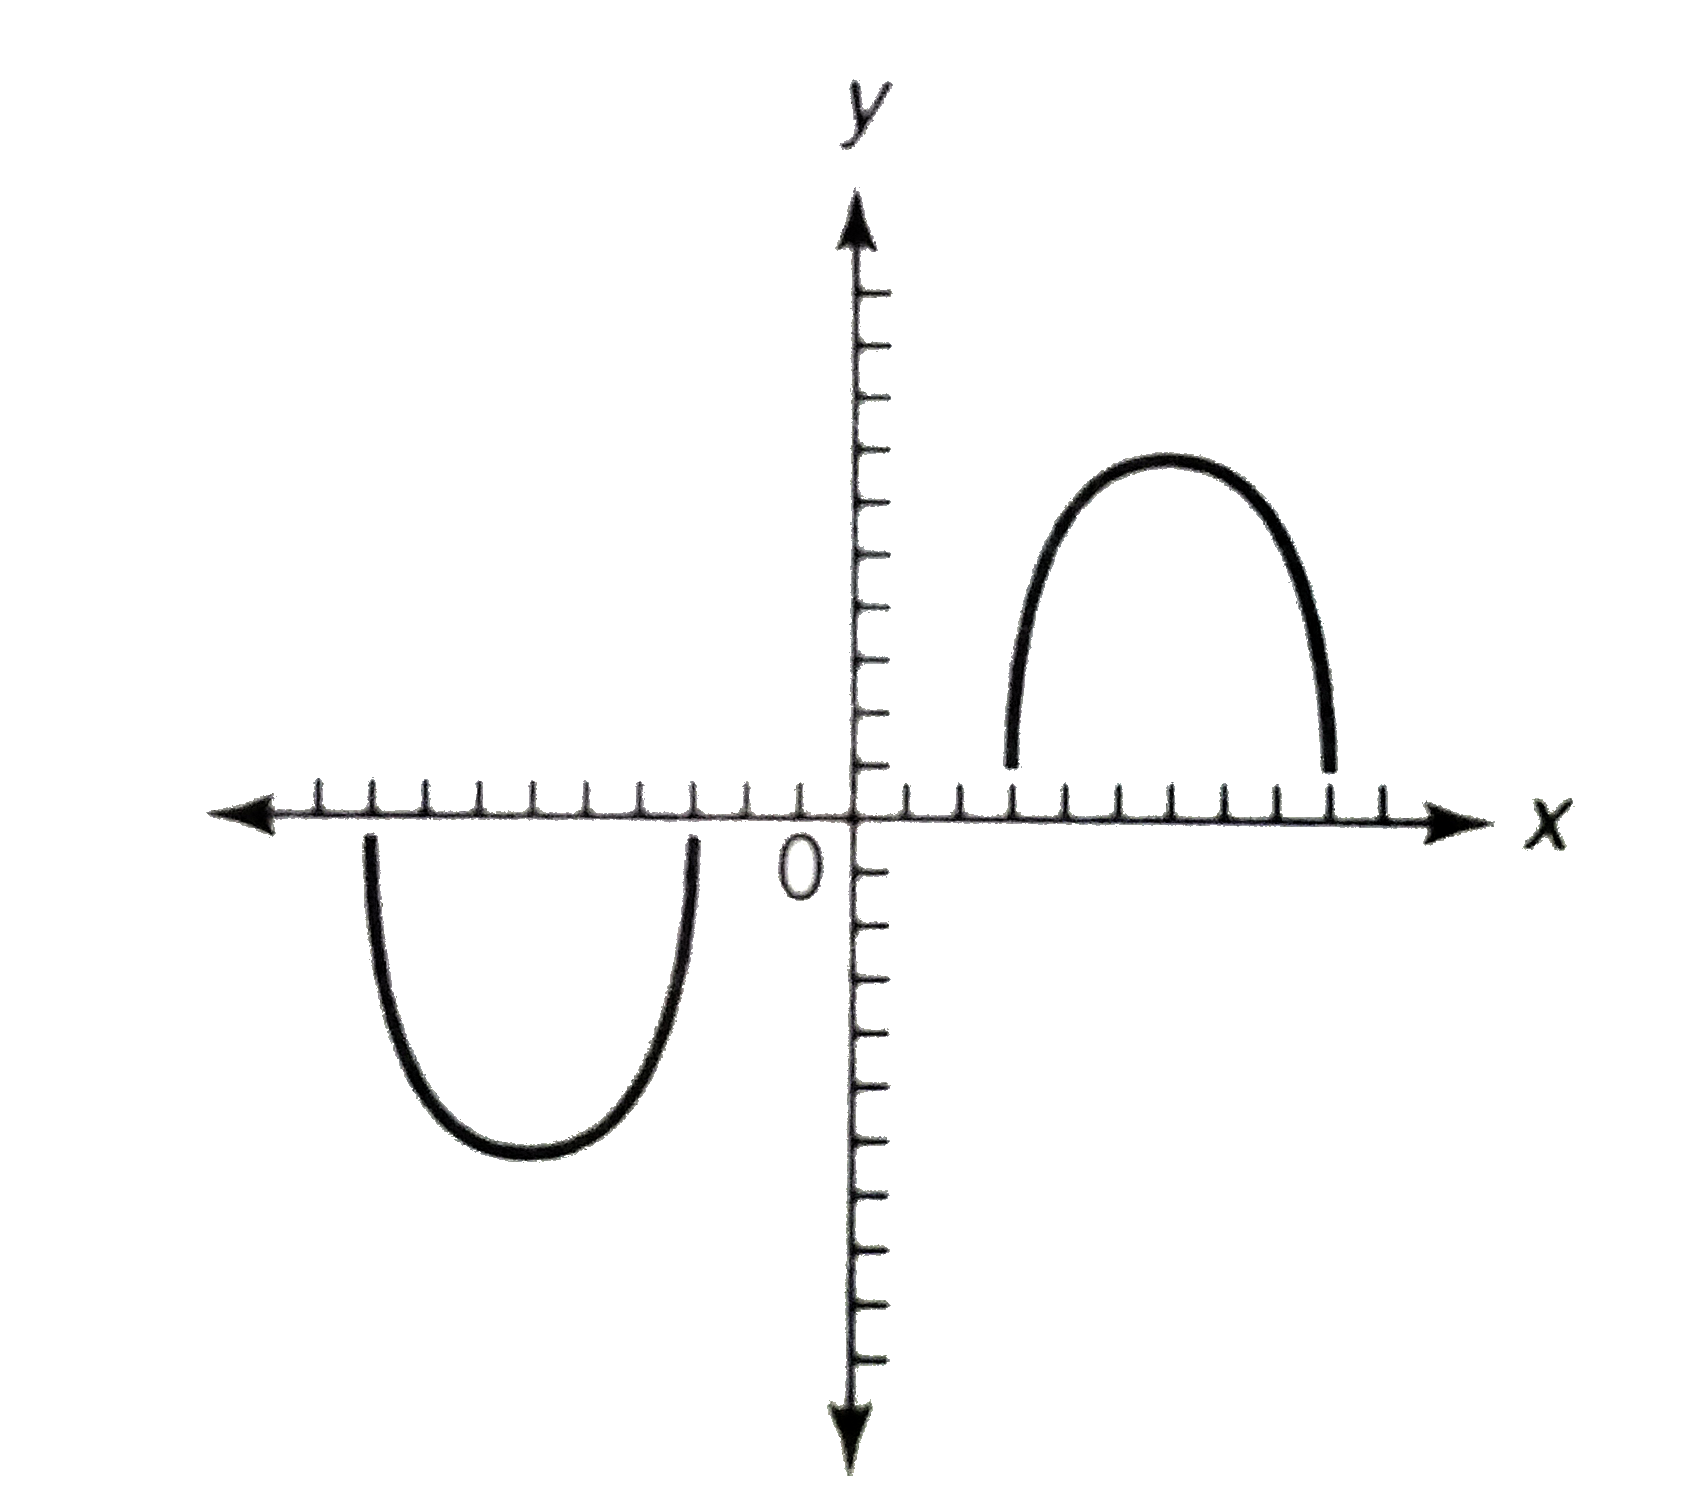
The graph of the function f is shown above. Which of the following could represent the graph of y=|f(x)|?A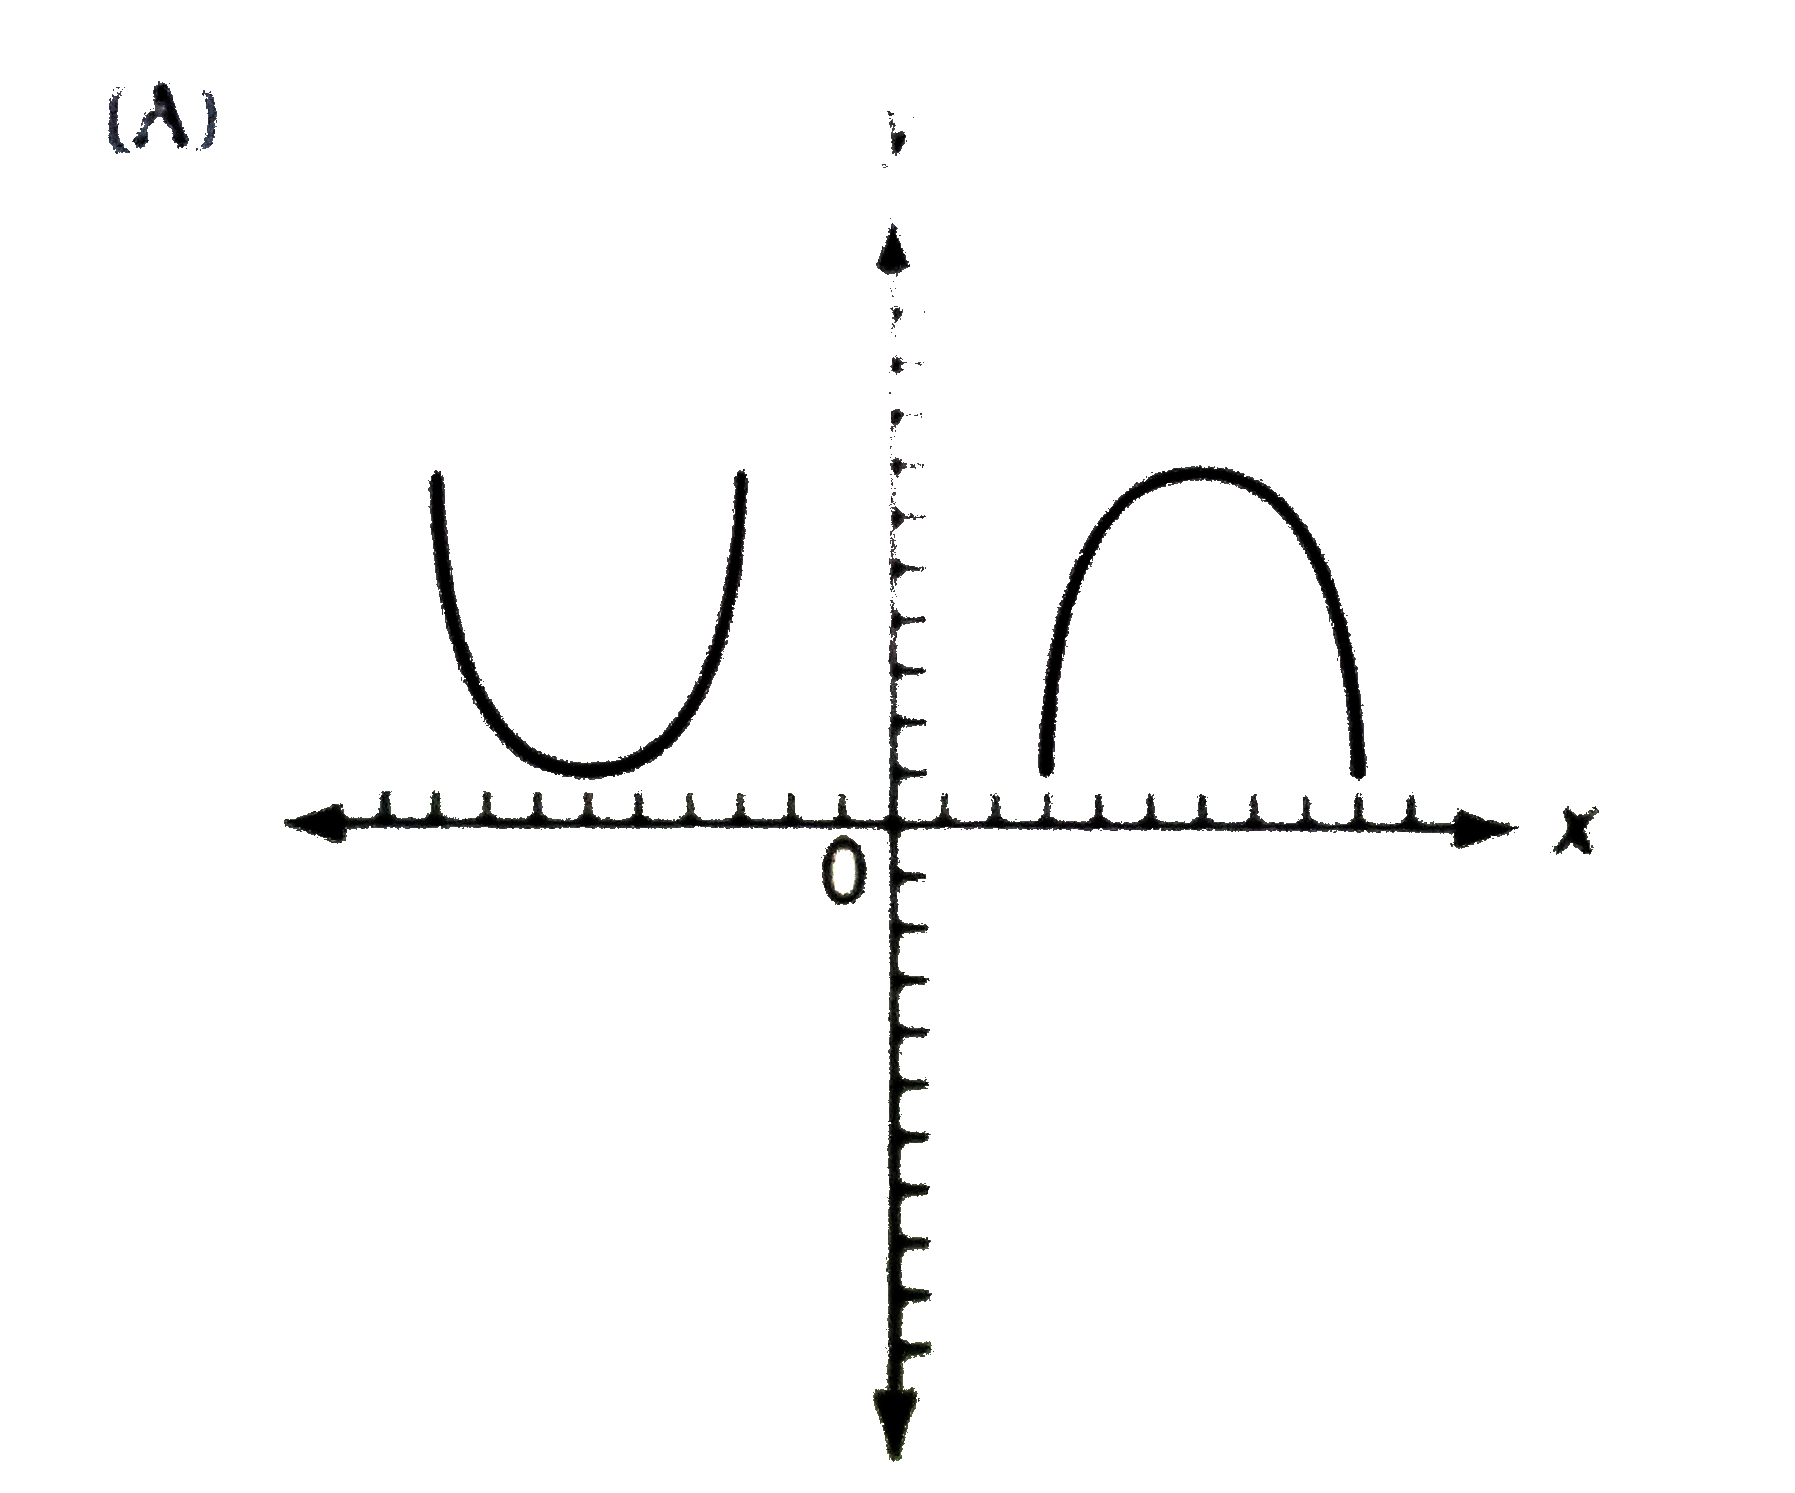 B
B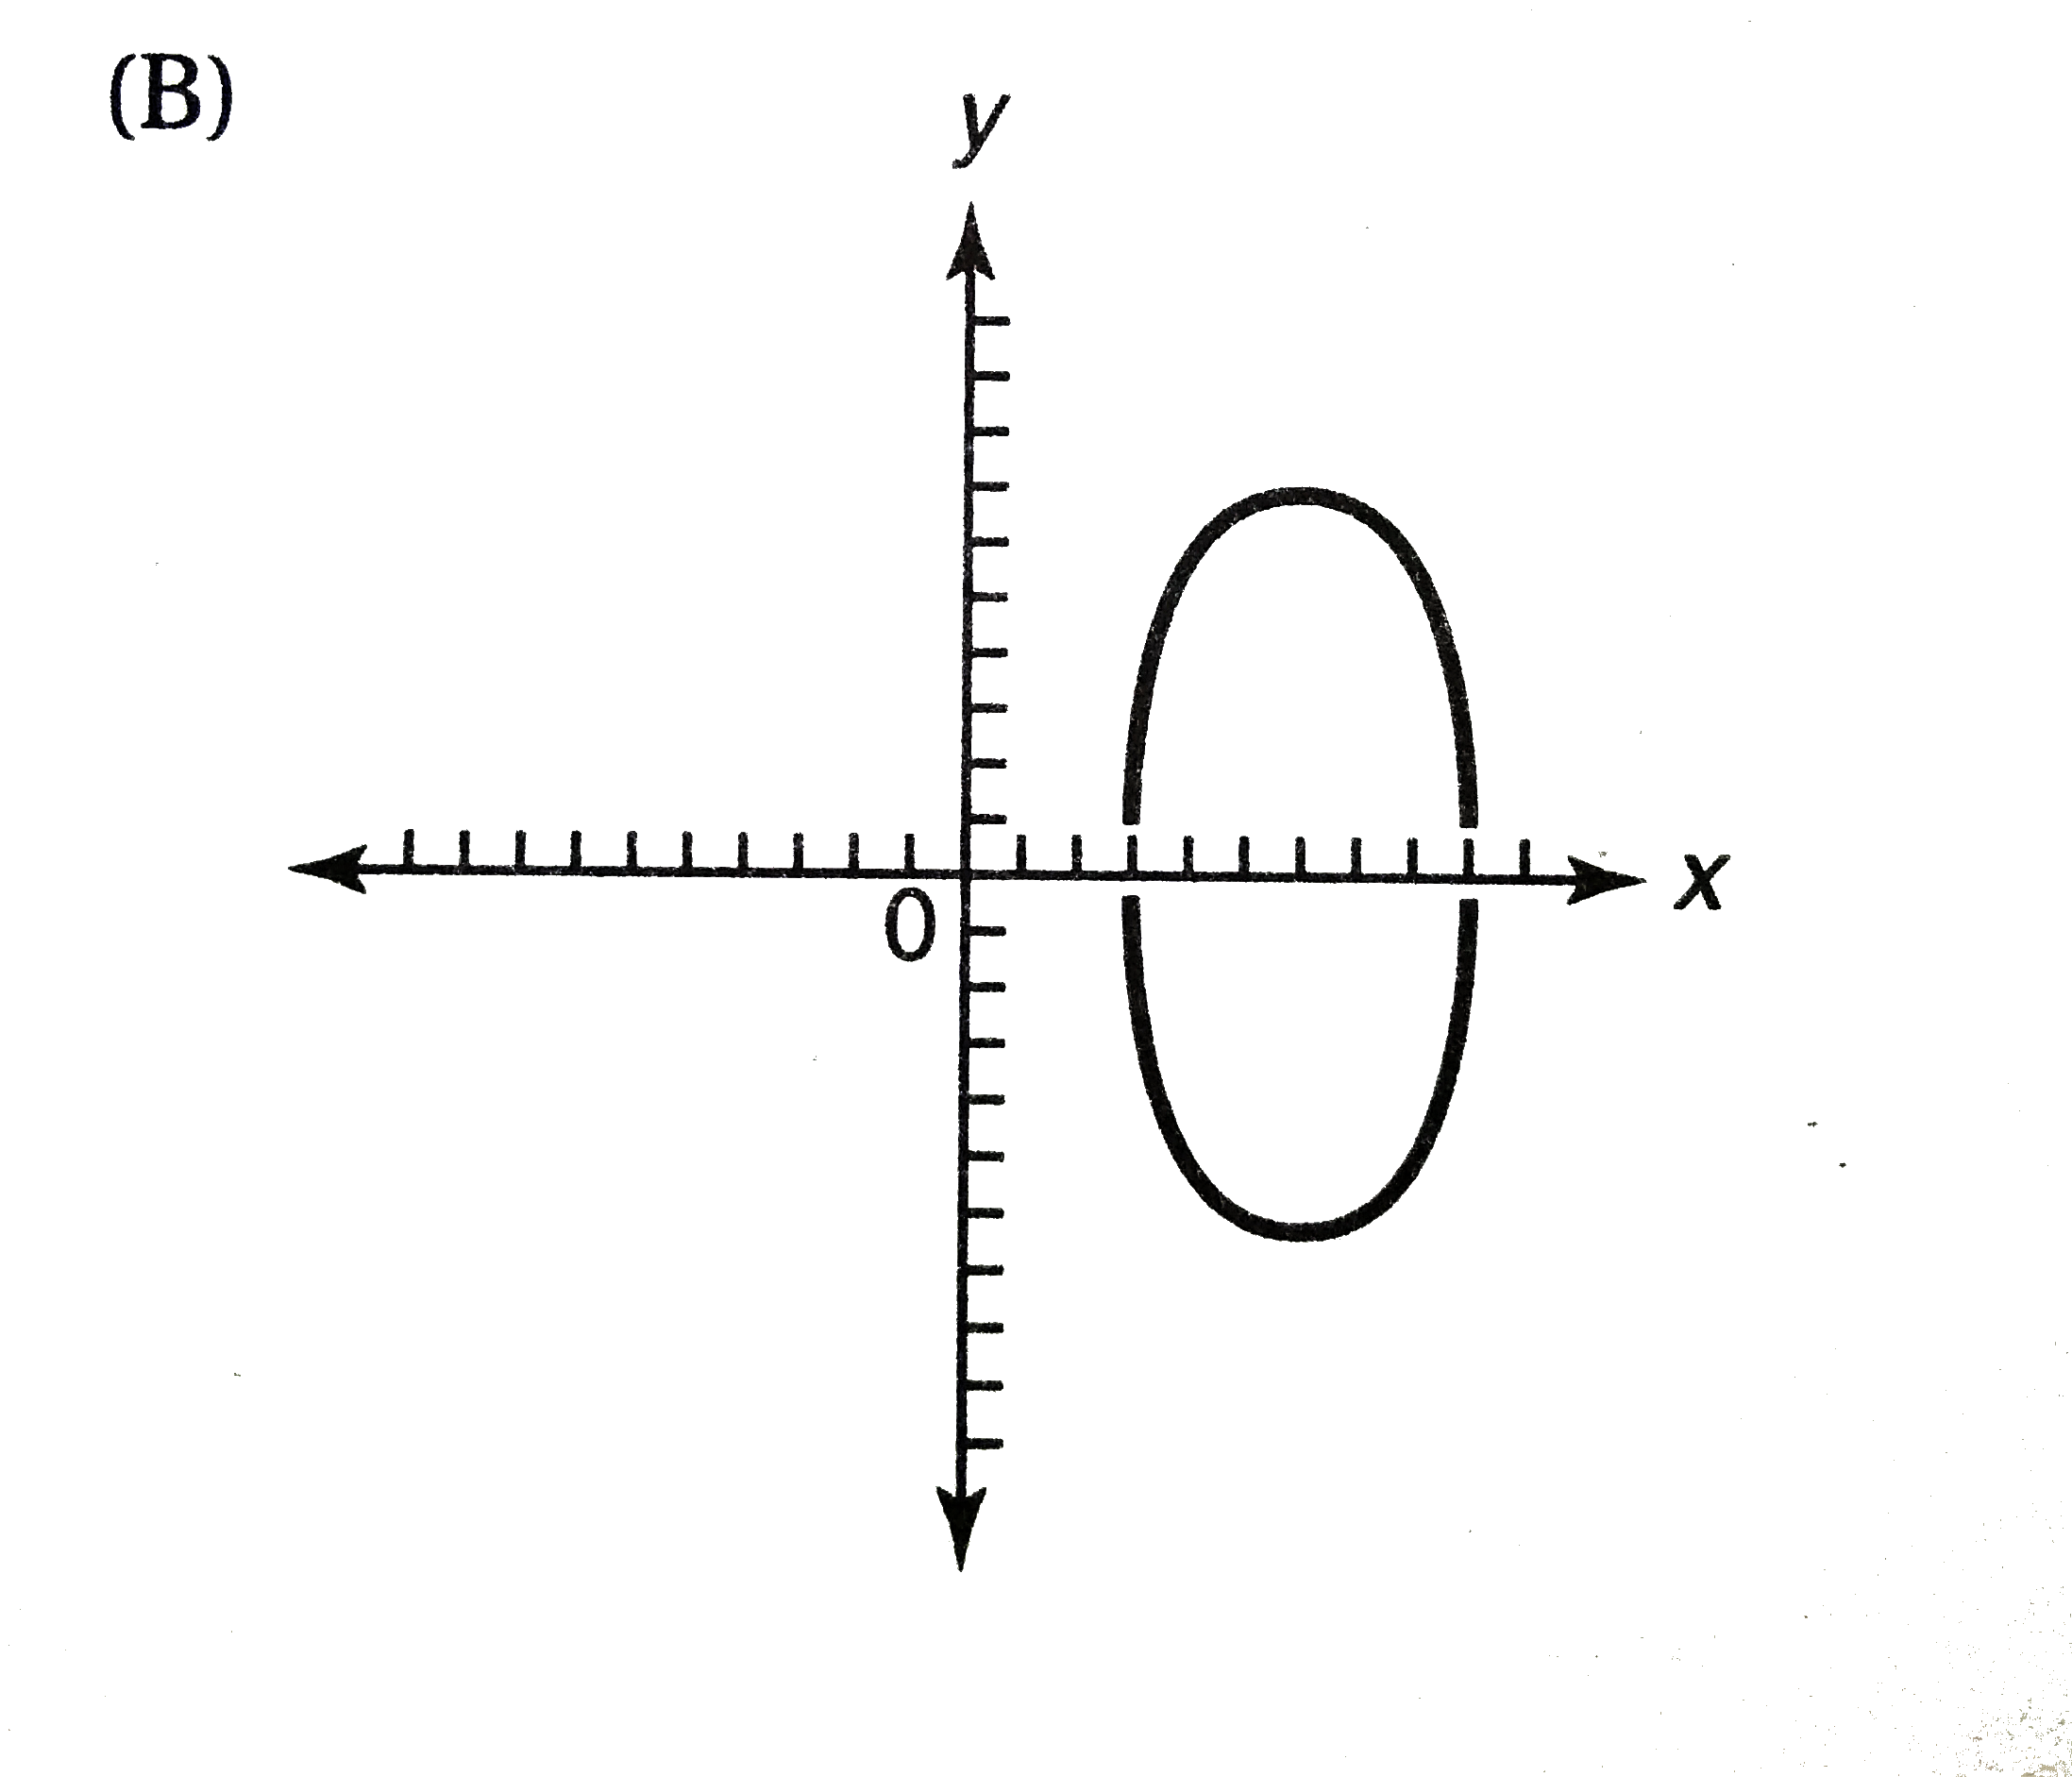 C
C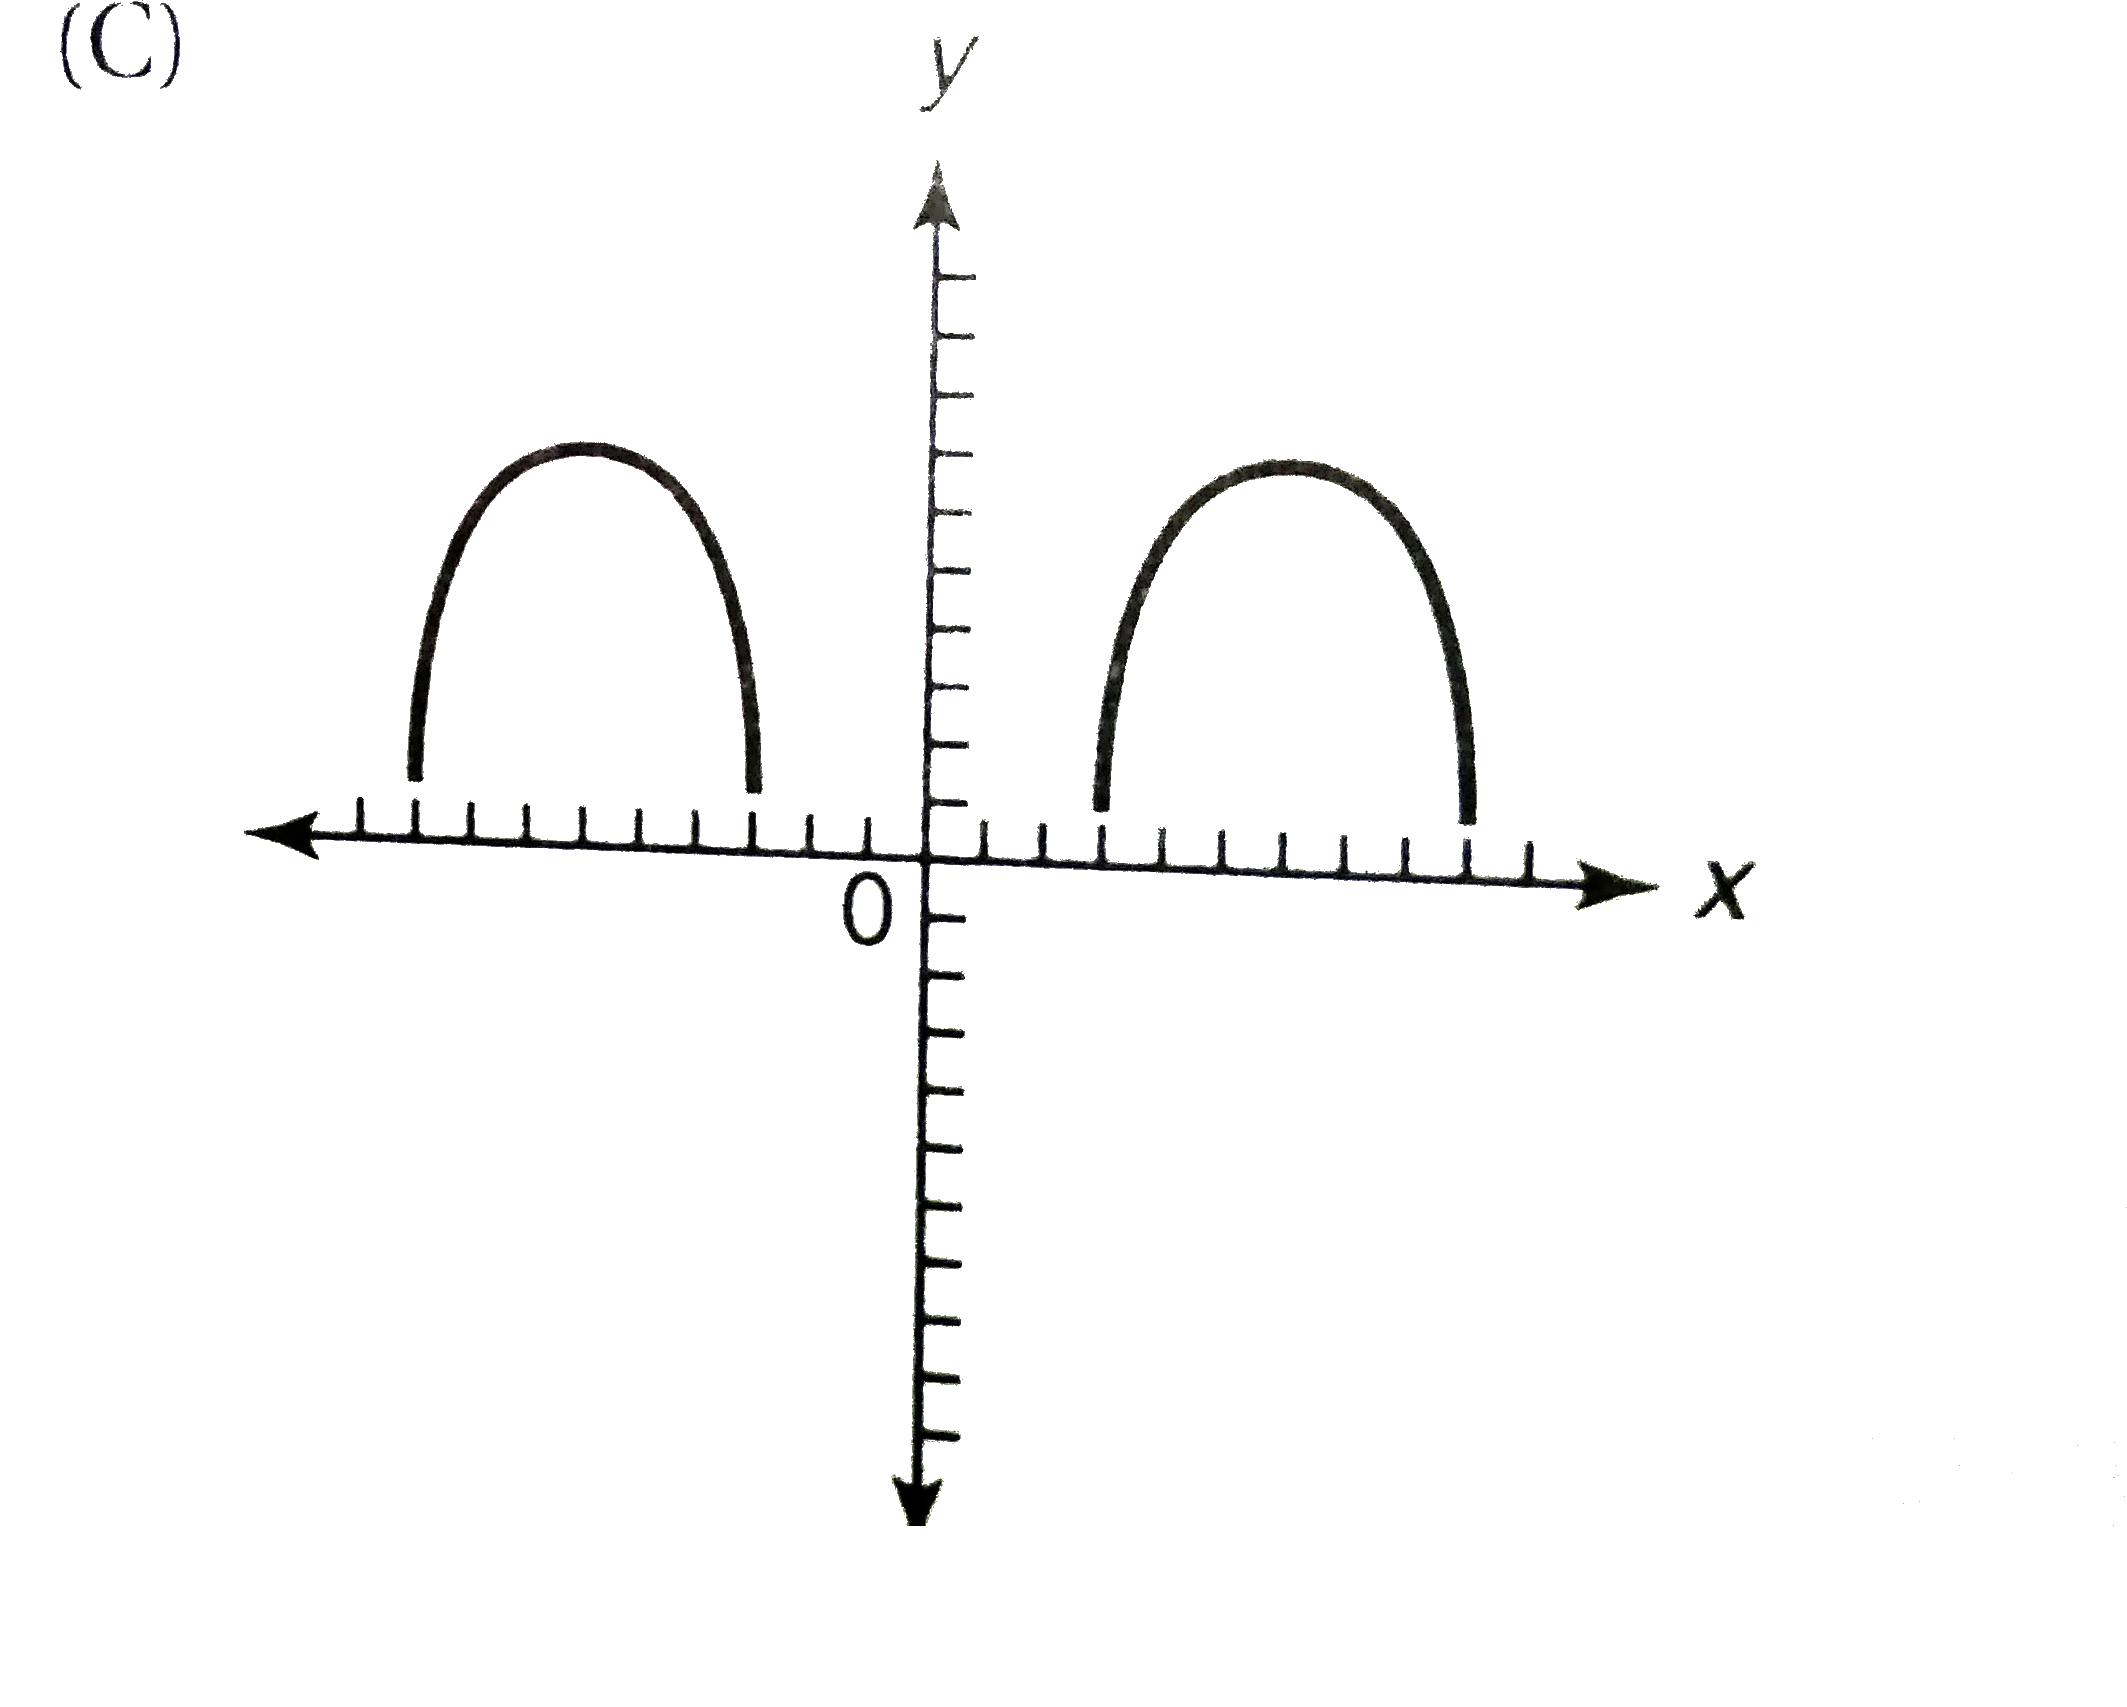 D
D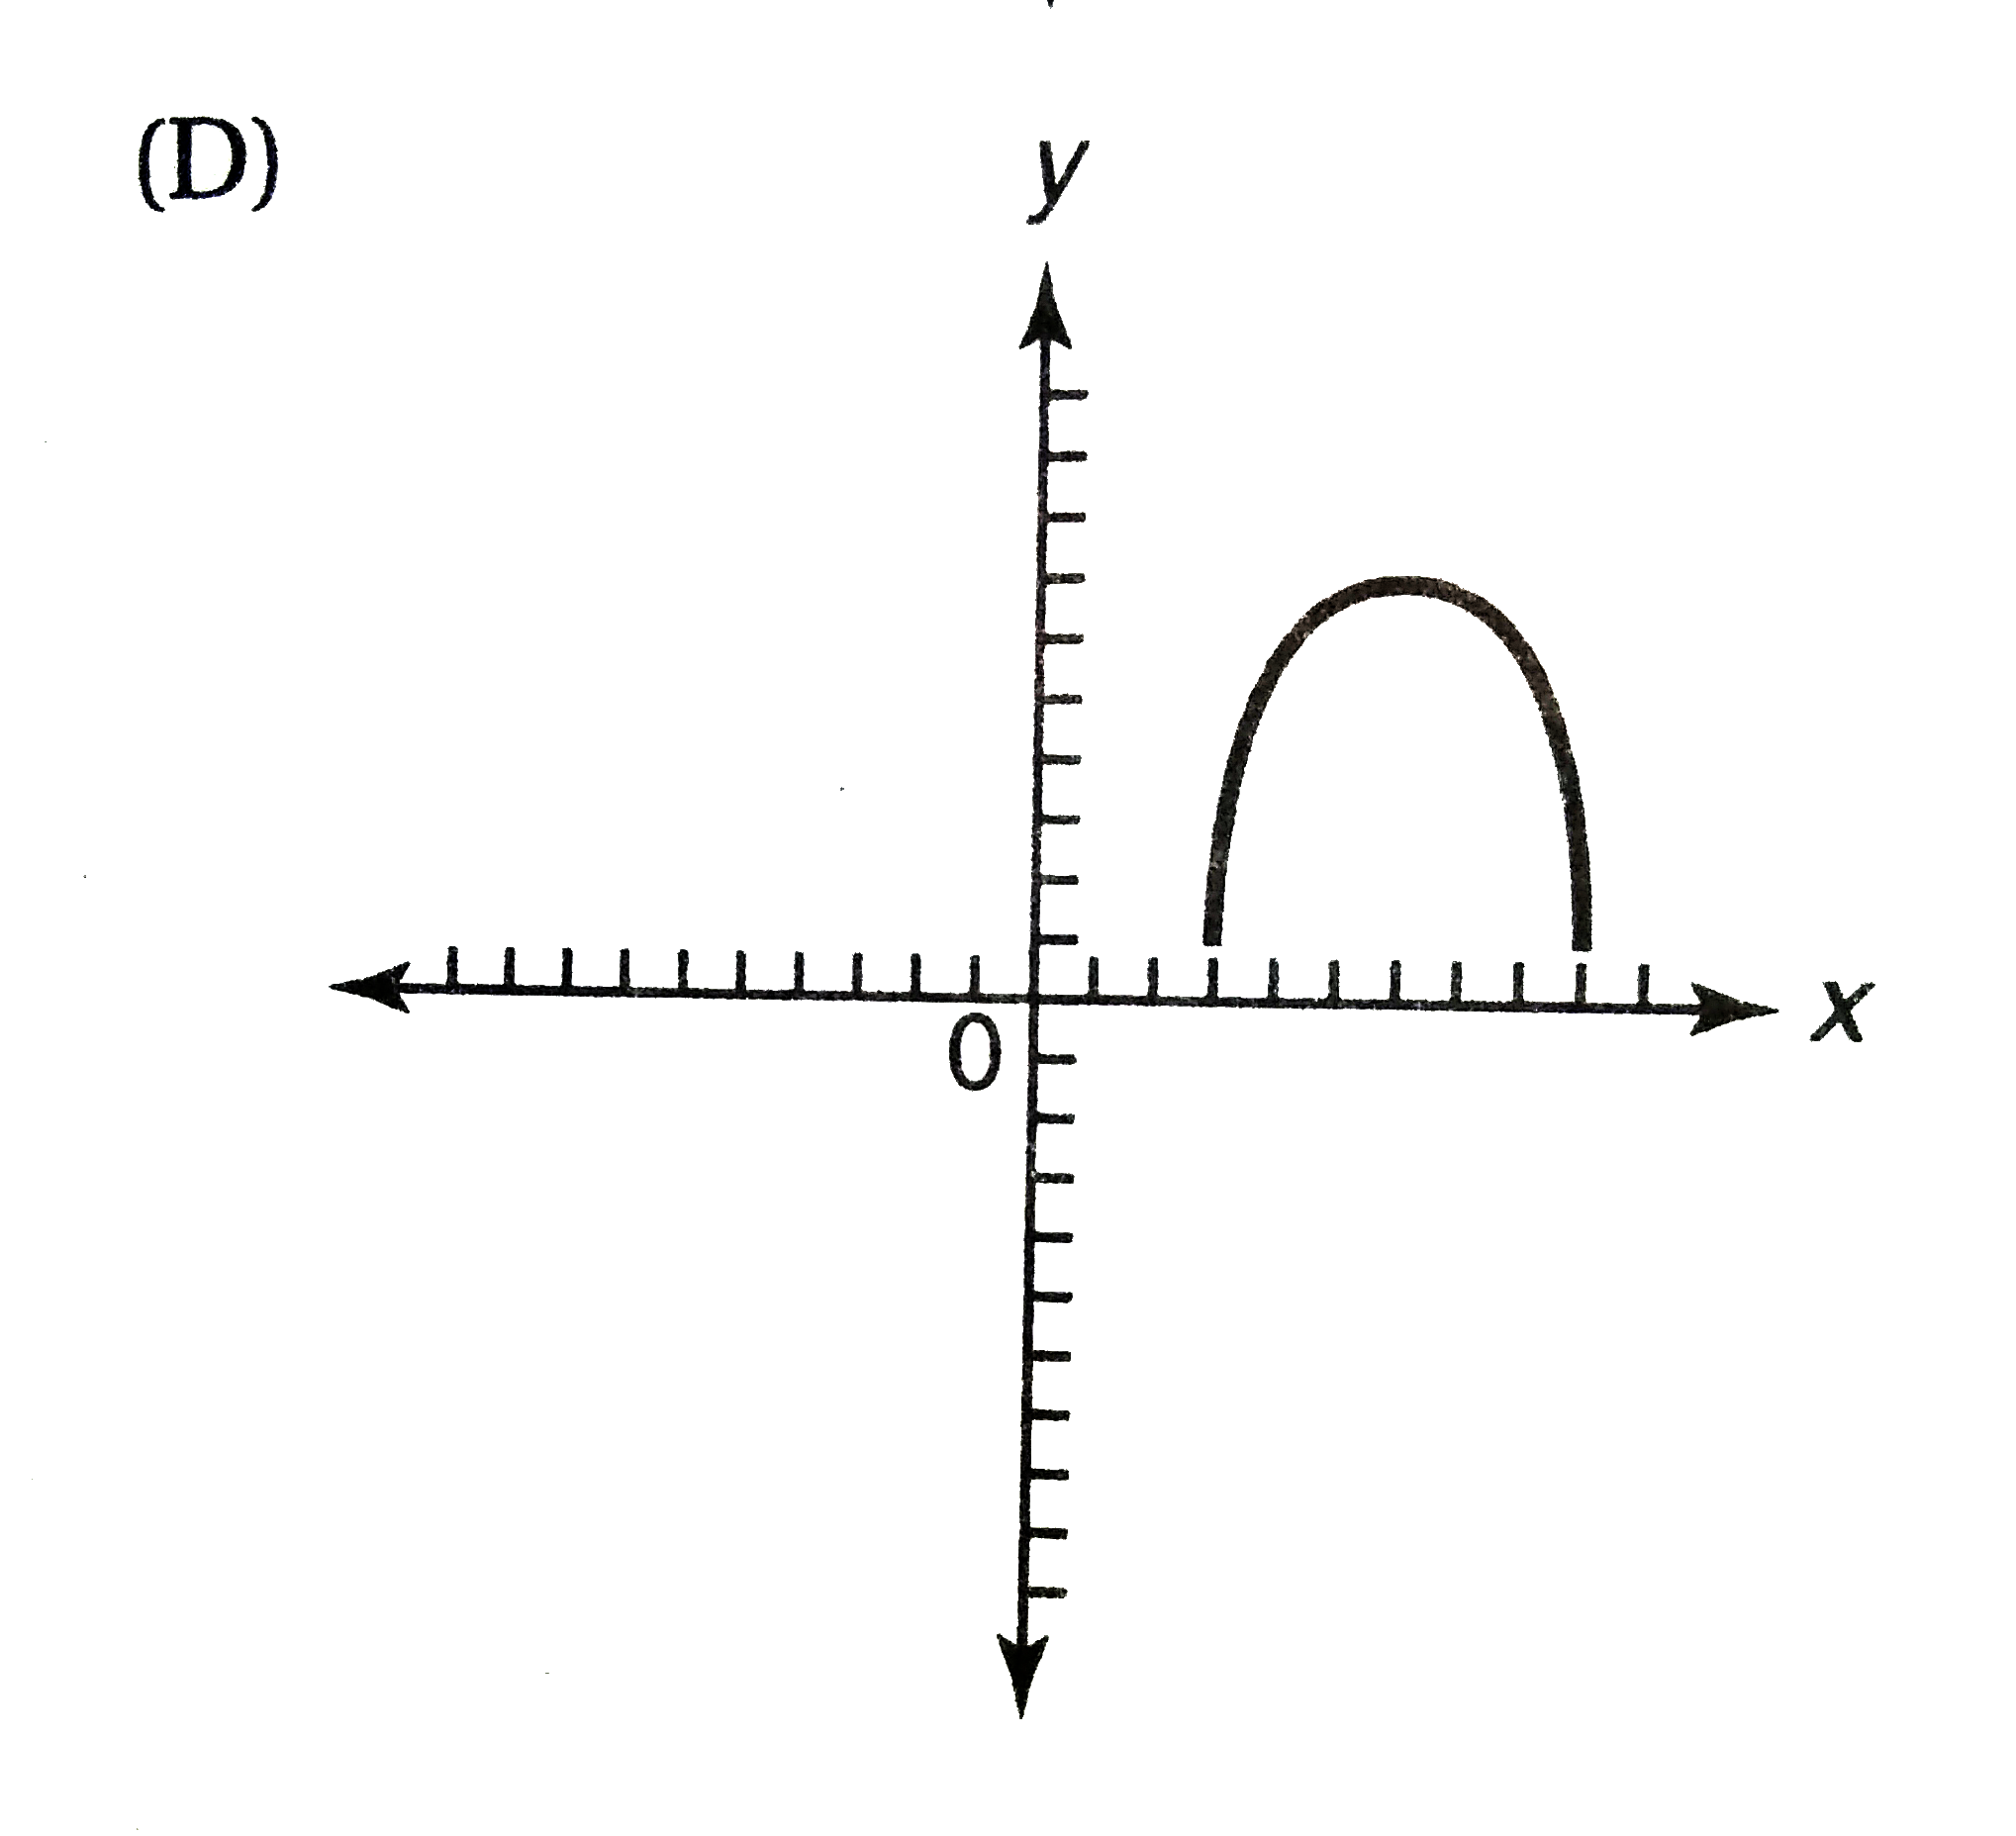
- Question 2 - Select One
If f(x)=x−7x2−49, for what value(s) of x does the graph of y=f(x) have a vertical asymptote?
A−7B0C−7,0,7D−7,7 - Question 3 - Select One
The graph of y=f(x) is shown below.
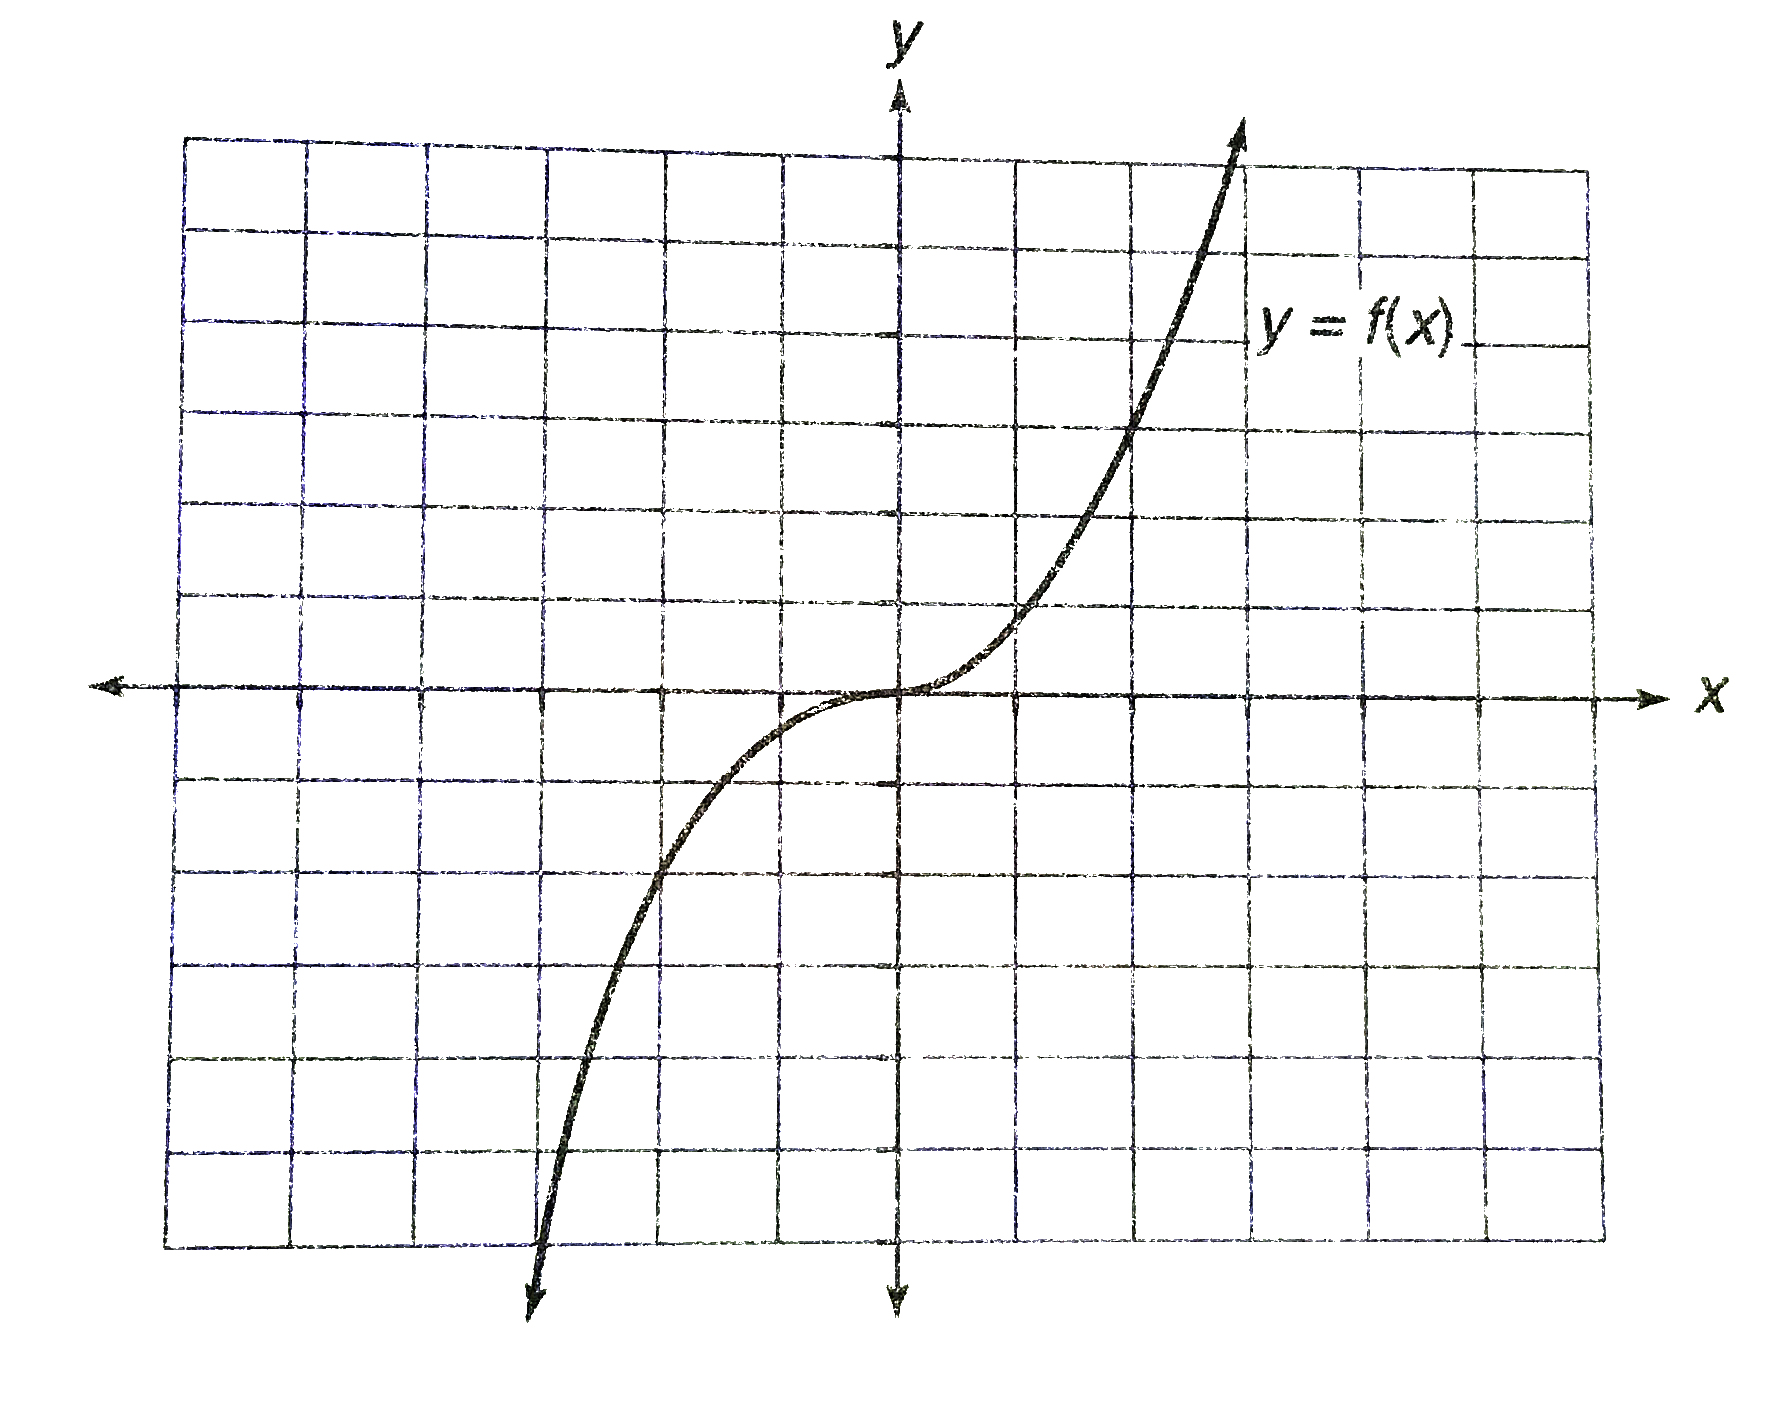
Which of the following could represents the graph of y=f(x−2)+1?A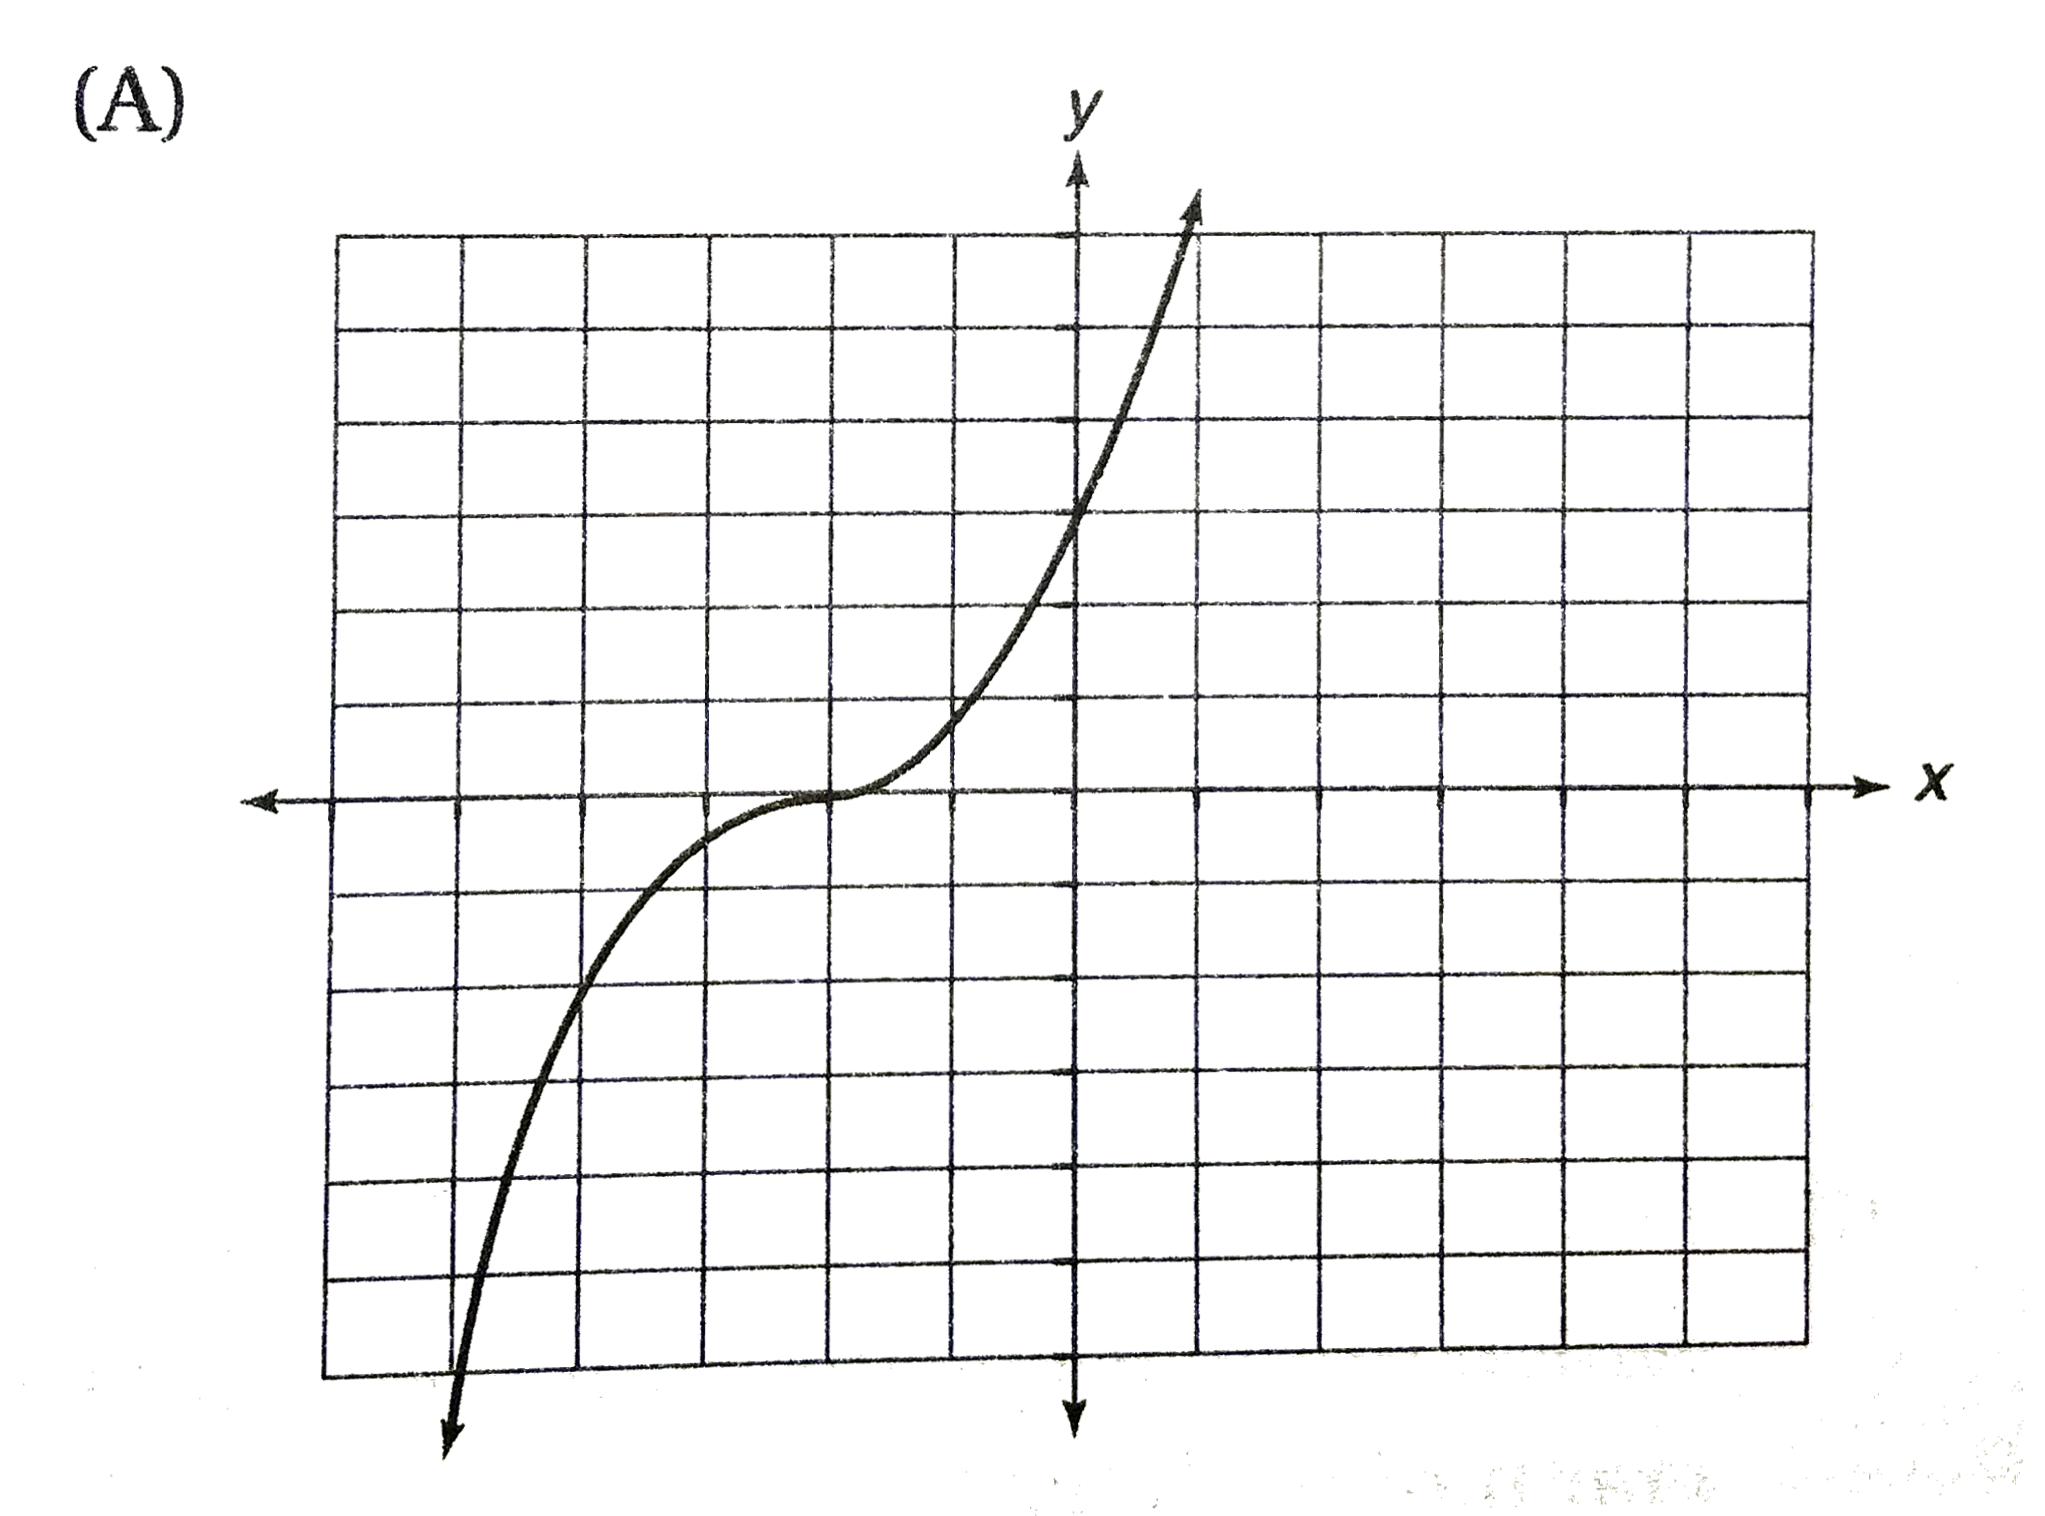 B
B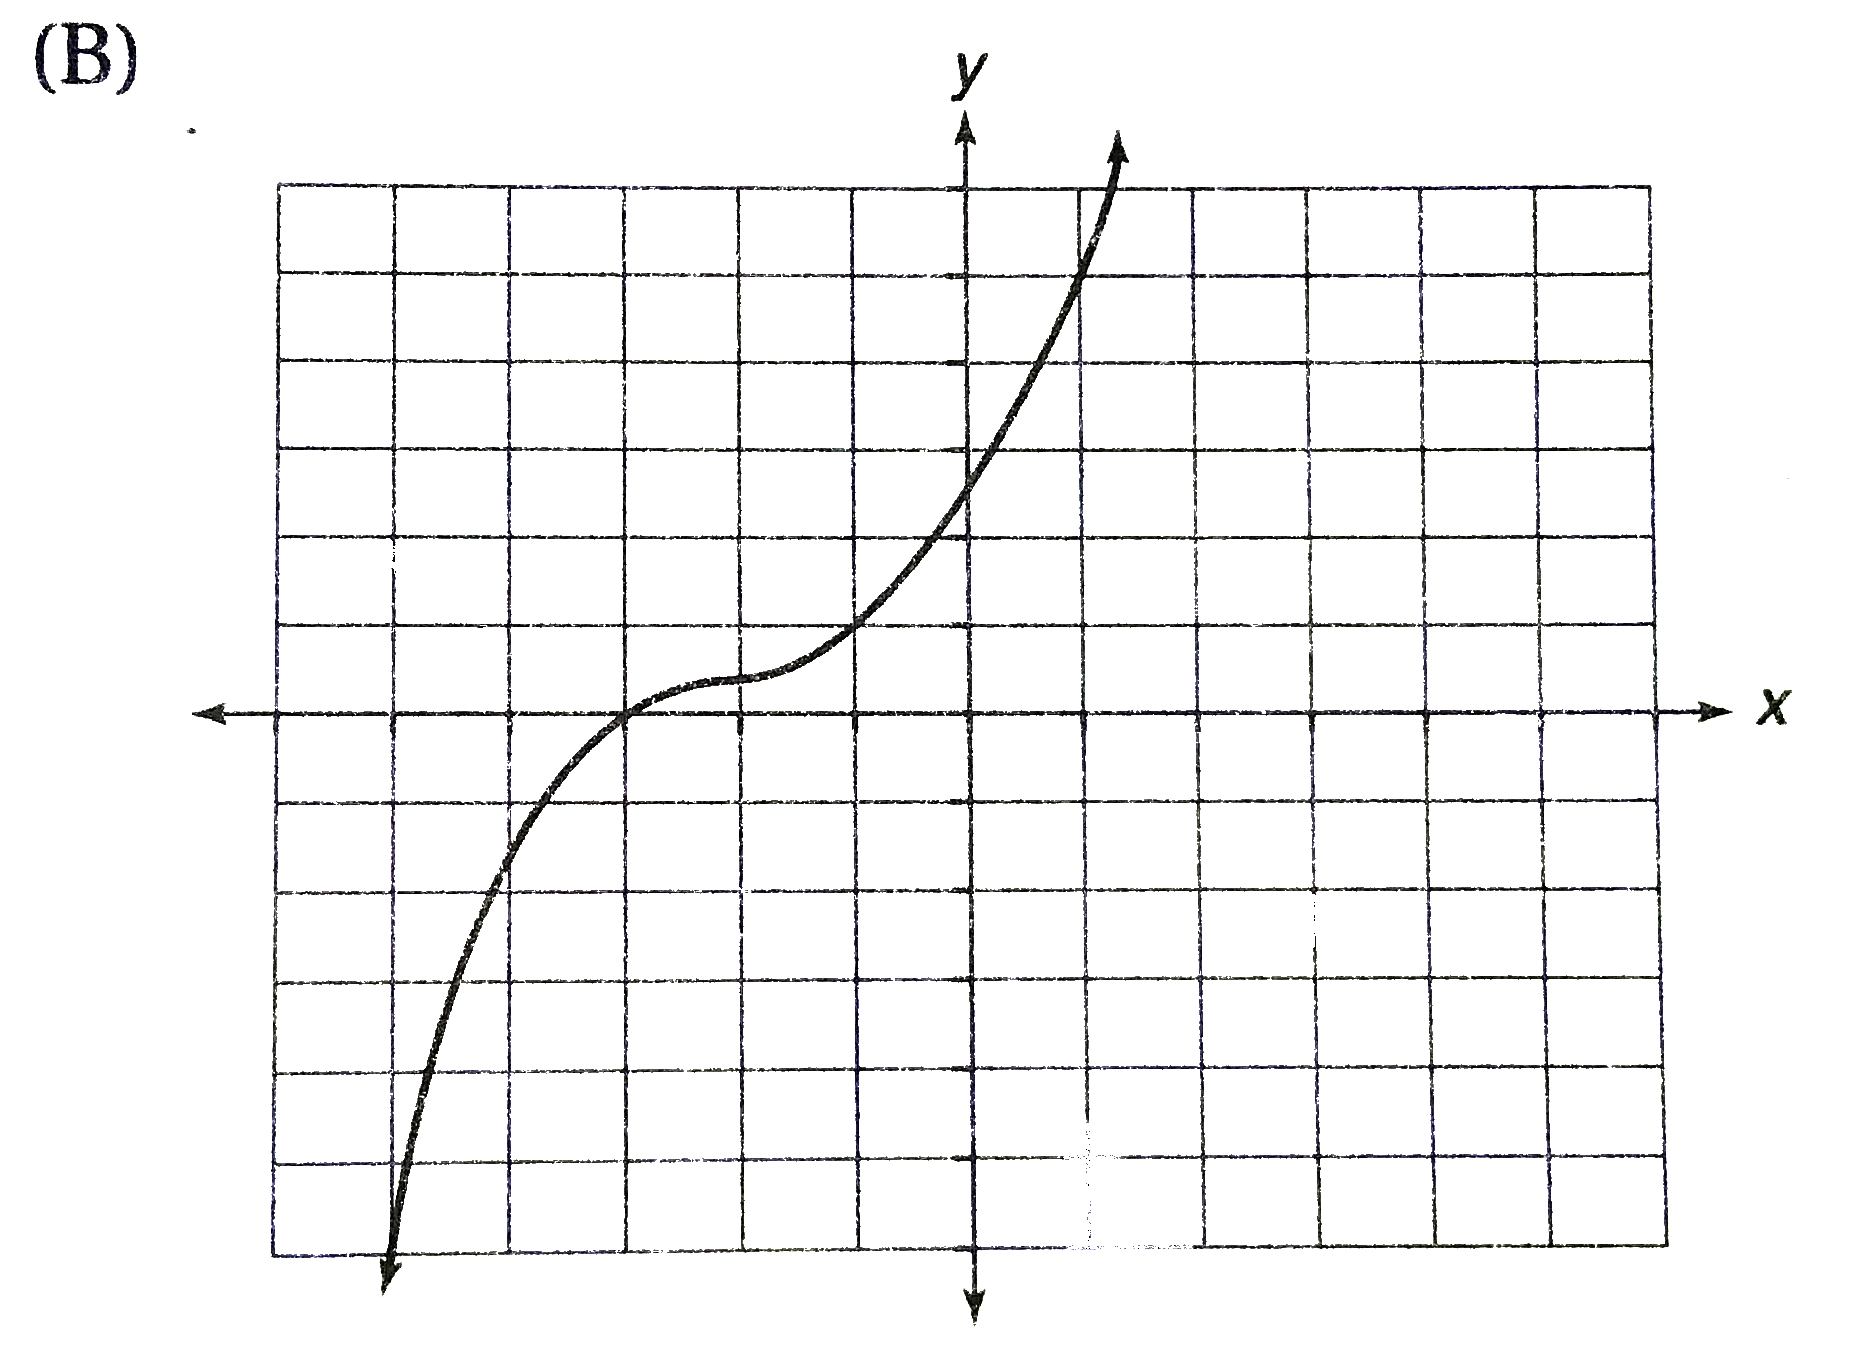 C
C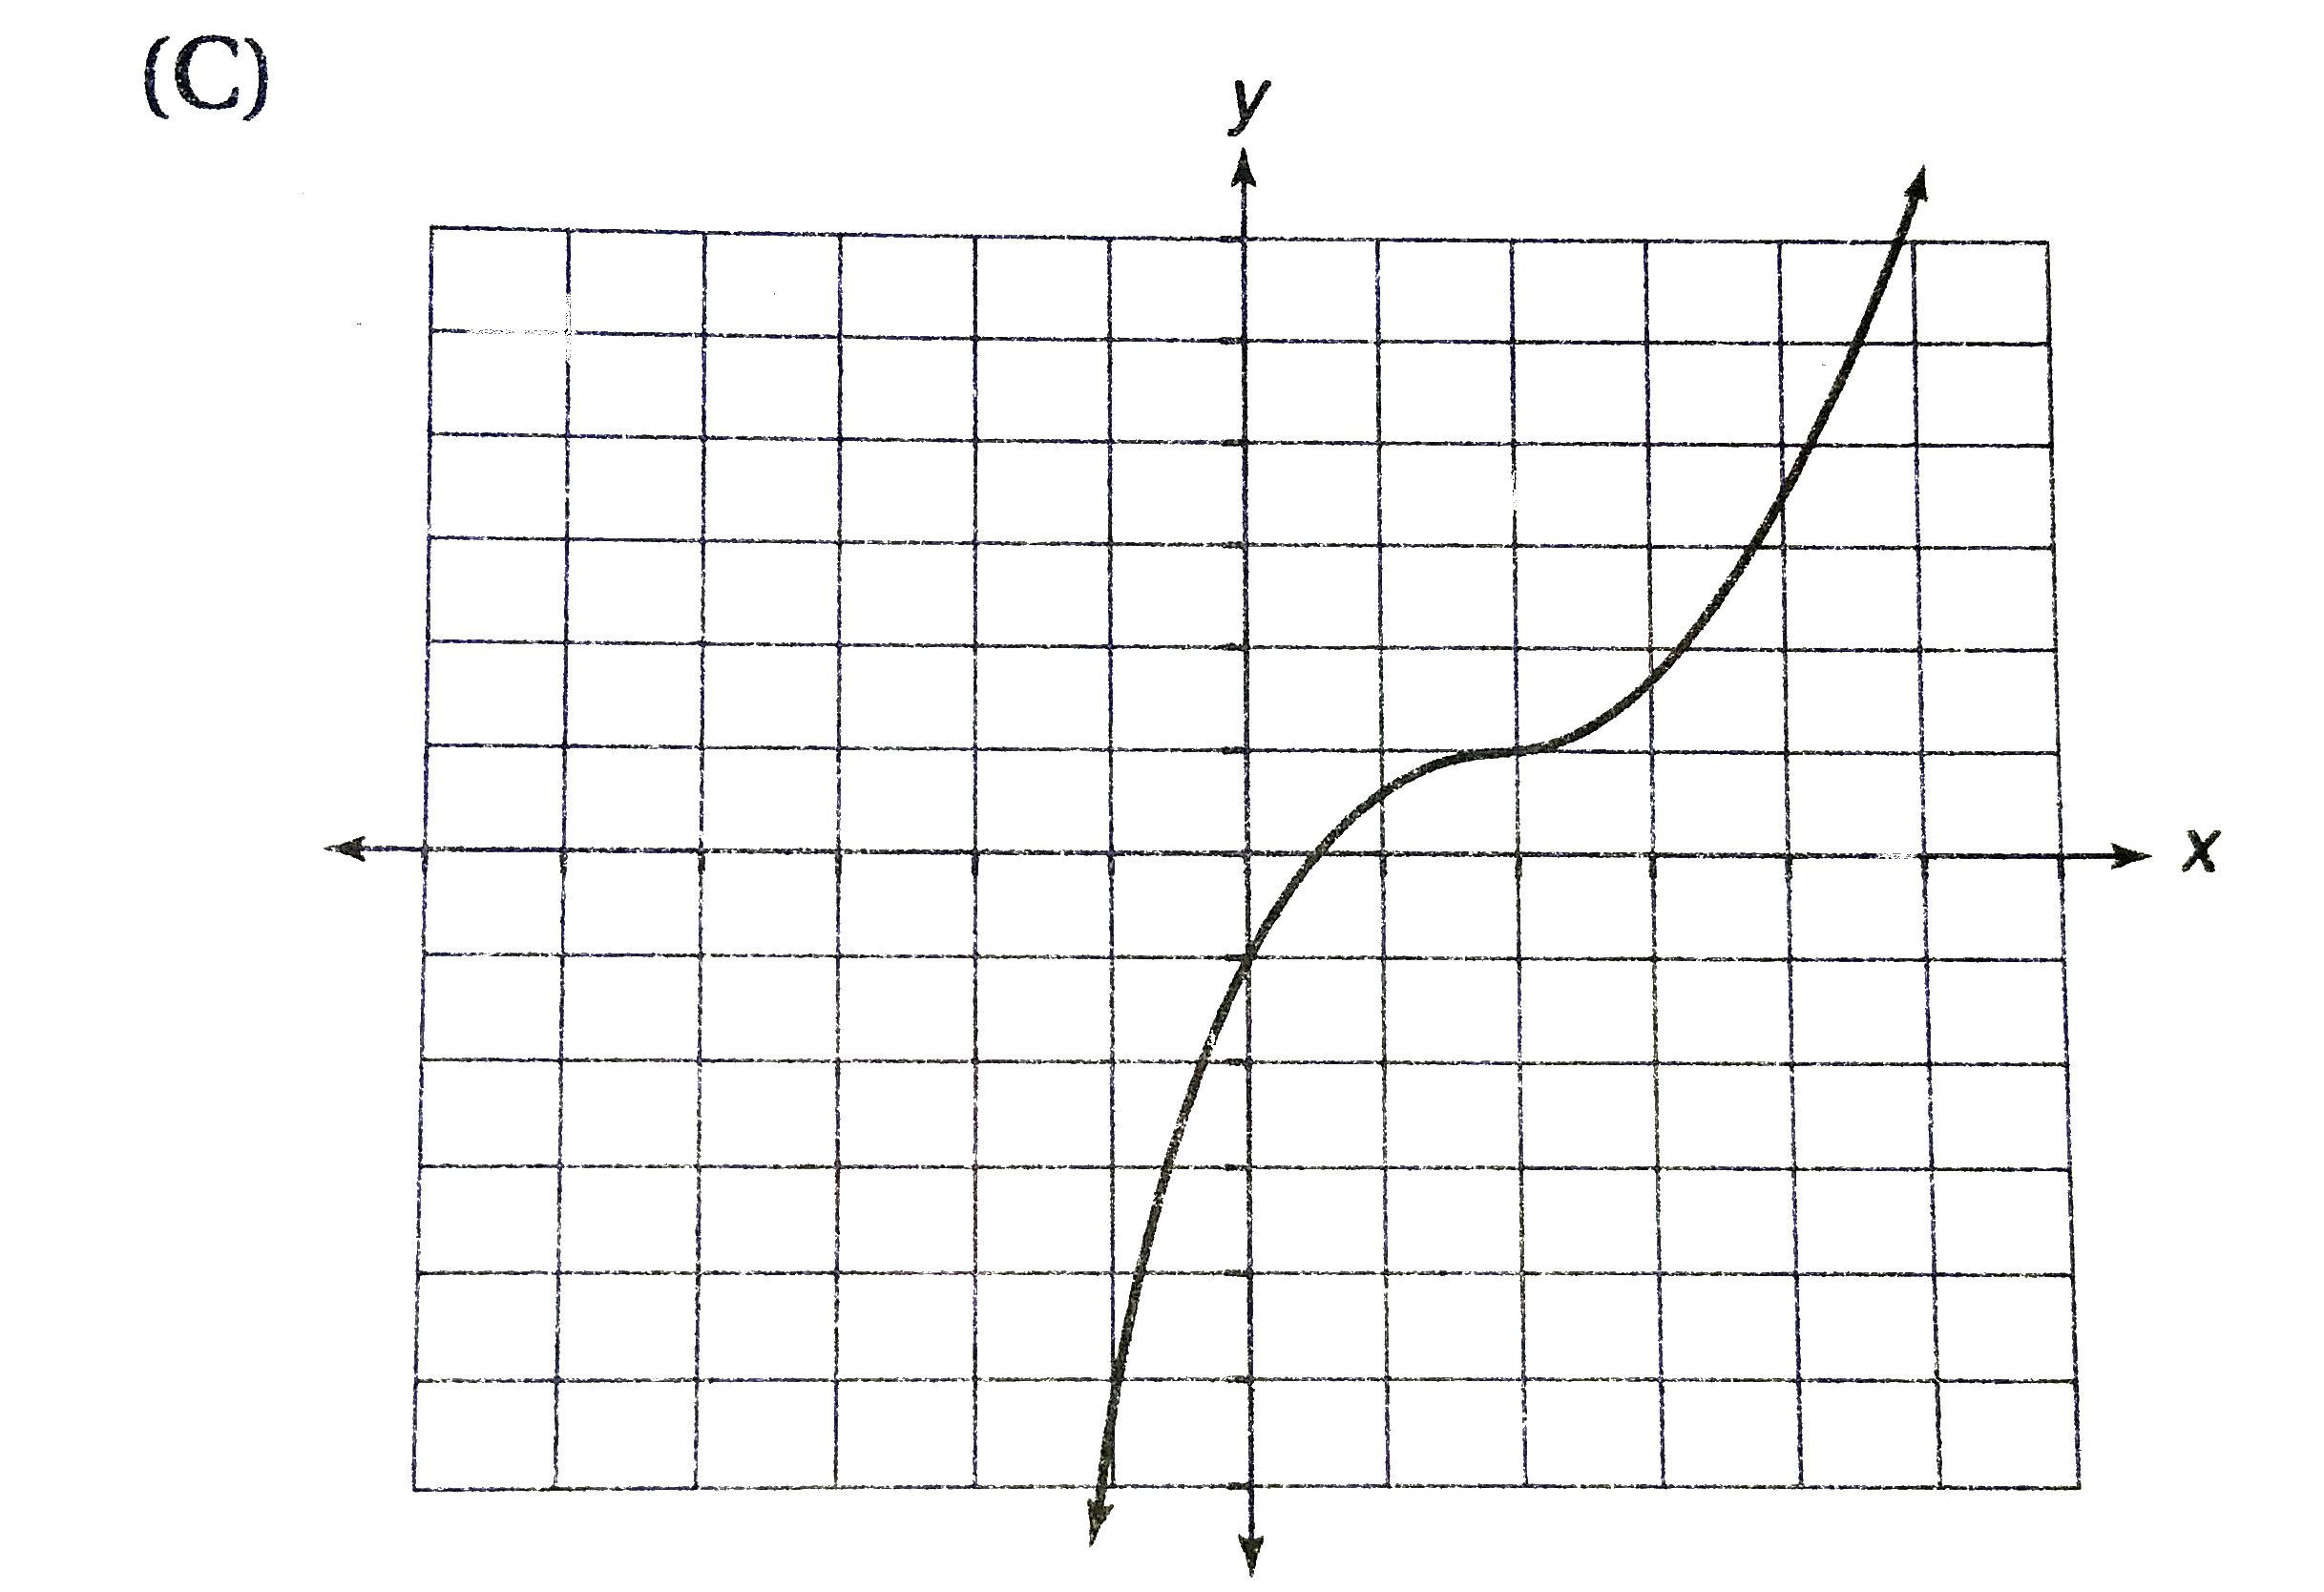 D
D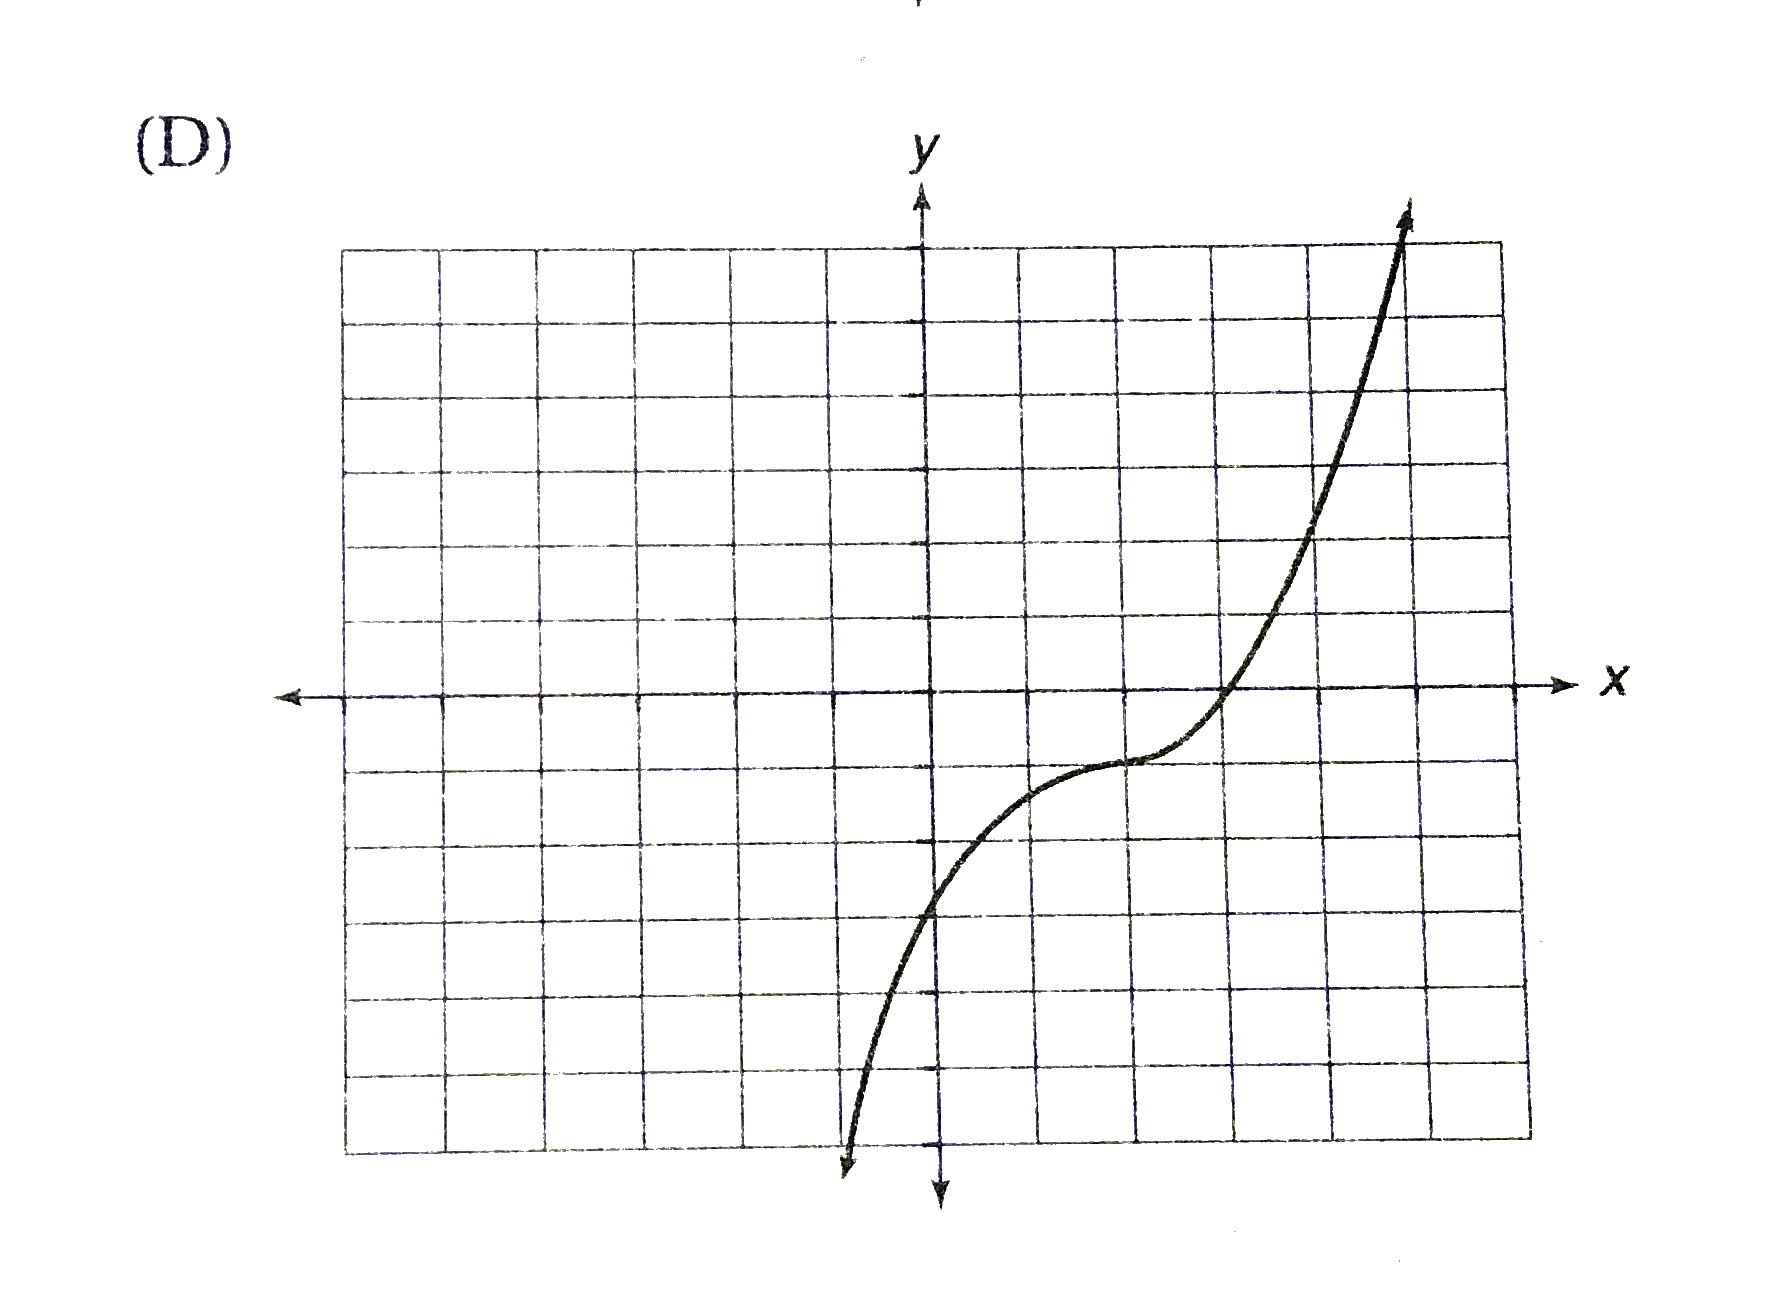
If the graph of y=|f(x)| is as shown in figure
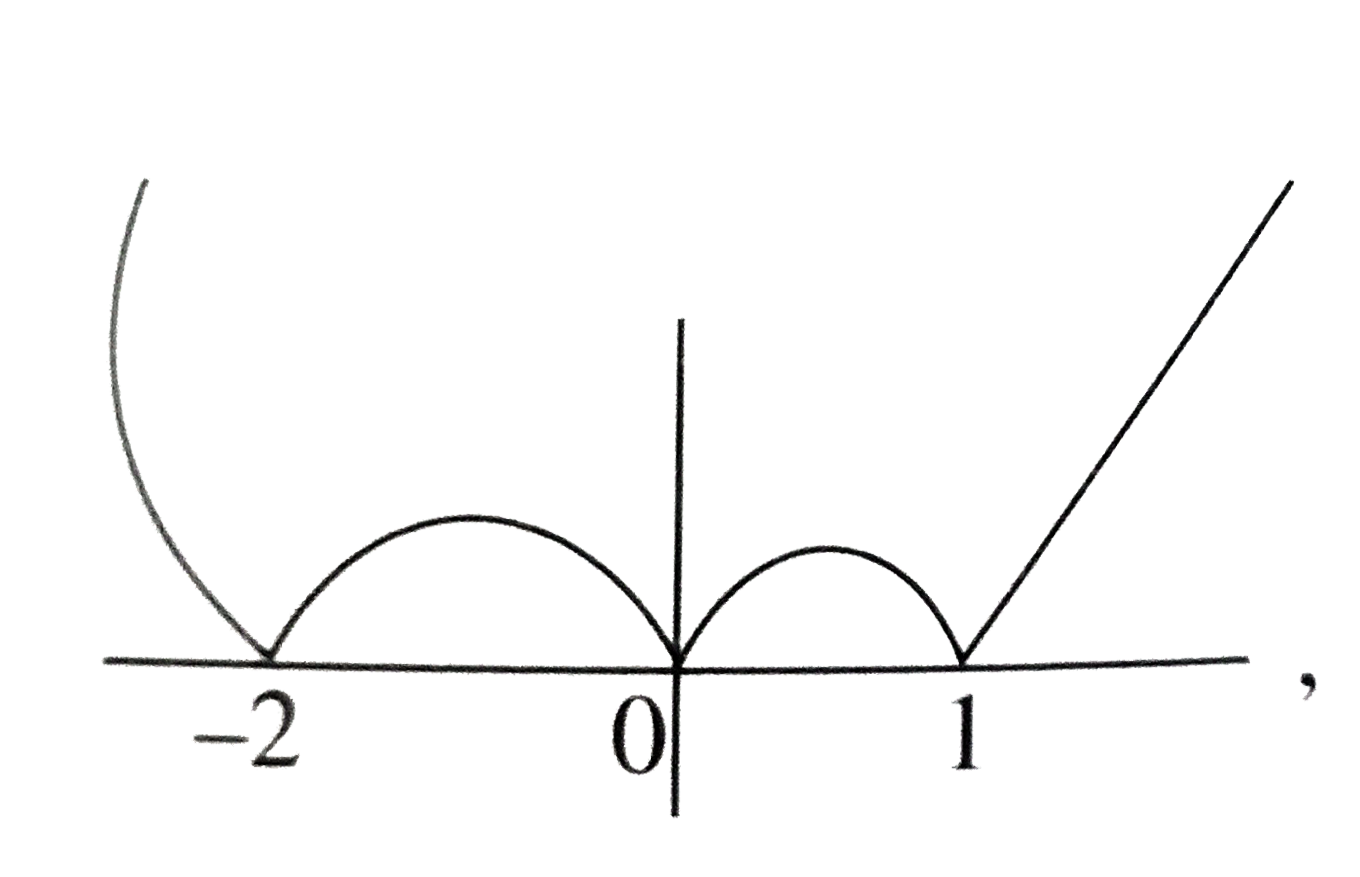 then the graph of y=f(x) may be View Solution
The graph of y =g(x) =f(X) is as shown in the following figure analyse this graph and answer the following question
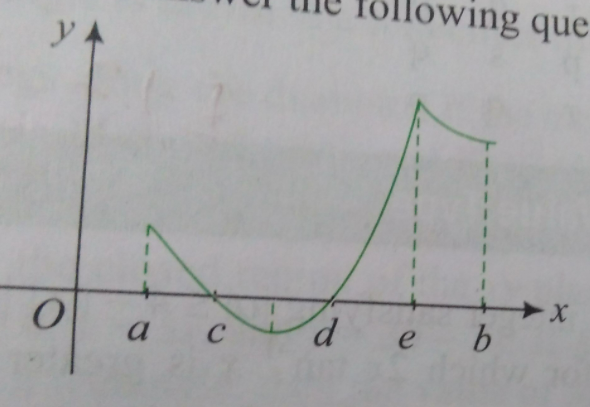
Number of points of inflectionn the graph of y = f(x) for a<x<b hasView SolutionFollowing is the graph of y = f(x).
<imga≤ocr_imageload∈g=lazysrc=https://d10lpgp6xz60nq.cloudfront.net/physics_images/CEN_GRA_C01_S01_005_Q01.pngwh=80%mx-autosty≤=background:white;><br>F∈dthes√oftheequation f(x) = 0, f(x) = 4 and f(x) = 10.View Solutionf(x)=2x+1
The function f is defined by the equation above which of the following is the graph of y=−f(x) in the xy-plane?View Solutiony=f(x) is a function which satisfies f(0)=0,f''(x)=f'(x) and f'(0)=1 then the area bounded by the graph of y=f(x), the lines x=0,x−1=0 and y+1=0 is
View Solution

