f(x)=2x+1
The function f is defined by the equation above which of the following is the graph of y=−f(x) in the xy-plane?
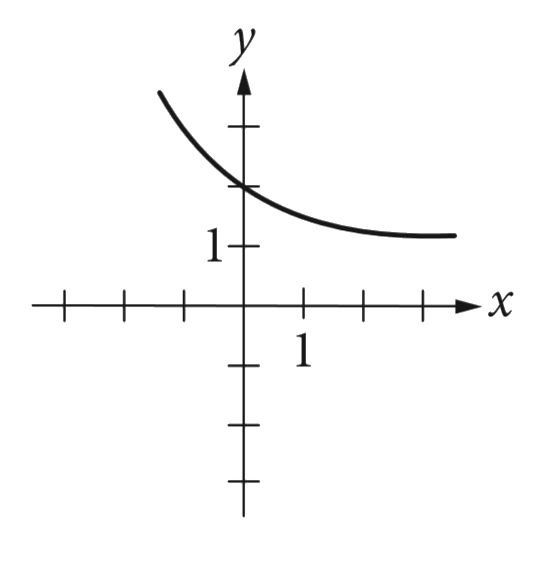
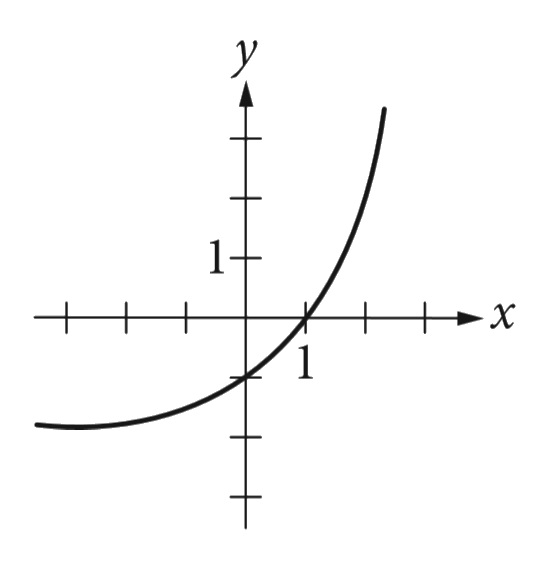
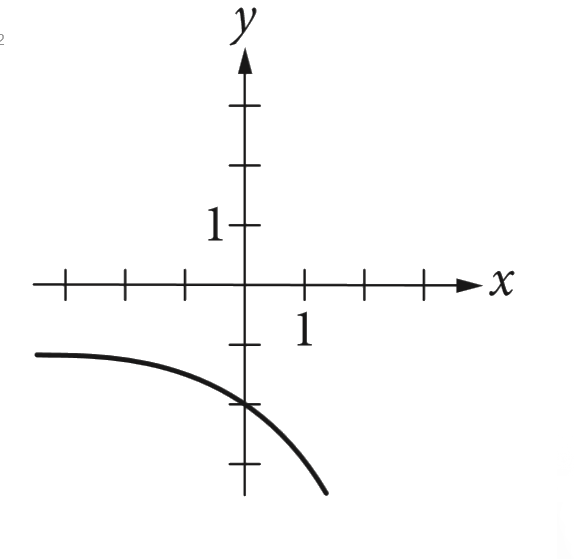
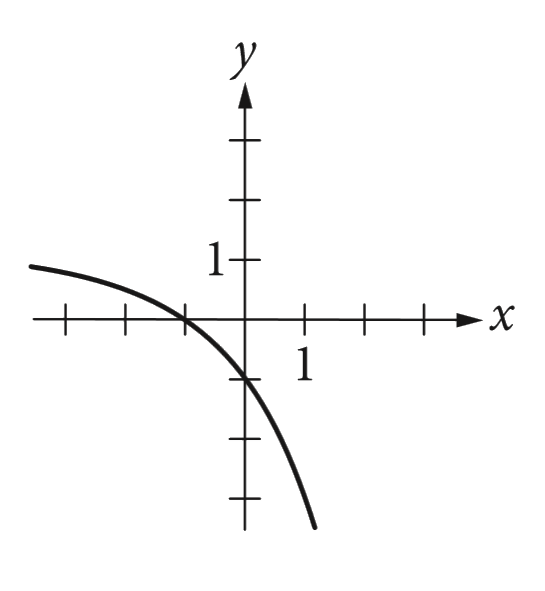
To solve the problem, we need to find the graph of the function y=−f(x) where f(x)=2x+1.
1. Define the Function:
We start with the function given in the problem:
f(x)=2x+1
2. Find −f(x):
To find y=−f(x), we substitute f(x) into the equation:
y=−f(x)=−(2x+1)
This simplifies to:
y=−2x−1
3. Analyze the New Function:
The new function y=−2x−1 is a transformation of the original exponential function 2x. The negative sign indicates a reflection across the x-axis, and the subtraction of 1 indicates a downward shift by 1 unit.
4. Identify Key Points:
To understand the graph of y=−2x−1, we can calculate a few key points:
- For x=0:
y=−20−1=−1−1=−2
- For x=1:
y=−21−1=−2−1=−3
- For x=−1:
y=−2−1−1=−12−1=−32
5. Graph Characteristics:
- The graph will approach y=−1 as x approaches infinity (horizontal asymptote).
- As x approaches negative infinity, y will approach negative infinity.
- The graph will be decreasing, starting from y=−1 when x is very large and going downwards as x decreases.
6. Compare with Options:
Now, we compare the derived function y=−2x−1 with the provided graph options. We look for the graph that passes through the points we calculated and has the correct behavior as described.
Conclusion:
After analyzing the options, we find that option C corresponds to the function y=−2x−1 based on the key points and characteristics we derived.
We start with the function given in the problem:
f(x)=2x+1
To find y=−f(x), we substitute f(x) into the equation:
y=−f(x)=−(2x+1)
This simplifies to:
y=−2x−1
The new function y=−2x−1 is a transformation of the original exponential function 2x. The negative sign indicates a reflection across the x-axis, and the subtraction of 1 indicates a downward shift by 1 unit.
To understand the graph of y=−2x−1, we can calculate a few key points:
- For x=0:
y=−20−1=−1−1=−2
- For x=1:
y=−21−1=−2−1=−3
- For x=−1:
y=−2−1−1=−12−1=−32
- The graph will approach y=−1 as x approaches infinity (horizontal asymptote).
- As x approaches negative infinity, y will approach negative infinity.
- The graph will be decreasing, starting from y=−1 when x is very large and going downwards as x decreases.
Now, we compare the derived function y=−2x−1 with the provided graph options. We look for the graph that passes through the points we calculated and has the correct behavior as described.
After analyzing the options, we find that option C corresponds to the function y=−2x−1 based on the key points and characteristics we derived.
Similar Questions
Knowledge Check
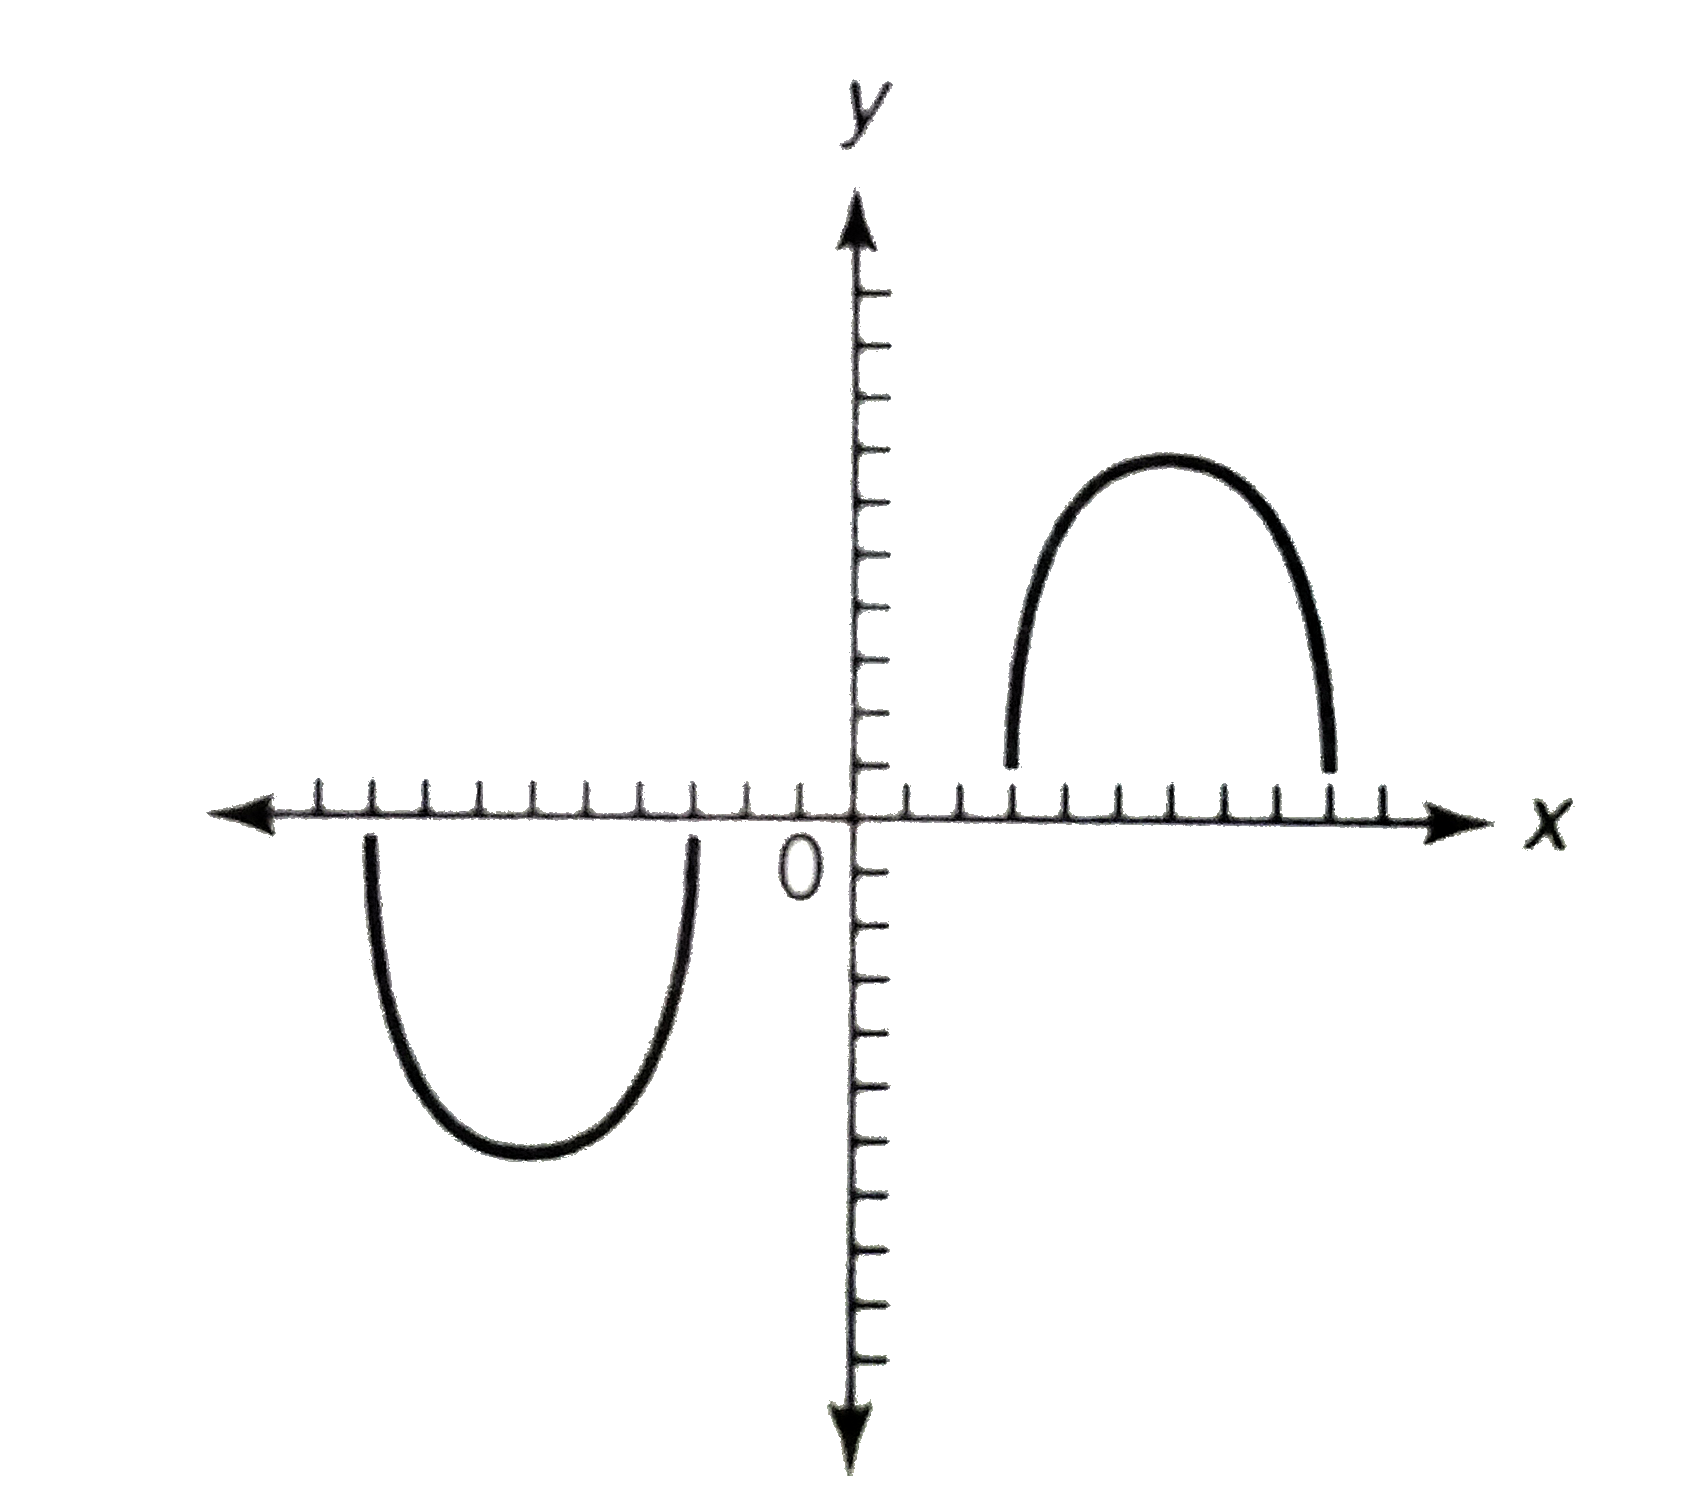
The graph of the function f is shown above. Which of the following could represent the graph of y=|f(x)|?A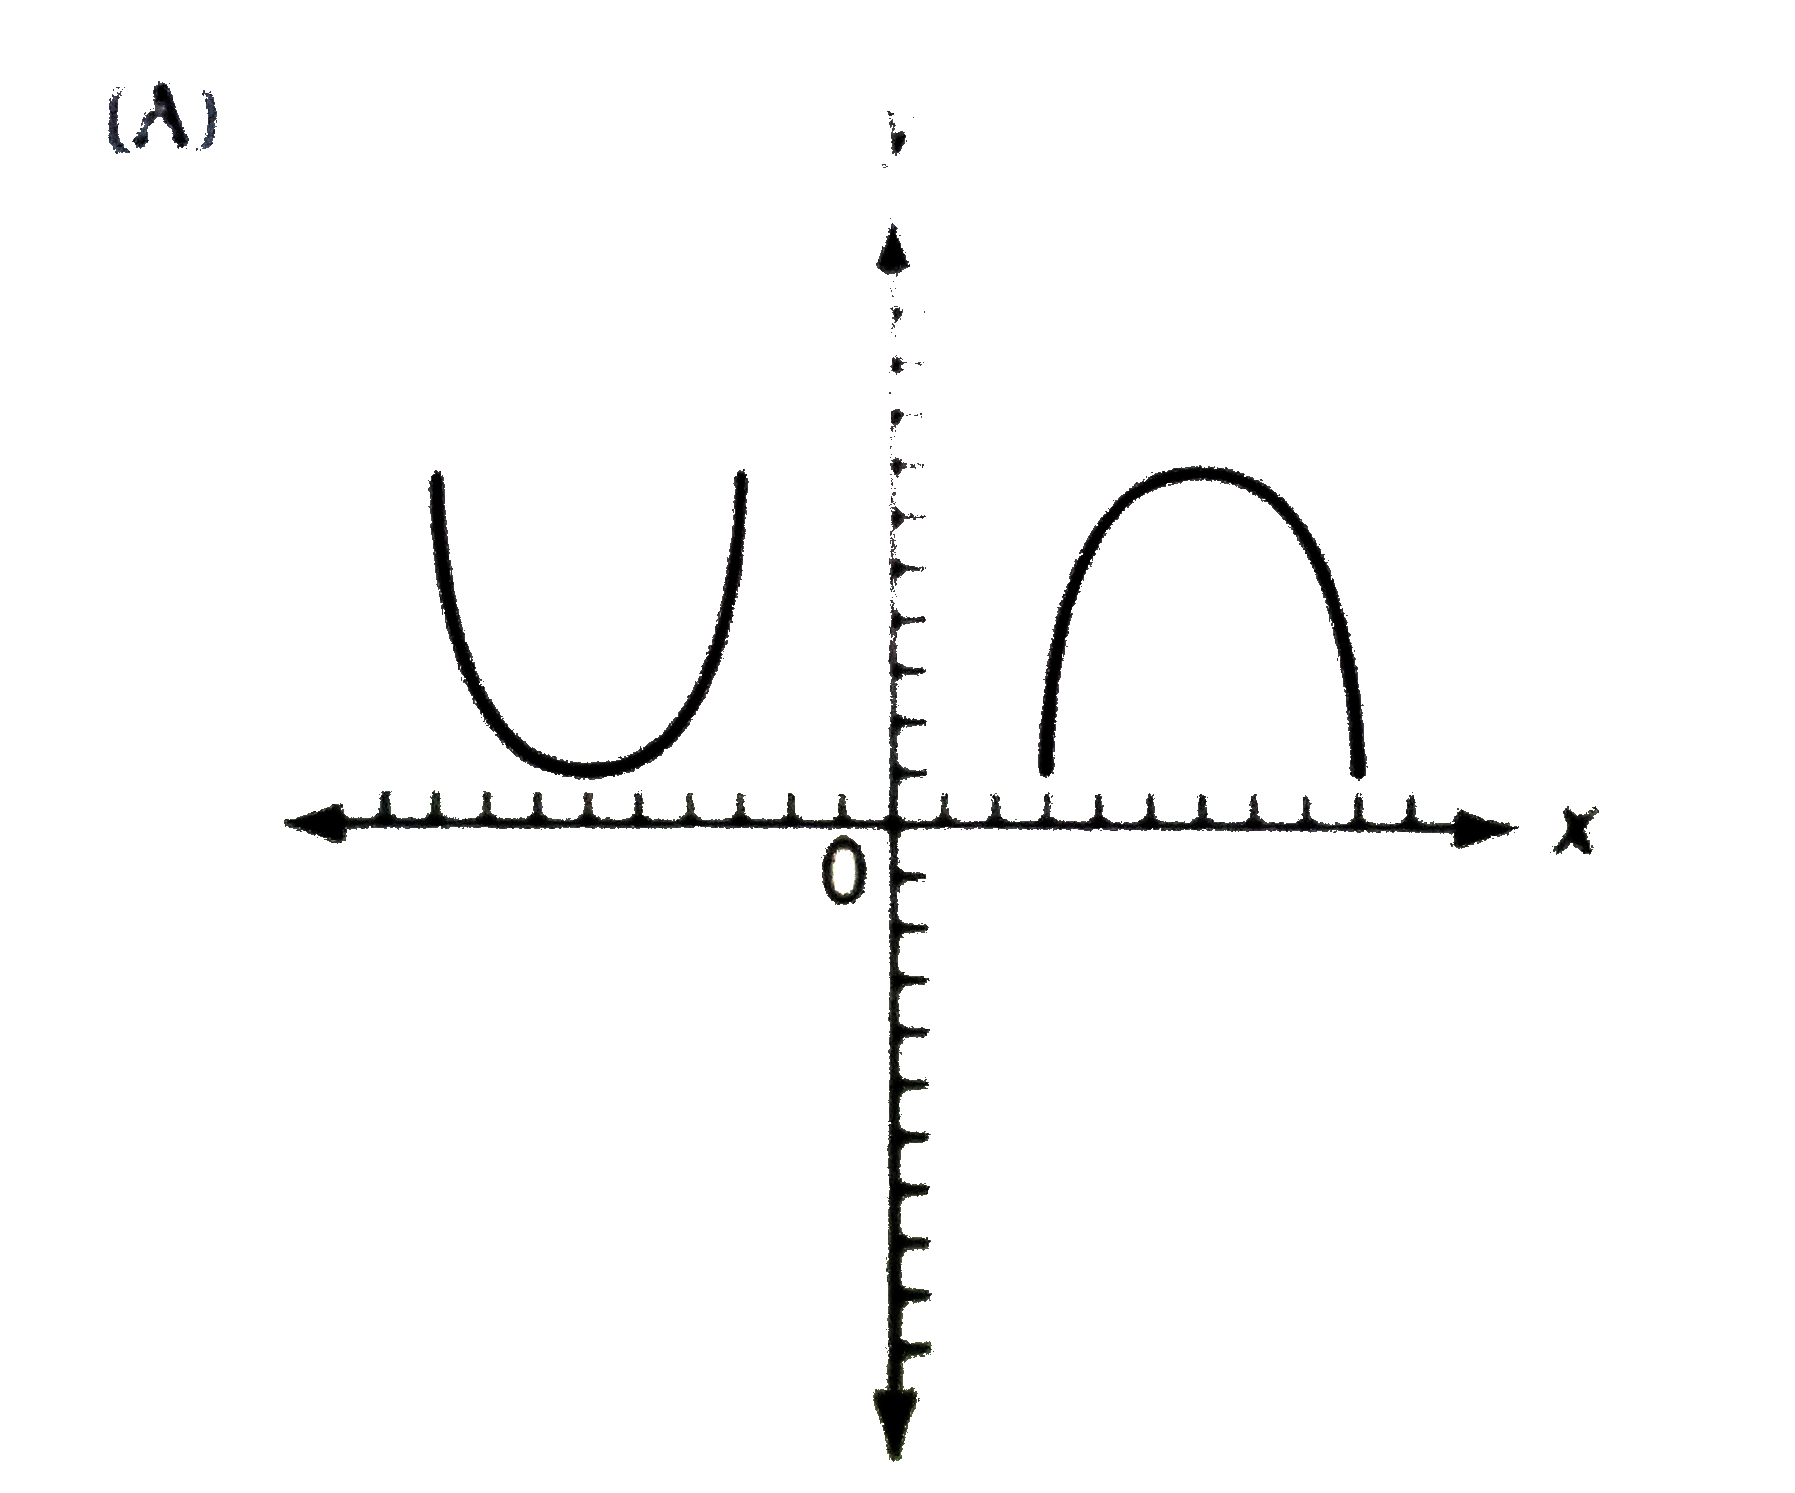 B
B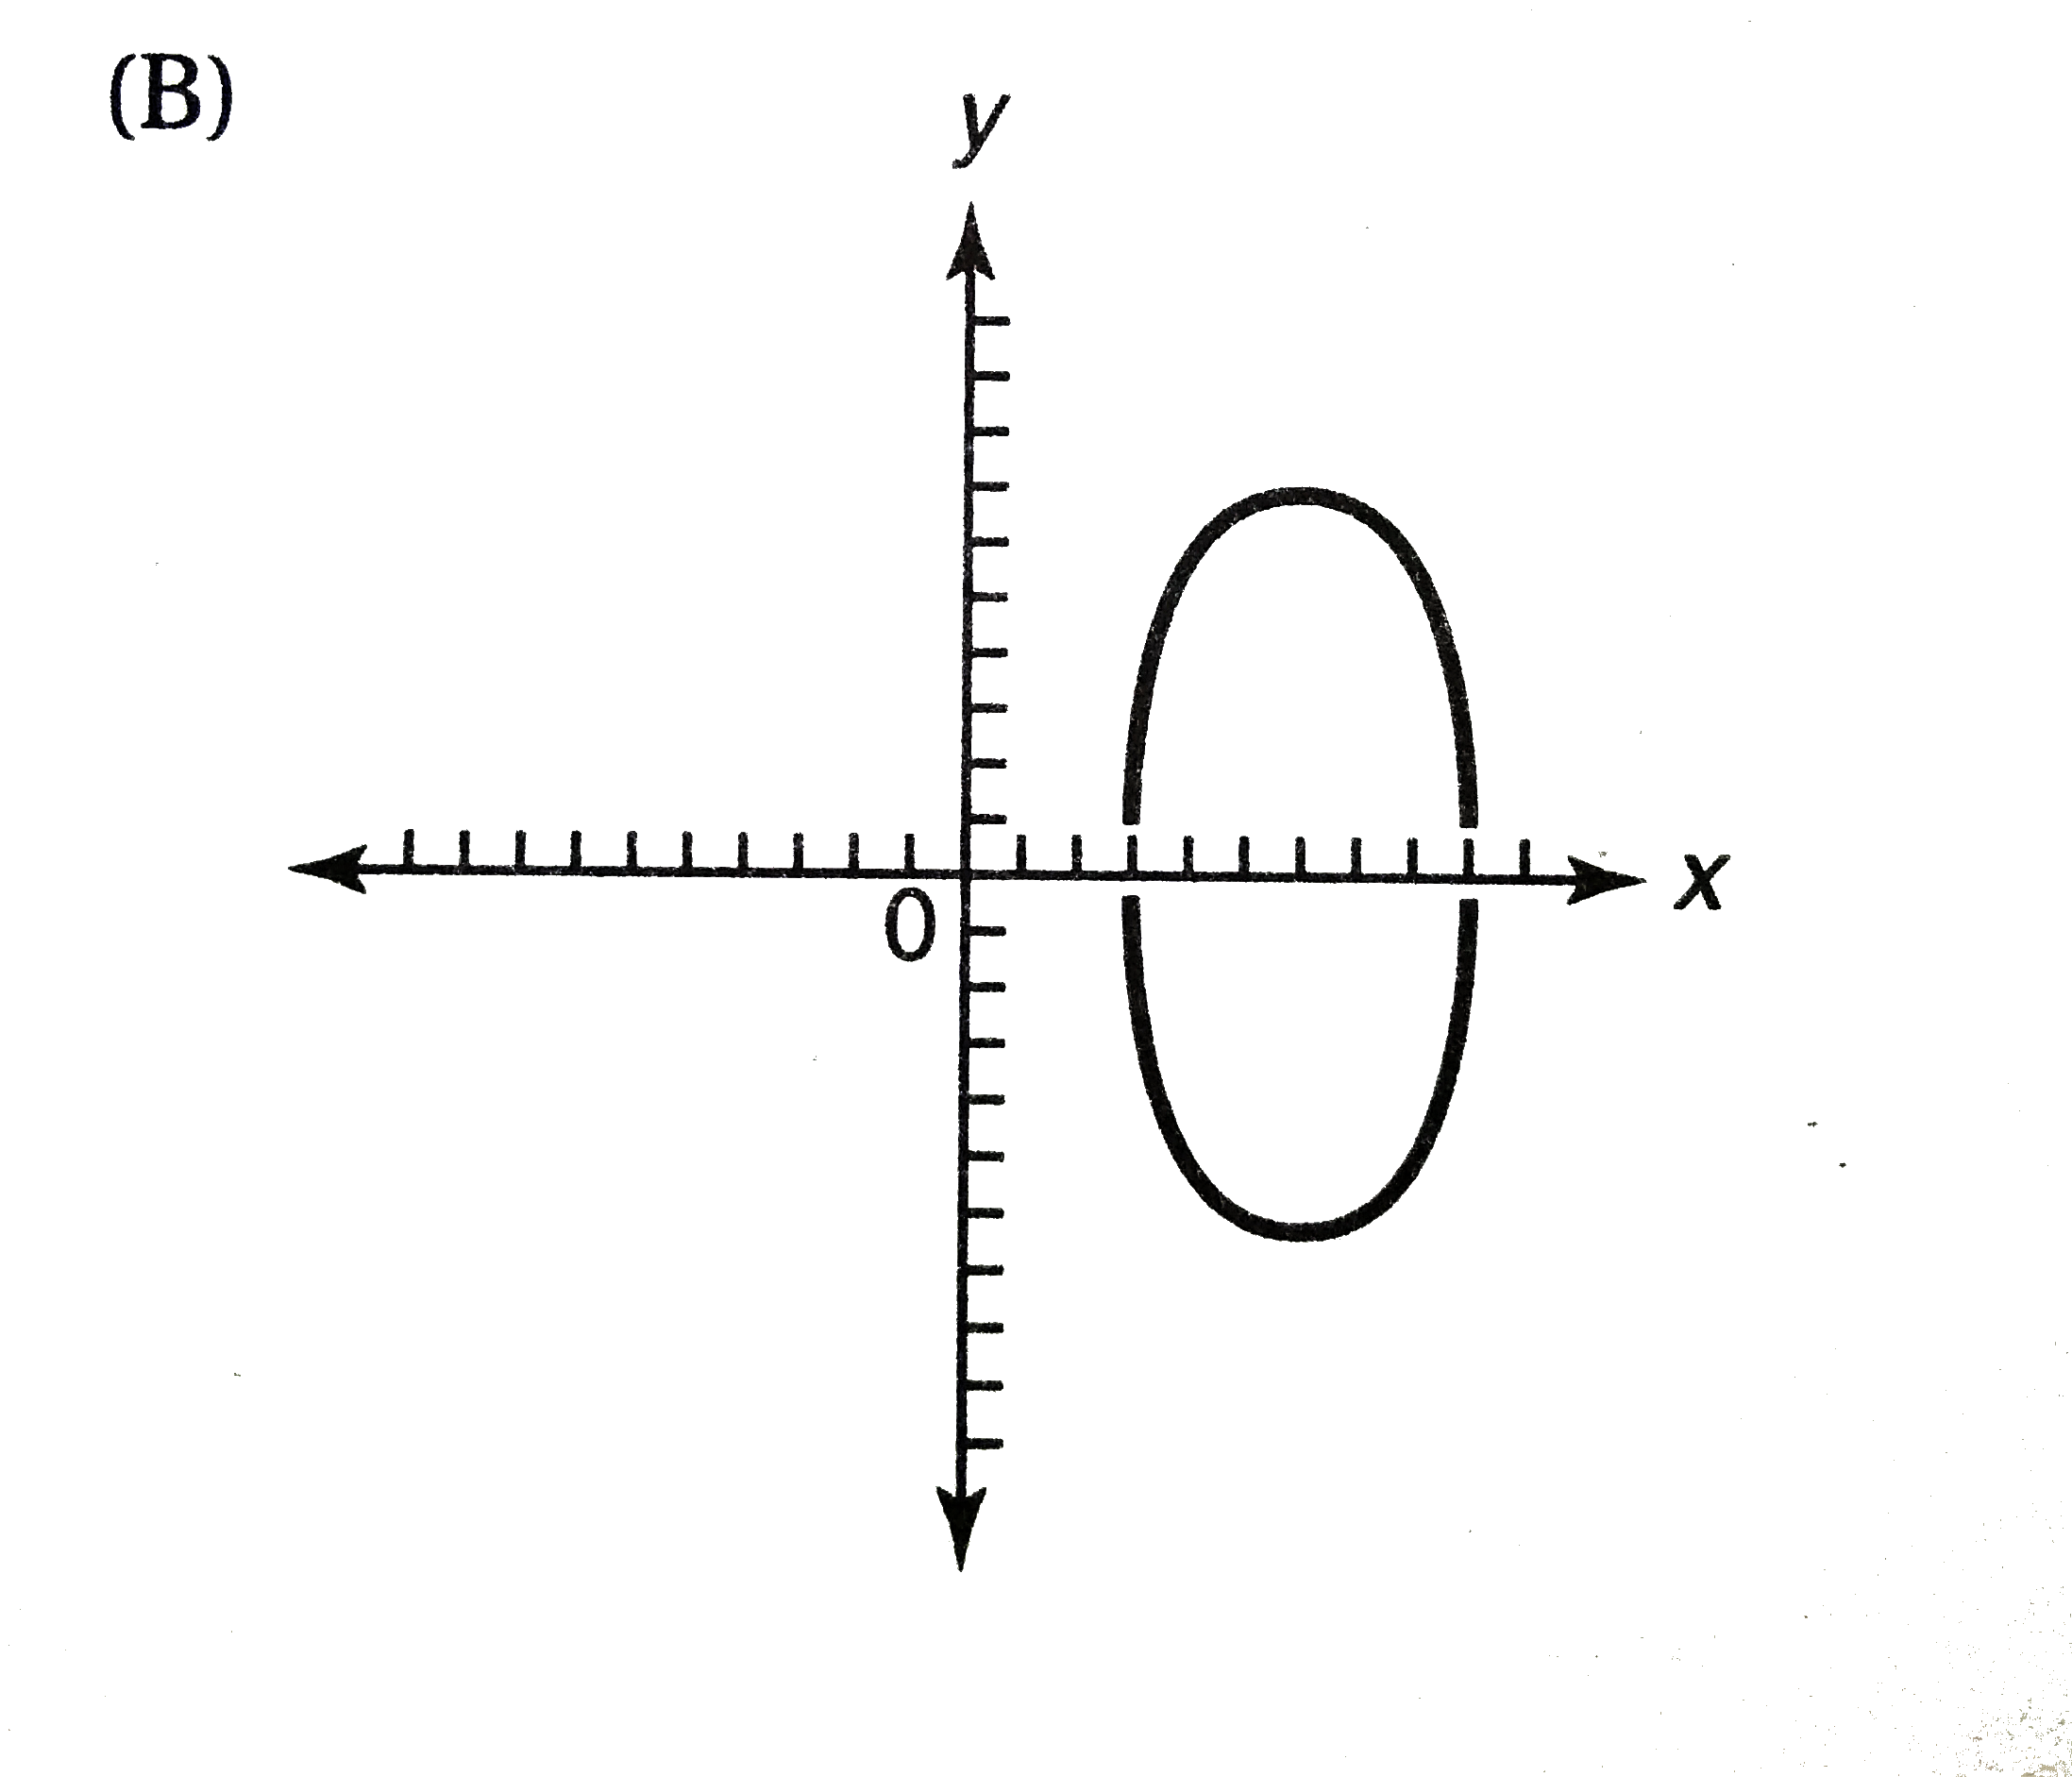 C
C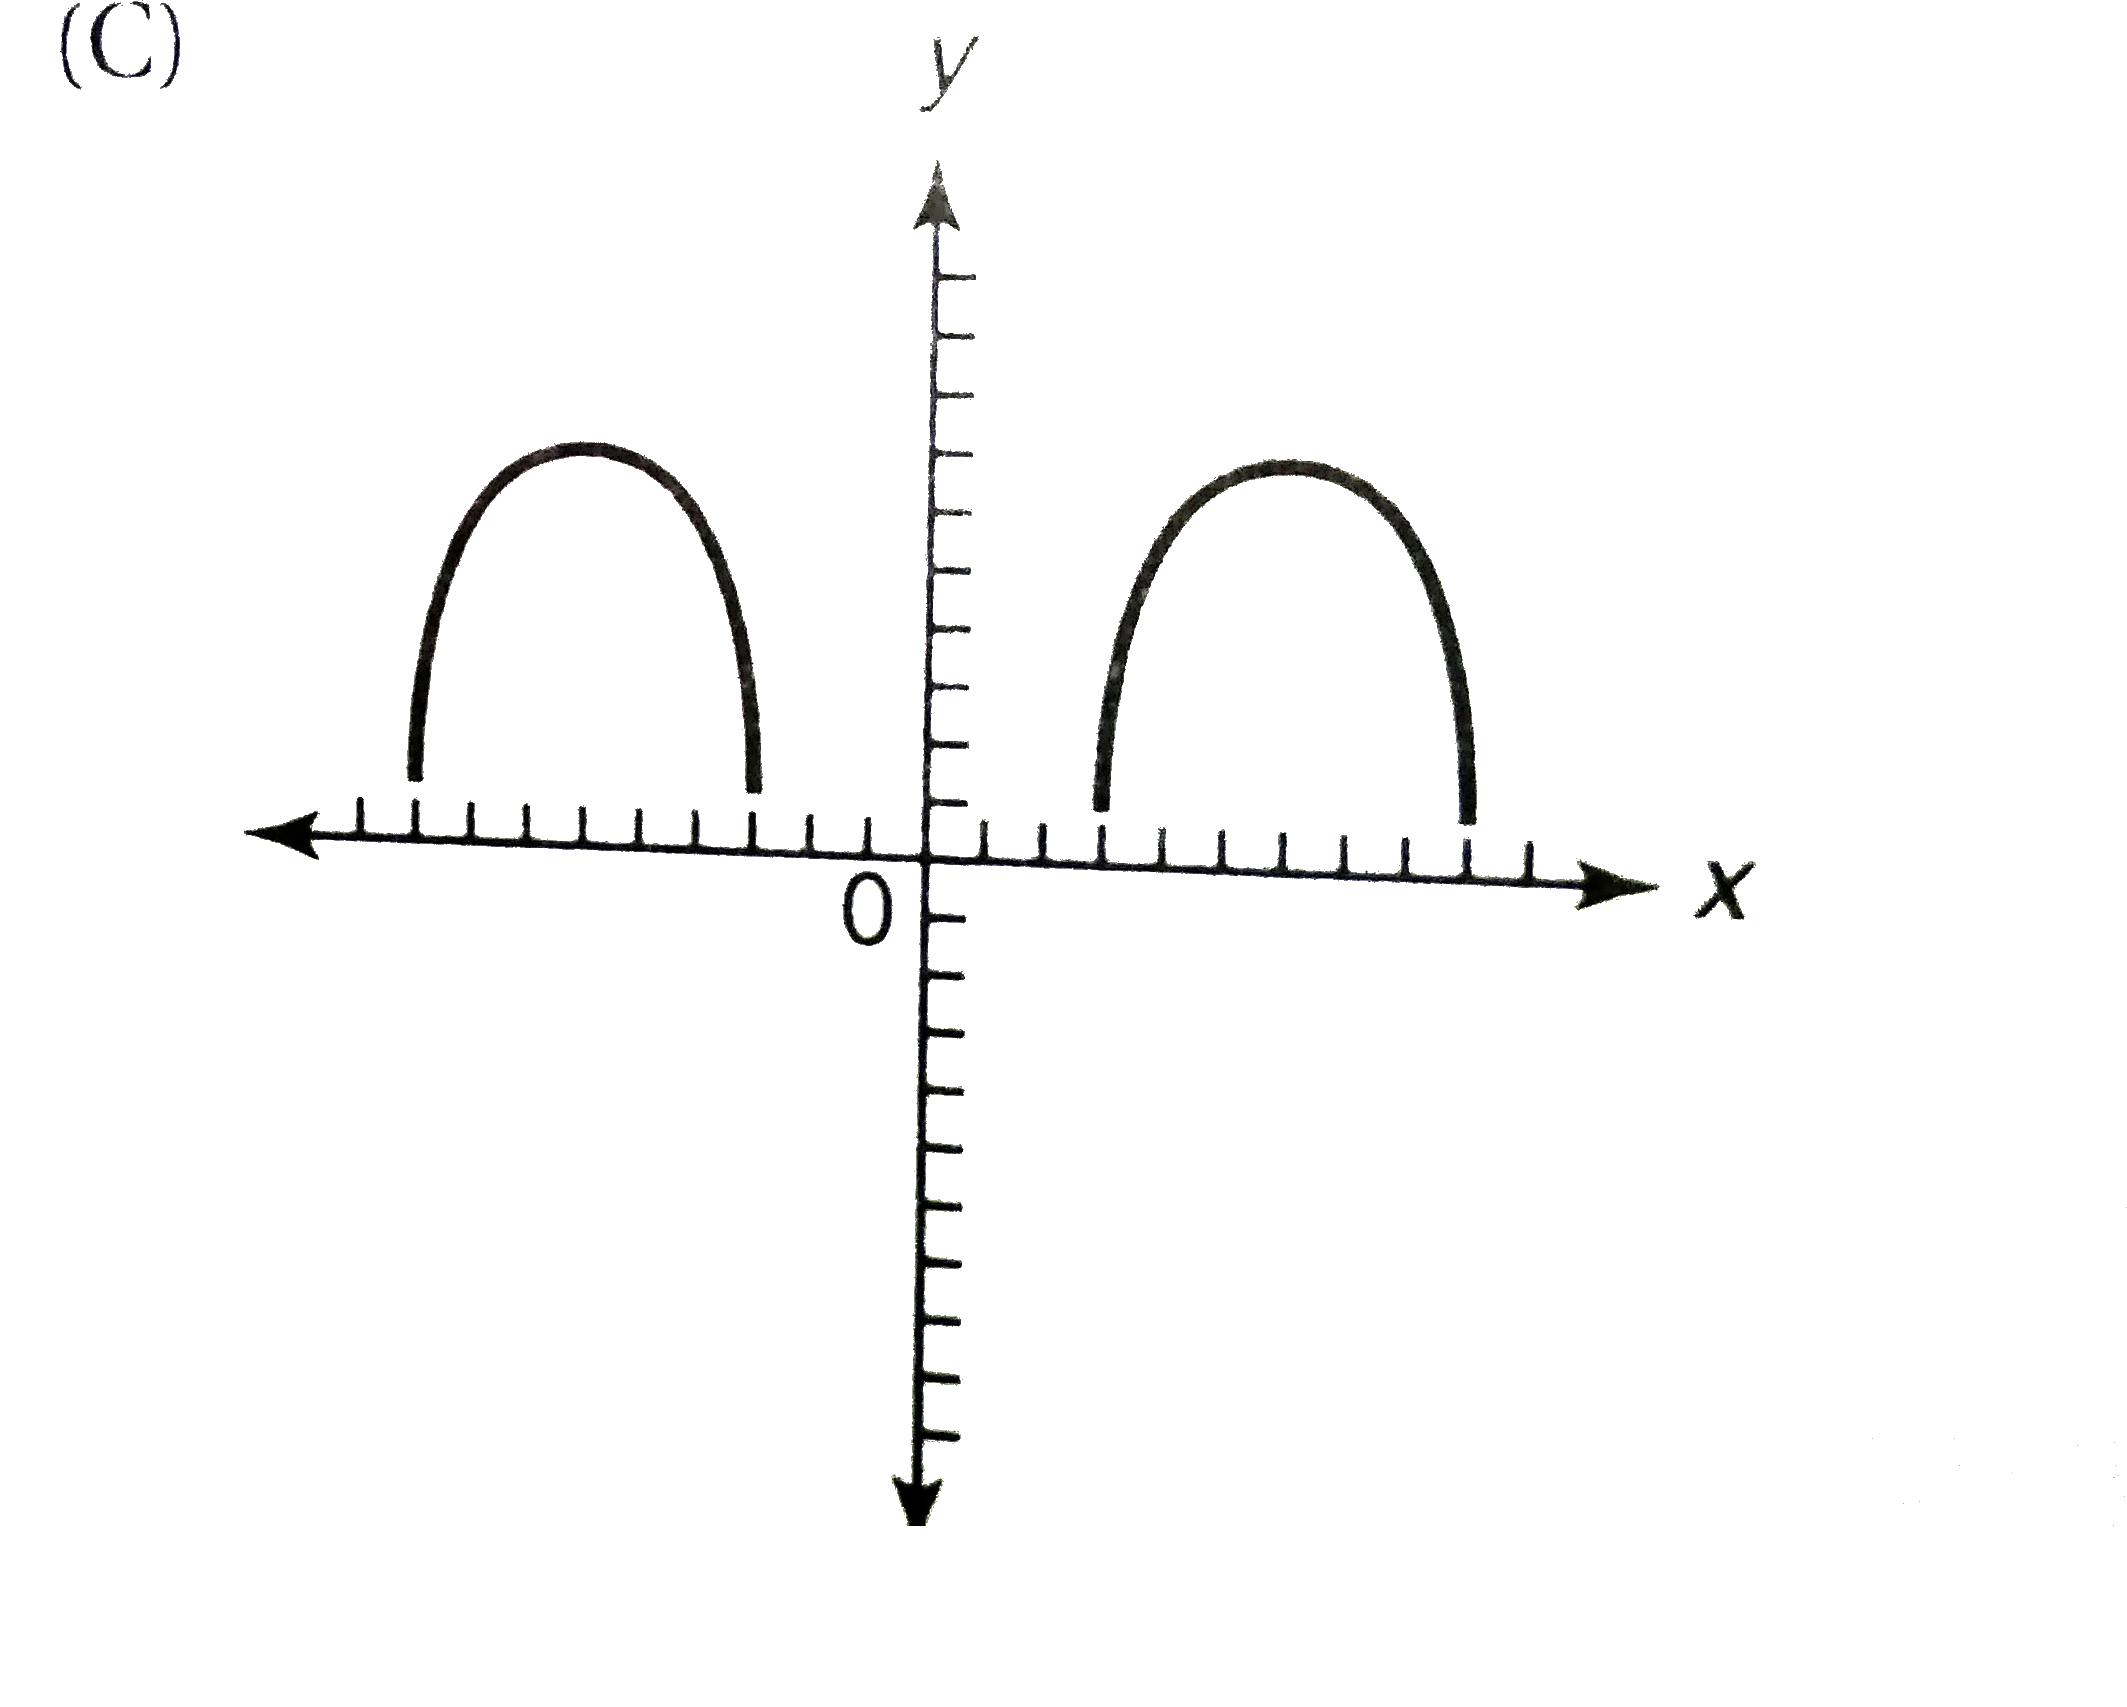 D
D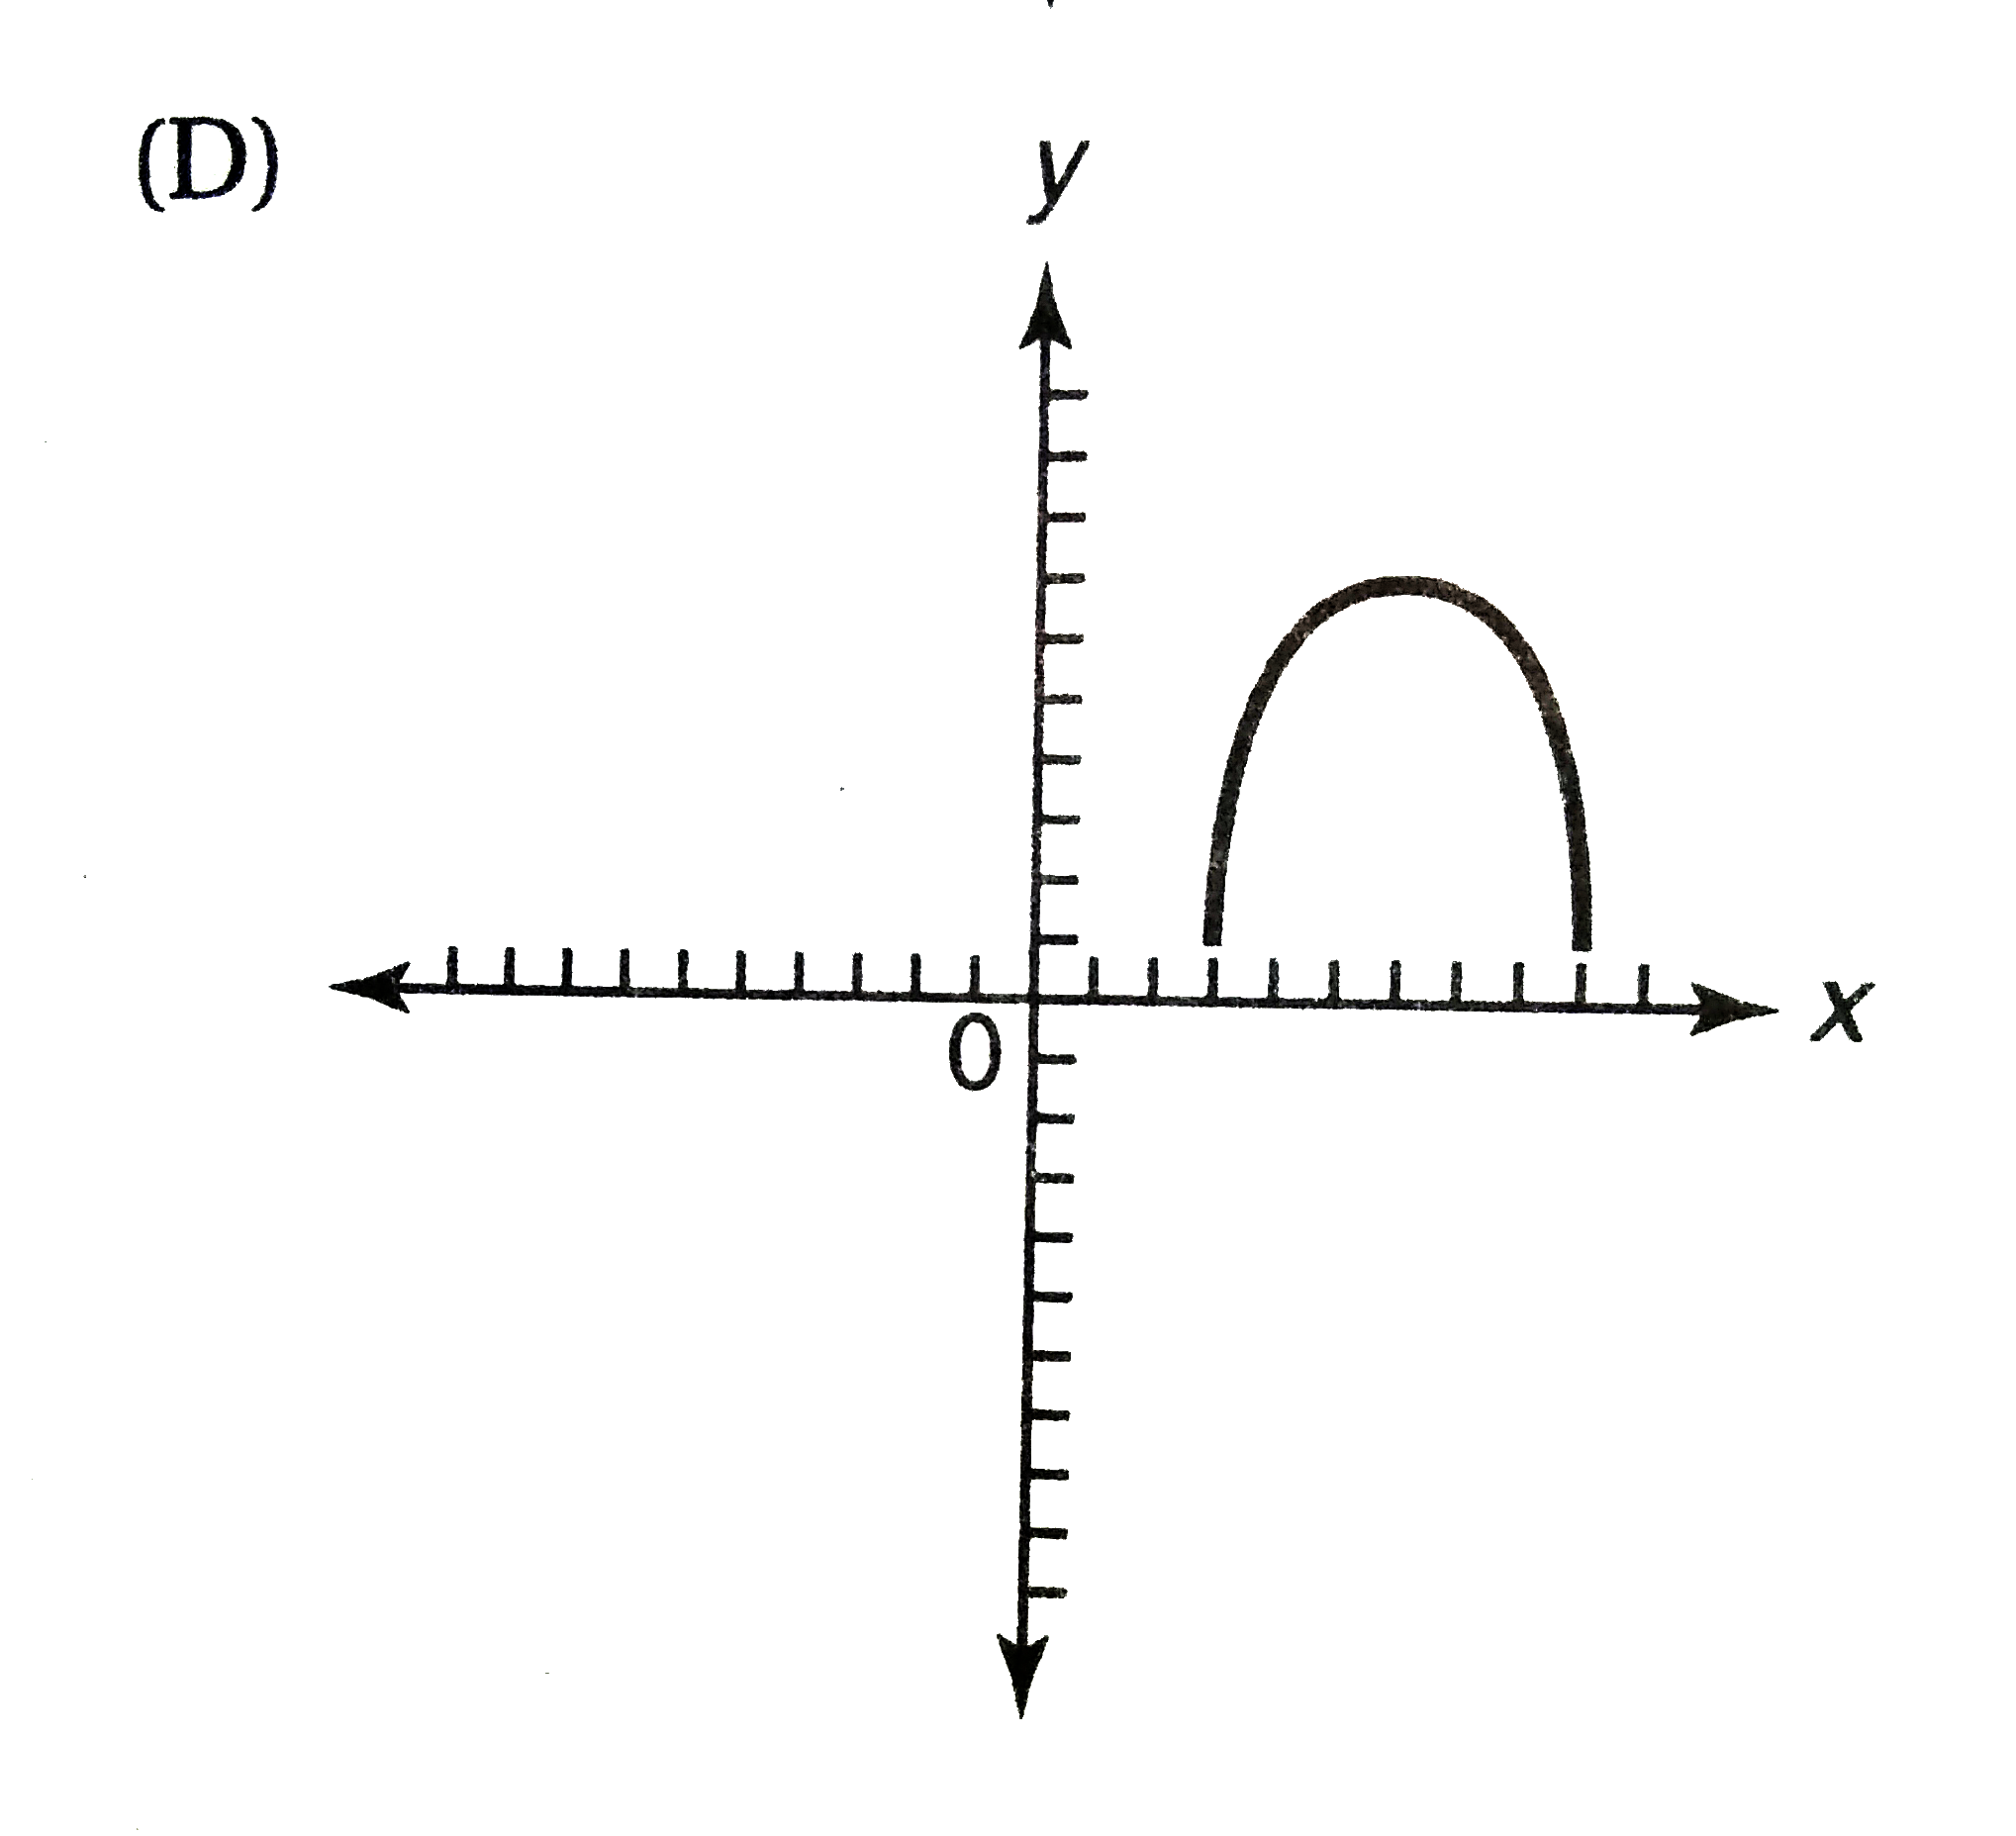
f (x) = (x + 3)(x − k)
T he function f is defined above. If k is a positive integer, which of the following could represent the graph of y = f (x) in the xy-plane?A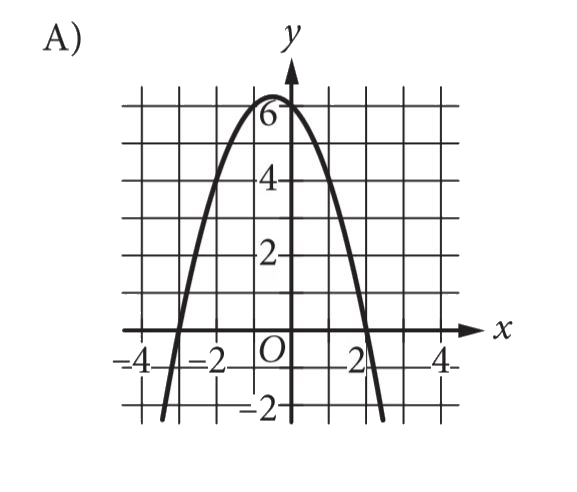 B
B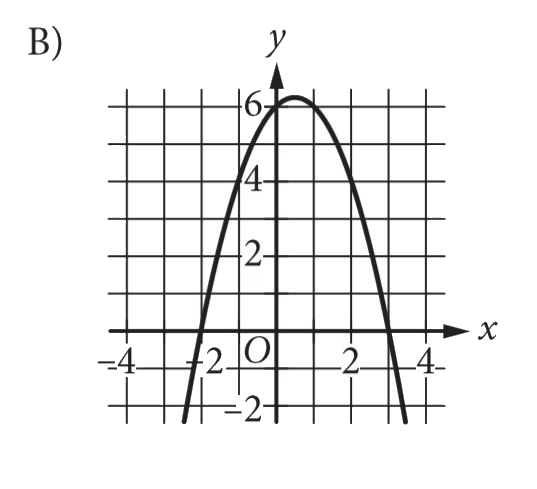 C
C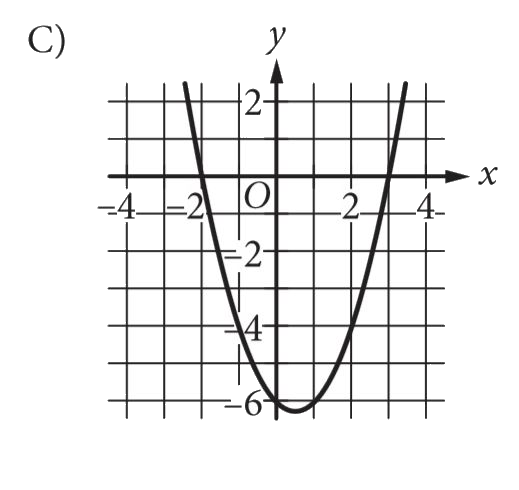 D
D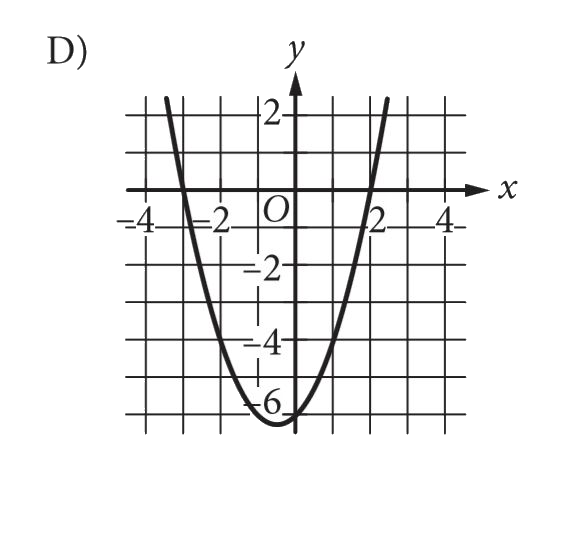
f(x)=3x3+kx2−32x+28
The function f is defined by the equation above where k is a nonzero constant. In the xy-plane the graph of f intersects the x-axis at three points: (−2,0),(32,0),and(c,0). What is the value of k?A−25B−17C7D14
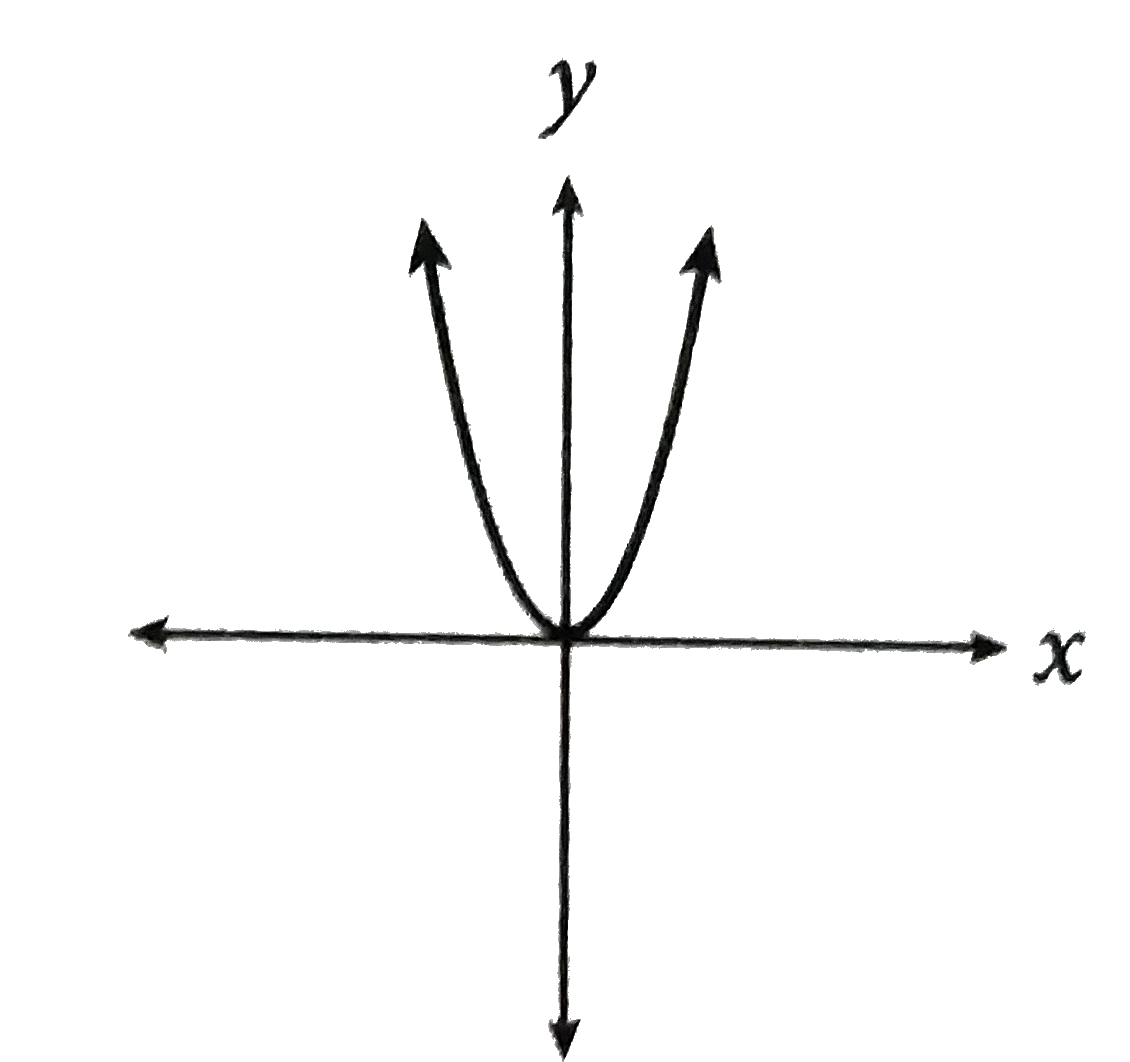
If the above graph shows f(x)=7x2, which of the following is the graph of f(x)=7x2+11?
View SolutionGiven a function, f(x), such that f(x) = f(|x|). Which one of the following could be the graph of f(x) ?
View SolutionThe range of the polynomial function f is the set of real numbers less than or equal to 4. If the zeros of f are −3 and 1, which of the following could be the graph of y = f (x) in the xy-plane?
View Solutionf(x)=ax2+bx+c,a>0
The coordinates of the lowest point on the graph of the function defined by the equation above is (3,2). If f(−1)=p, then which of the following represents the value of p?
View SolutionThe graph of y=f(x) is shown below.
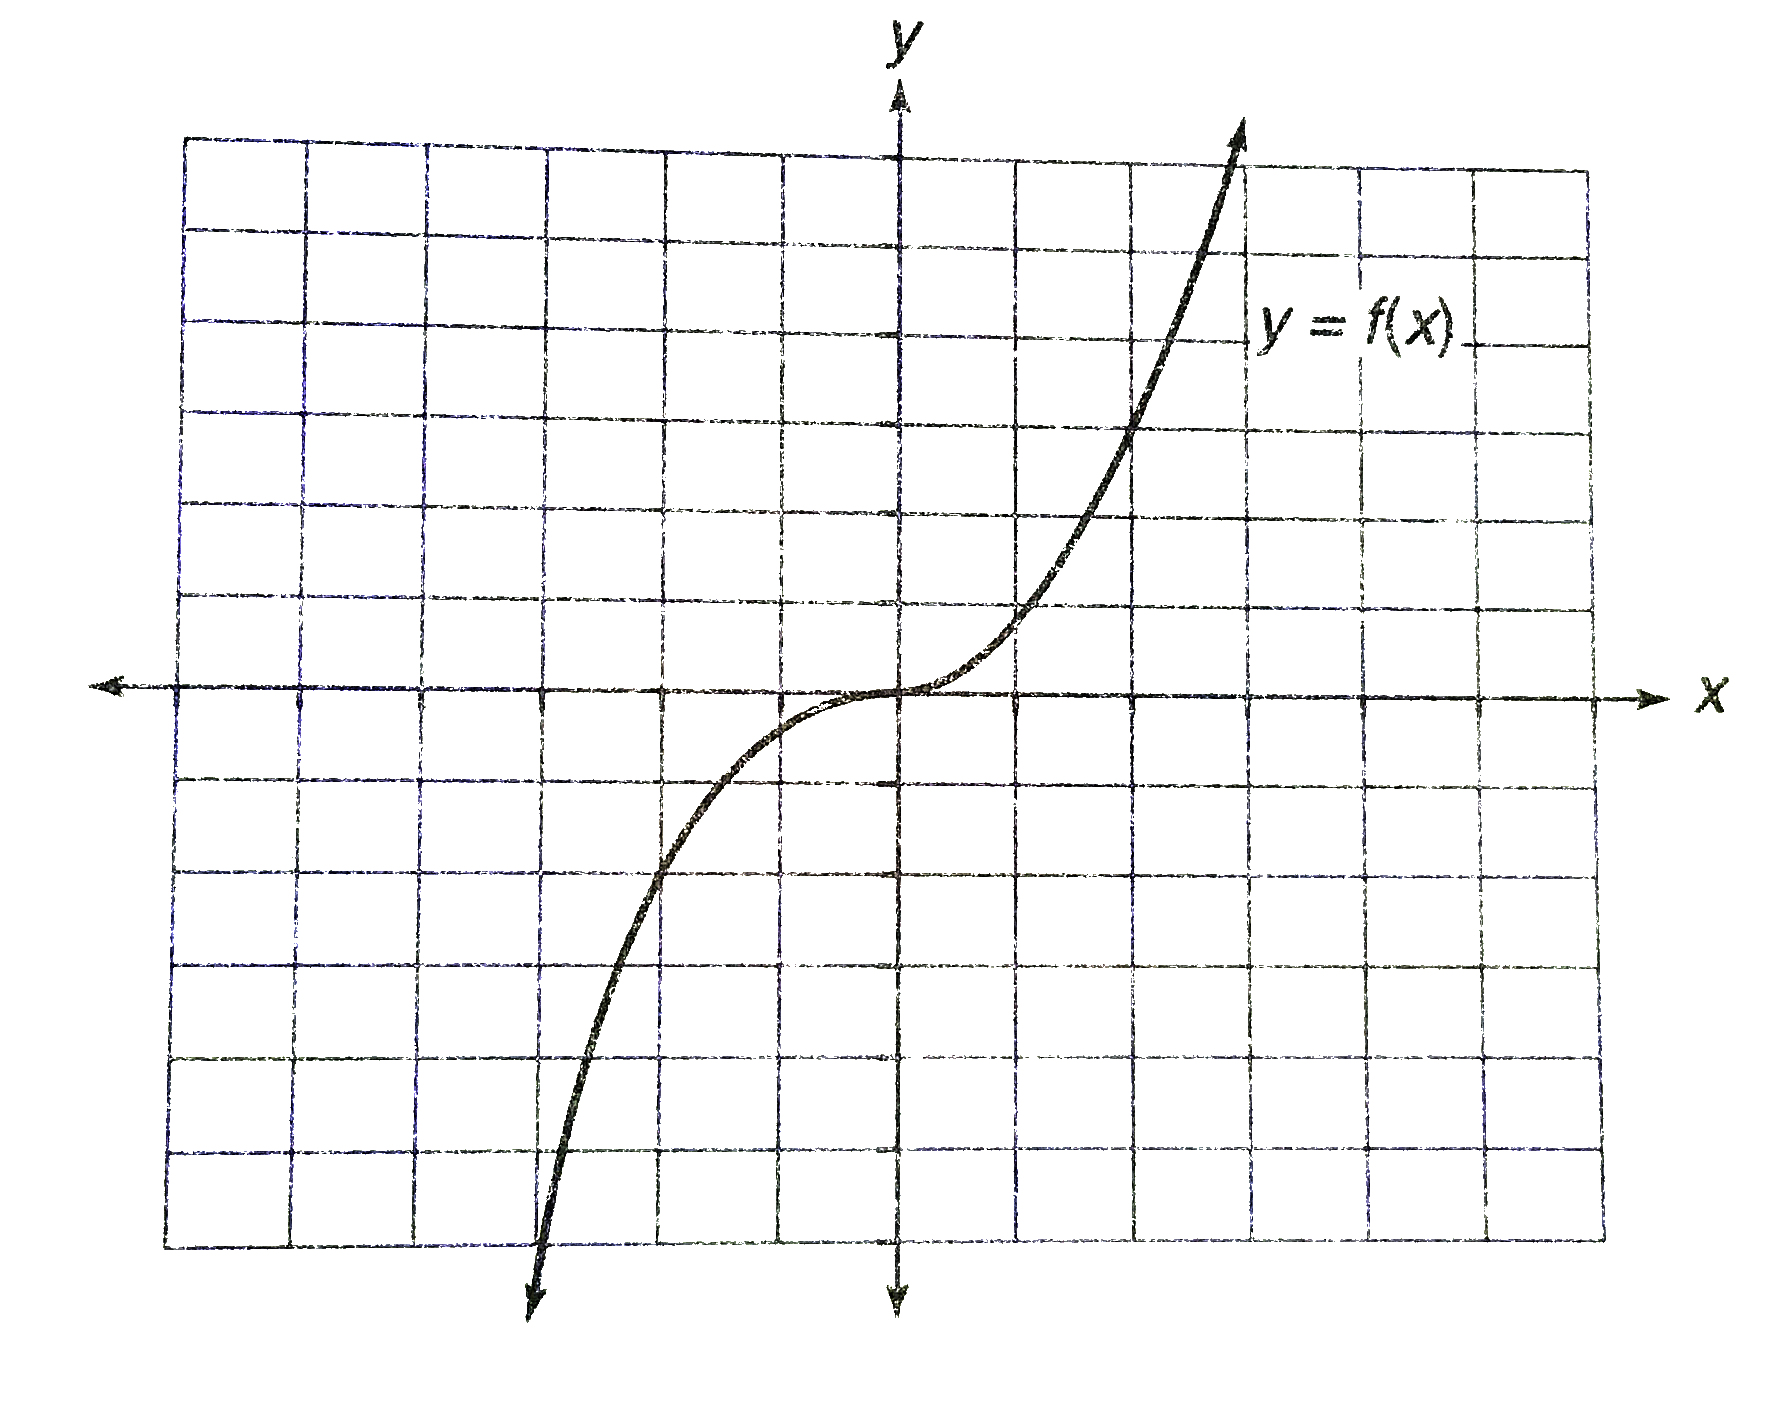
Which of the following could represents the graph of y=f(x−2)+1?
View Solution

