Identify the correct graph represeriting the motion of a particle along a straight line With constant acceleration with zero initial velocity.


The correct Answer is:A, D
To solve the problem of identifying the correct graphs representing the motion of a particle along a straight line with constant acceleration and zero initial velocity, we can follow these steps:
Step 1: Understand the Given Conditions
We are given that the initial velocity (u) is zero and the acceleration (a) is a constant value.
Step 2: Analyze the Velocity-Time Relationship
Using the equation of motion for velocity:
v=u+at
Since u=0, the equation simplifies to:
v=at
This indicates that the velocity (v) increases linearly with time (t). Therefore, the velocity-time graph will be a straight line starting from the origin (0,0).
Step 3: Identify the Correct Velocity-Time Graph
From the options provided, we need to identify the graph that represents a straight line passing through the origin. This corresponds to option 1 or option 2.
Step 4: Analyze the Displacement-Time Relationship
Next, we use the equation for displacement:
s=ut+12at2
Again, since u=0, the equation simplifies to:
s=12at2
This indicates that the displacement (s) is proportional to the square of time (t²). Therefore, the displacement-time graph will be a parabola that opens upwards and passes through the origin.
Step 5: Identify the Correct Displacement-Time Graph
From the options provided, we need to find the graph that represents a parabola passing through the origin. This corresponds to option D.
Conclusion
- The correct velocity-time graph is option 1 (or 2).
- The correct displacement-time graph is option D.
Final Answer
- Velocity-Time Graph: Option 1 (or 2)
- Displacement-Time Graph: Option D
---
We are given that the initial velocity (u) is zero and the acceleration (a) is a constant value.
Using the equation of motion for velocity:
v=u+at
Since u=0, the equation simplifies to:
v=at
This indicates that the velocity (v) increases linearly with time (t). Therefore, the velocity-time graph will be a straight line starting from the origin (0,0).
From the options provided, we need to identify the graph that represents a straight line passing through the origin. This corresponds to option 1 or option 2.
Next, we use the equation for displacement:
s=ut+12at2
Again, since u=0, the equation simplifies to:
s=12at2
This indicates that the displacement (s) is proportional to the square of time (t²). Therefore, the displacement-time graph will be a parabola that opens upwards and passes through the origin.
From the options provided, we need to find the graph that represents a parabola passing through the origin. This corresponds to option D.
- The correct velocity-time graph is option 1 (or 2).
- The correct displacement-time graph is option D.
- Velocity-Time Graph: Option 1 (or 2)
- Displacement-Time Graph: Option D
Topper's Solved these Questions
- KINEMATICSBOOK - DC PANDEY ENGLISHCHAPTER - KINEMATICSEXERCISE - Comprehension
7 Videos
- KINEMATICSBOOK - DC PANDEY ENGLISHCHAPTER - KINEMATICSEXERCISE - Subjective Questions
24 Videos
- KINEMATICSBOOK - DC PANDEY ENGLISHCHAPTER - KINEMATICSEXERCISE - Subjective
50 Videos
- GRAVITATIONBOOK - DC PANDEY ENGLISHCHAPTER - GRAVITATIONEXERCISE - (C) Chapter Exercises
45 Videos
- KINEMATICS 1BOOK - DC PANDEY ENGLISHCHAPTER - KINEMATICS 1EXERCISE - INTEGER_TYPE
15 Videos
Similar Questions
Average velocity of a particle moving in a straight line, with constant acceleration a and initial velocity u in first t seconds is.
View SolutionAverage velocity of a particle moving in a straight line, with constant acceleration a and initial velocity u in first t seconds is.
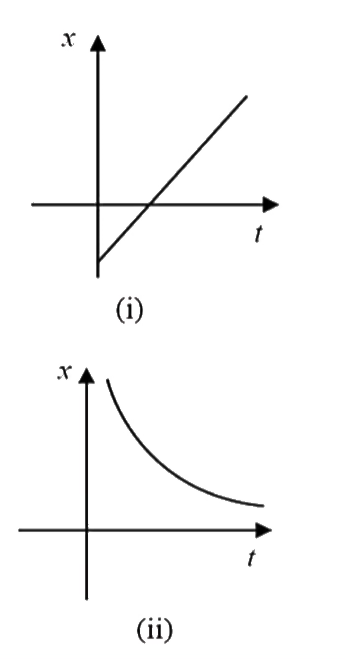
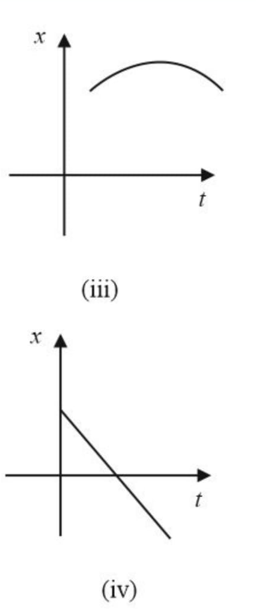
View SolutionWhich of the following graphs represents the motion of a particle moving with constant velocity?
View SolutionStatement-I : A particle moves in a straight line with constant acceleration. The average velocity of this particle cannot be zero in any time interval.
Statement-II : For a particle moving in straight line with constant acceleration, the average velocity in a time interval is u+v2, where u and v are initial and final velocity of the particle of the given time interval.
View SolutionThe variation of velocity of a particle moving along a straight line is shown in . is
 .
.
View SolutionA particle starting from rest moves along a straight line with constant acceleration for this velocity displacement graph will have the form-
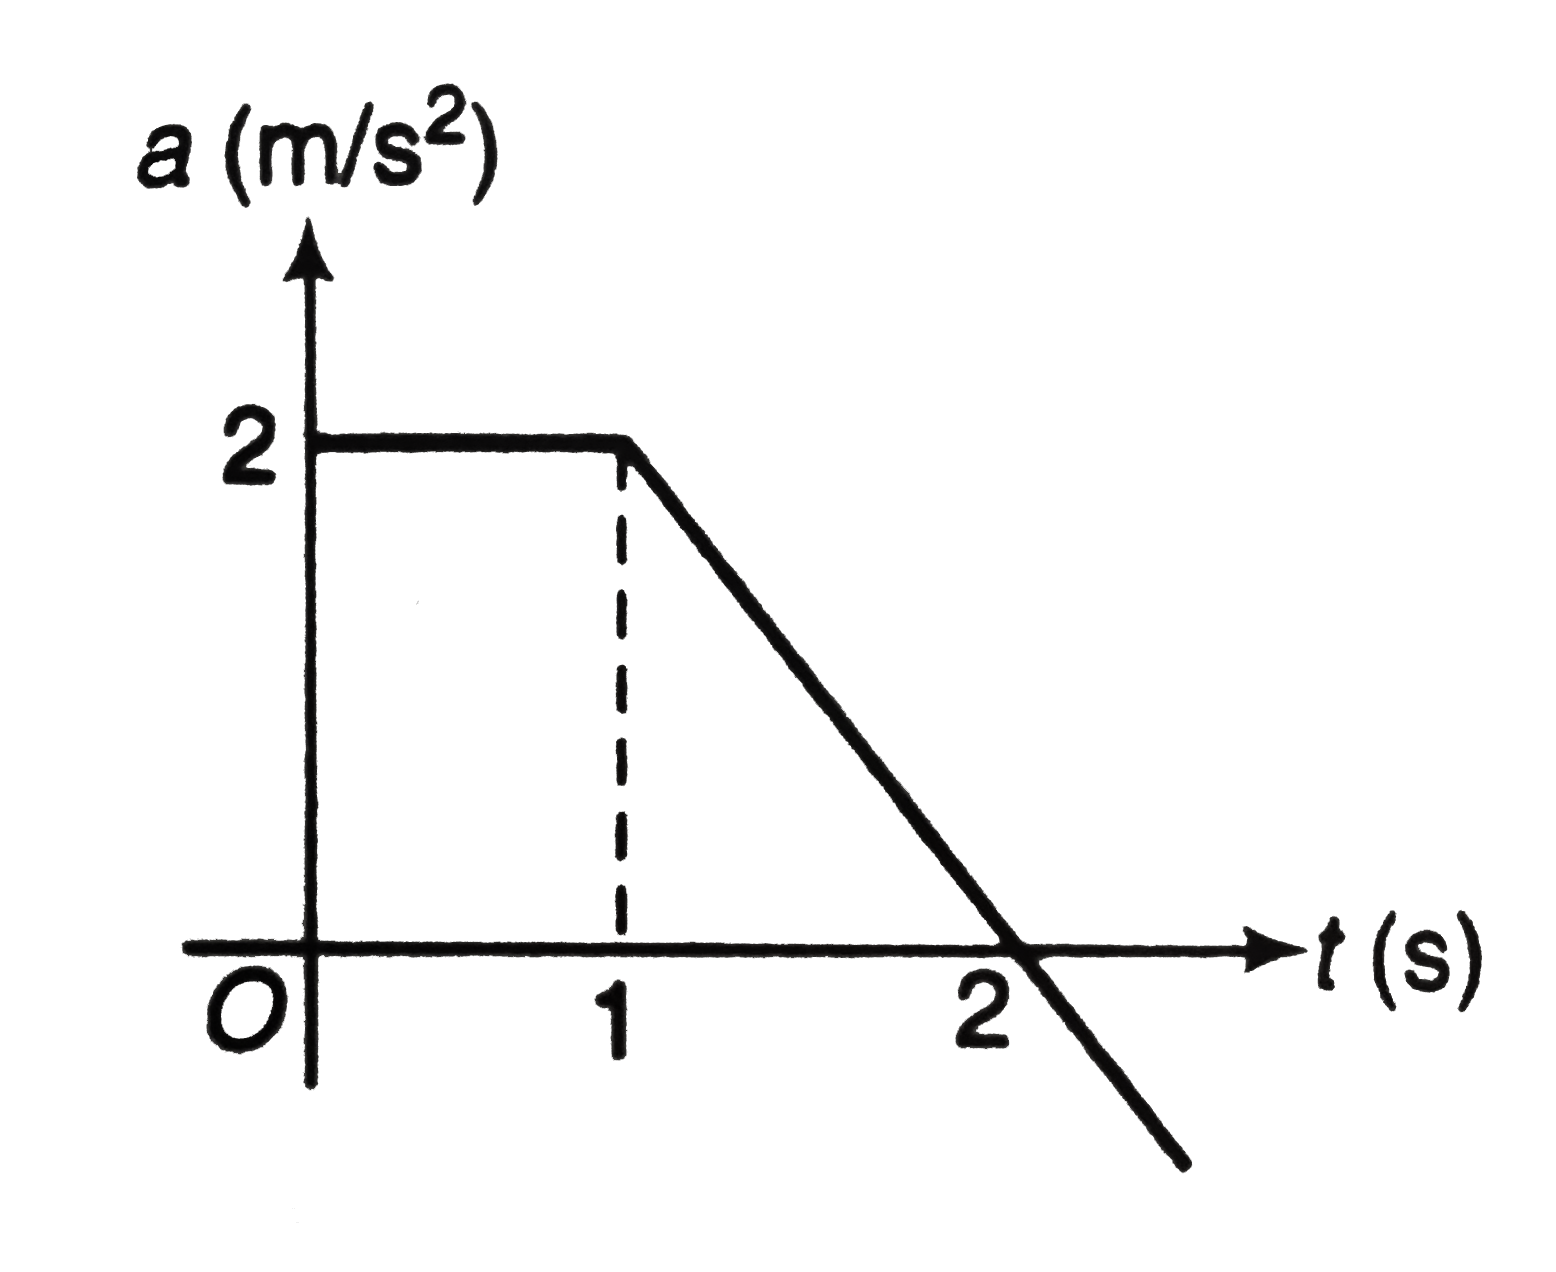
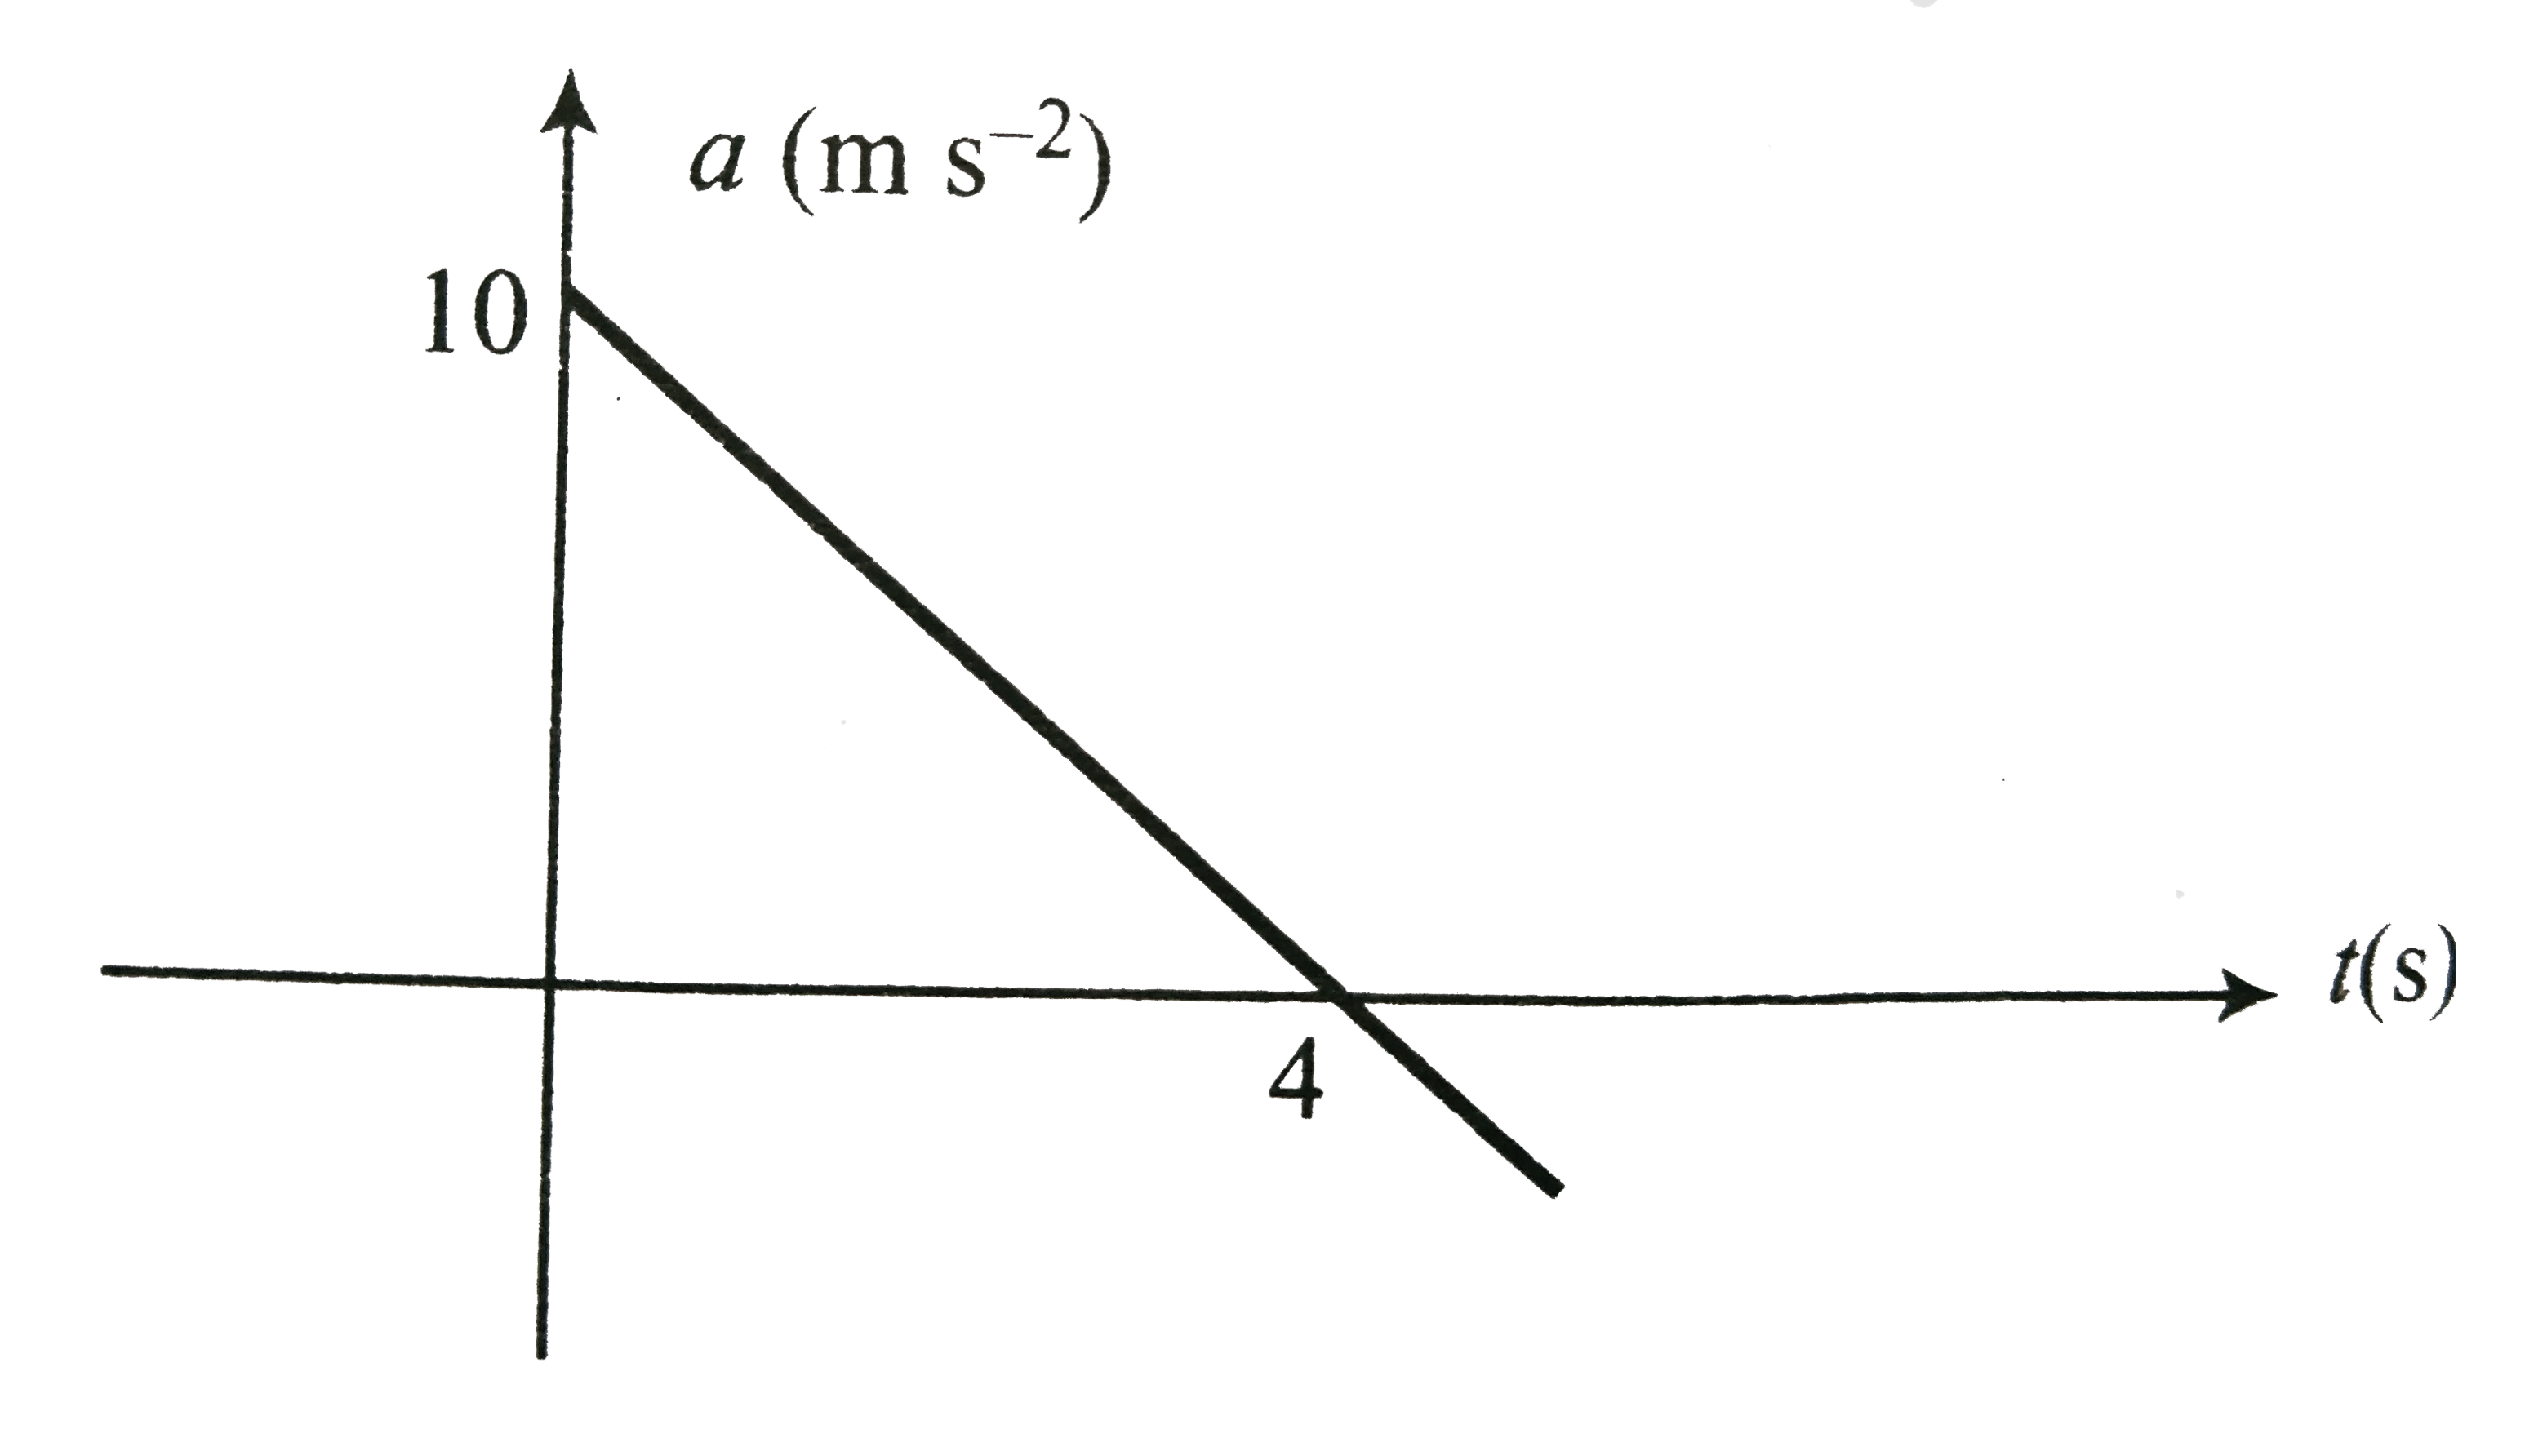
View SolutionFigure shows the acceleration-time graph of a particle moving along a straight line. After what time the particle acquires its initial velocity?
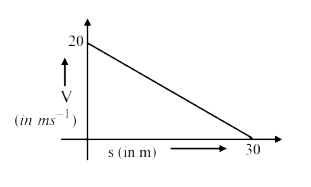
View SolutionThe velocity –position graph of a particle moving along a straight line is shown. Then acceleration of the particle at s = 15 m is :
View SolutionFollowing statements are given for the motion of a particle along the straight line. Choose correct statement out of these :
View SolutionThe acceleration-time graph of a particle moving along a straight line is as shown in. At what time the particle acquires its initial velocity?
 .
.
View Solution
