If a body is realeased from the top of a tower, the graph between distance (x) and time (t) is correctly shown by


The correct Answer is:A
As x=12>2
x∝t2
It is of the form y∝x2, which is the equation of a parabola, as shown in (a).
Topper's Solved these Questions
- MOTIONBOOK - MCGROW HILL PUBLICATIONCHAPTER - MOTIONEXERCISE - HIGHER ORDER THINKING QUESTIONS
48 Videos
- MISCELLANEOUS QUESTIONSBOOK - MCGROW HILL PUBLICATIONCHAPTER - MISCELLANEOUS QUESTIONSEXERCISE - PART-B
99 Videos
- REFLECTION OF LIGHT BOOK - MCGROW HILL PUBLICATIONCHAPTER - REFLECTION OF LIGHT EXERCISE - HIGHER ORDER THINKING QUESTIONS
10 Videos
Similar Questions
Knowledge Check
For body thrown horizontally from the top of a tower,
Athe time of flight depends both on h and vBthe horizontal Range depends only on v but not on hCthe time of flight and horizontal Range depend on h but not on vDThe horizontal Range depends on both v and hThe graph between L and T is correctly shown by
A B
B C
C D
D
A body is released from the top of a tower of height h. It takes t sec to reach the ground. Where will be the ball after time t2 sec?
AAt h2 from the groundBAt h4 from the groundCdepends upon mass and volume of the bodyDat 3h4 from the ground
A body is released from the top of a tower of height h and takes 'T' sec to reach the ground. The position of the body at T/2 sec is
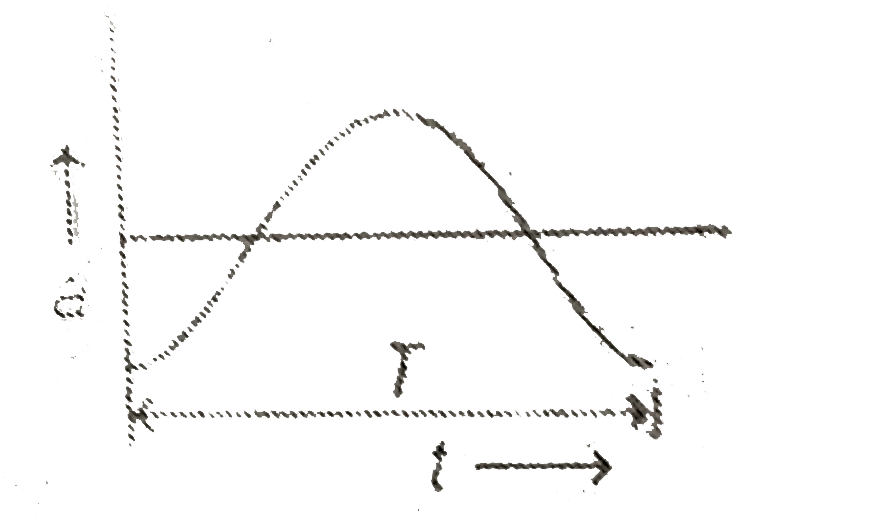
View SolutionAcceleration versus time graph of a body in SHM is given by a curve shown below. T is the time period. Then corresponding graph between kinetic energy KE and time t is correctly represented by

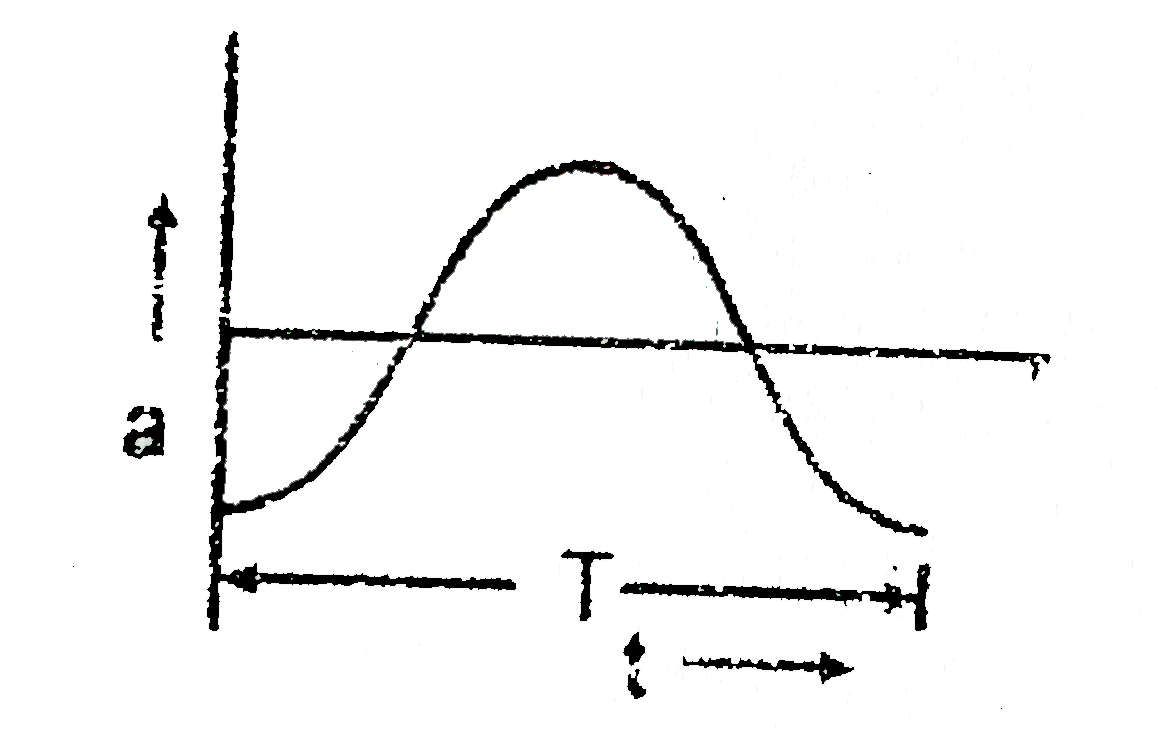
View SolutionAcceleration a versus time t graph of a body in SHM is given by a curve shown below. T is the time period Then corresponding graph between kinetic energy KE and time t is correctly represented by

View SolutionAcceleration versus time graph of a body in SHM is given by a curve shown below. T is the time period. Then corresponding graph between kinetic energy KE and time t is correctly represented by

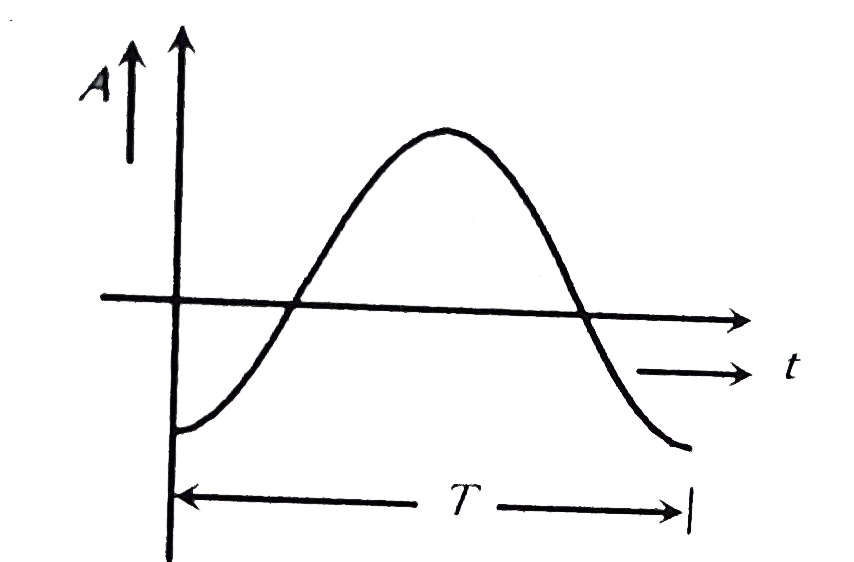
View SolutionAcceleration A and time period T of a body in S.H.M. is given by a curve shown below. Then corresponding graph, between kinetic energy (K.E.) and time t is correctly represented by

View Solution
