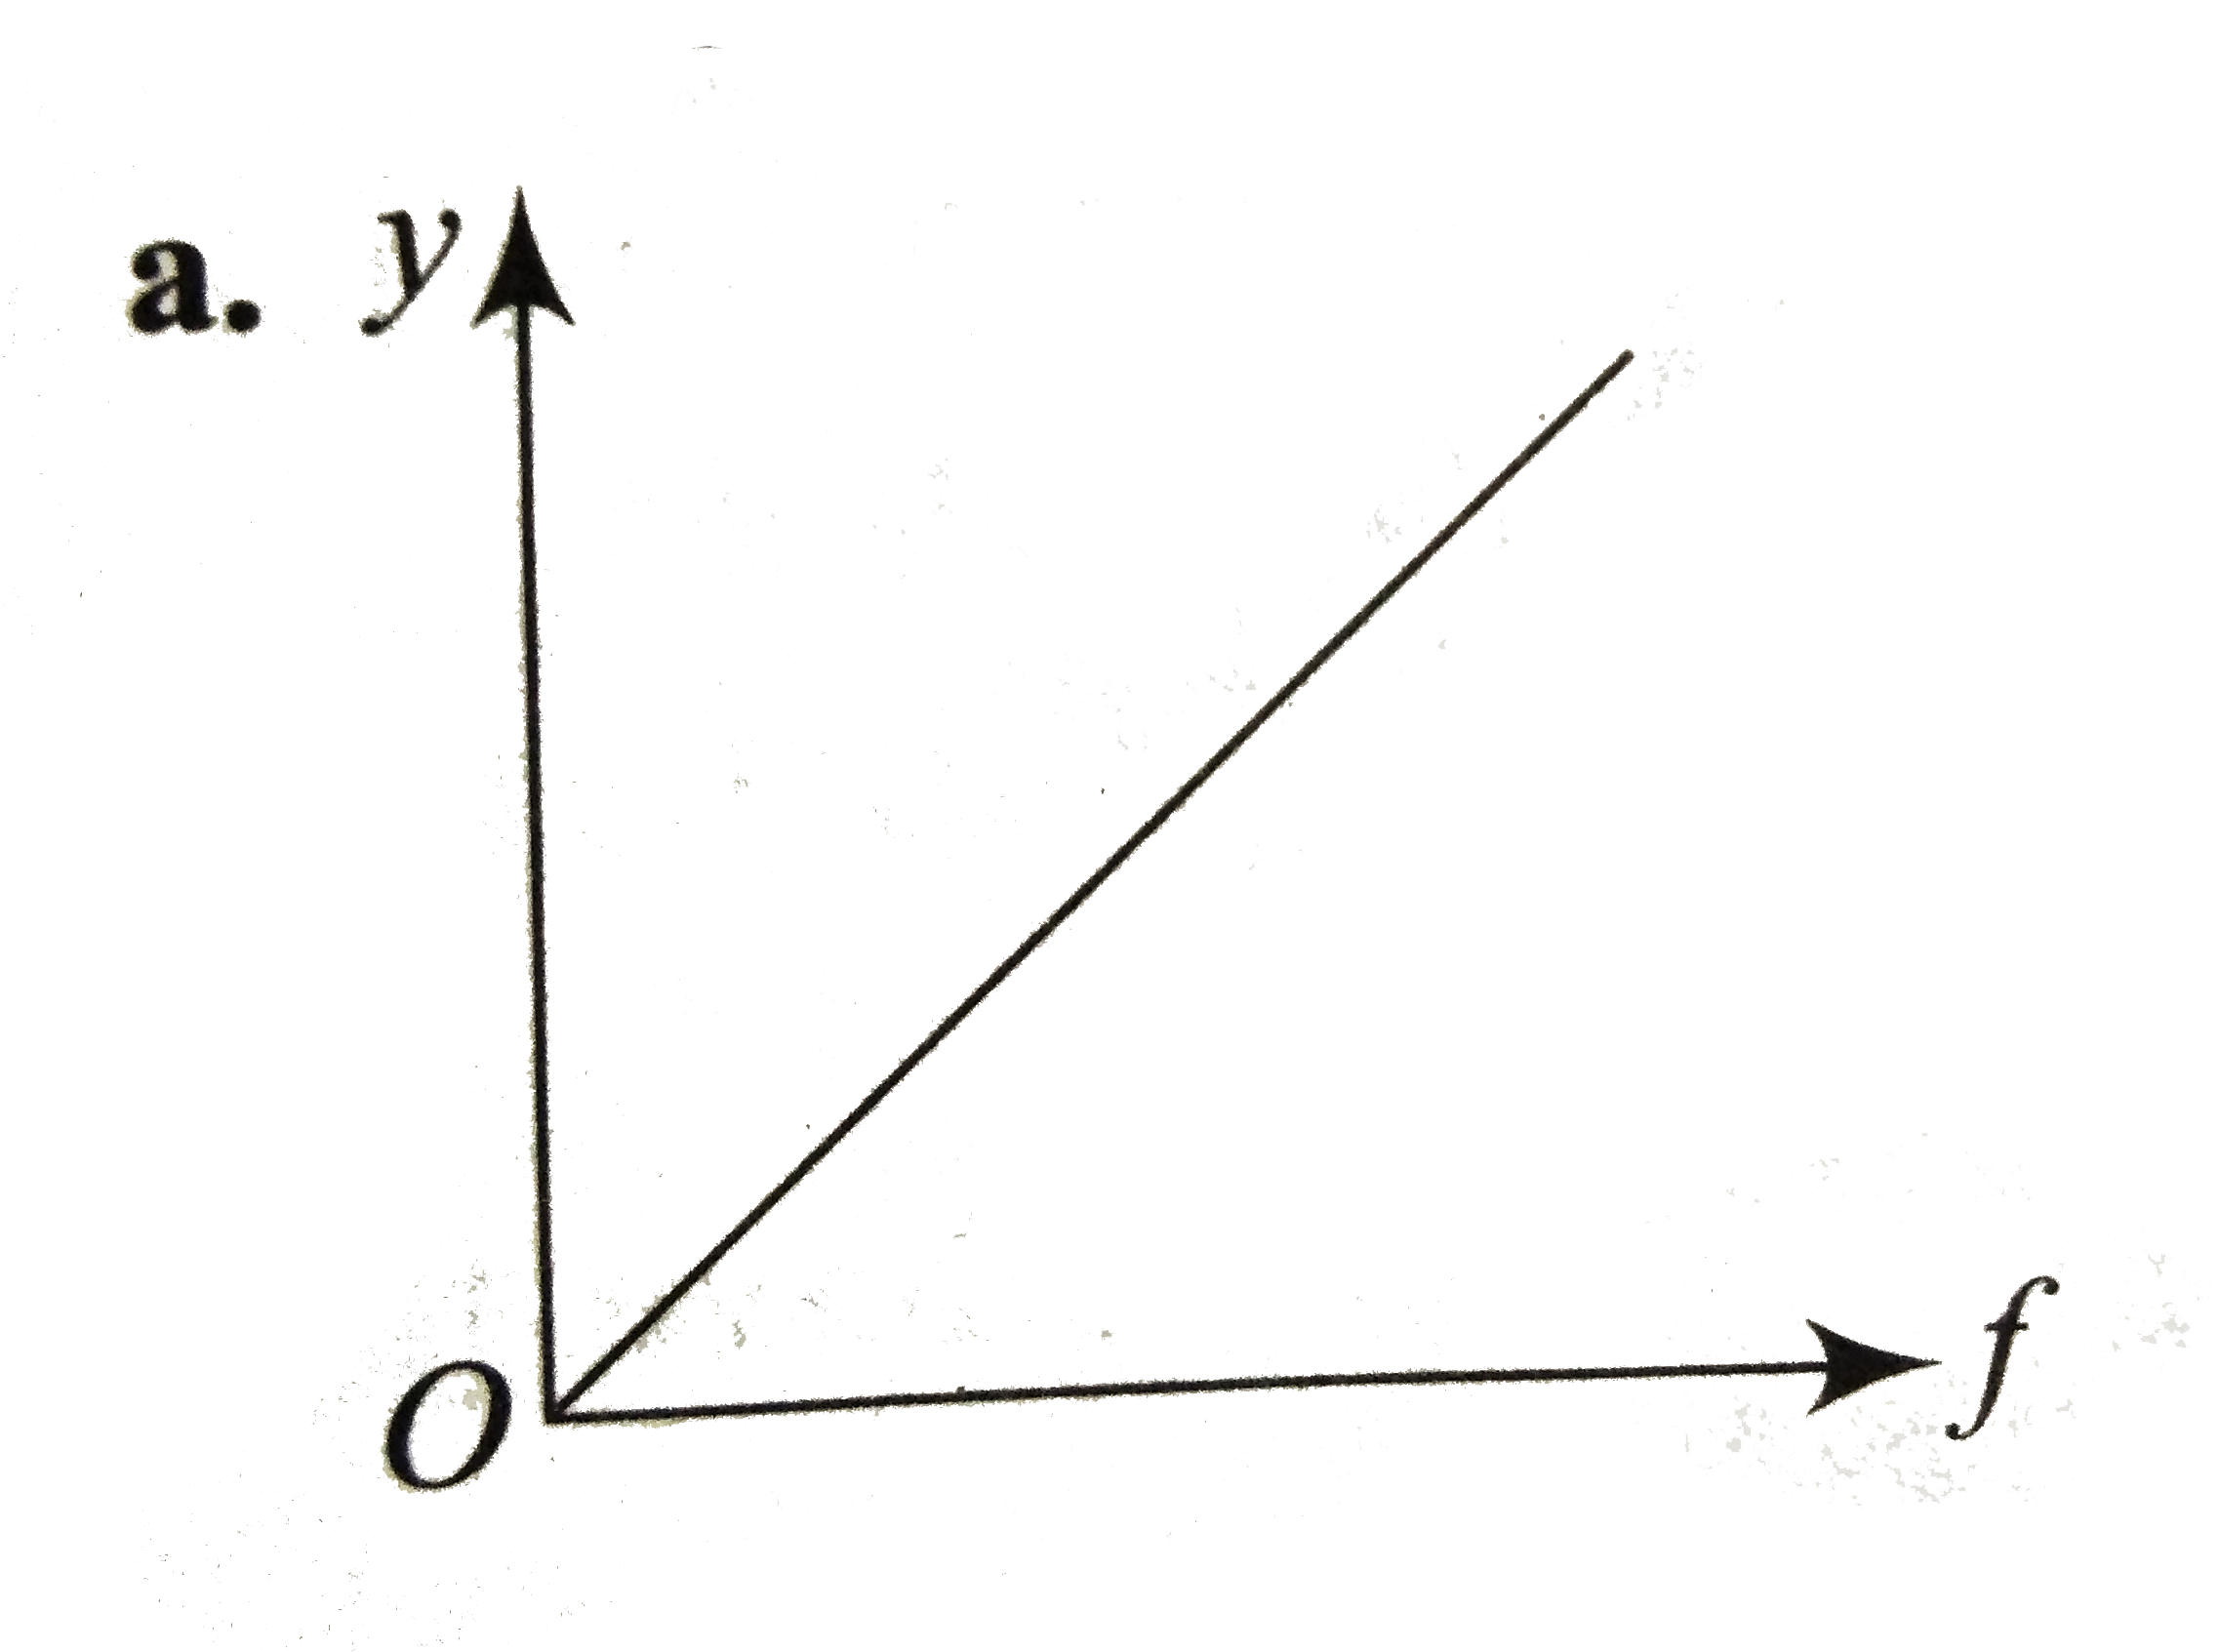
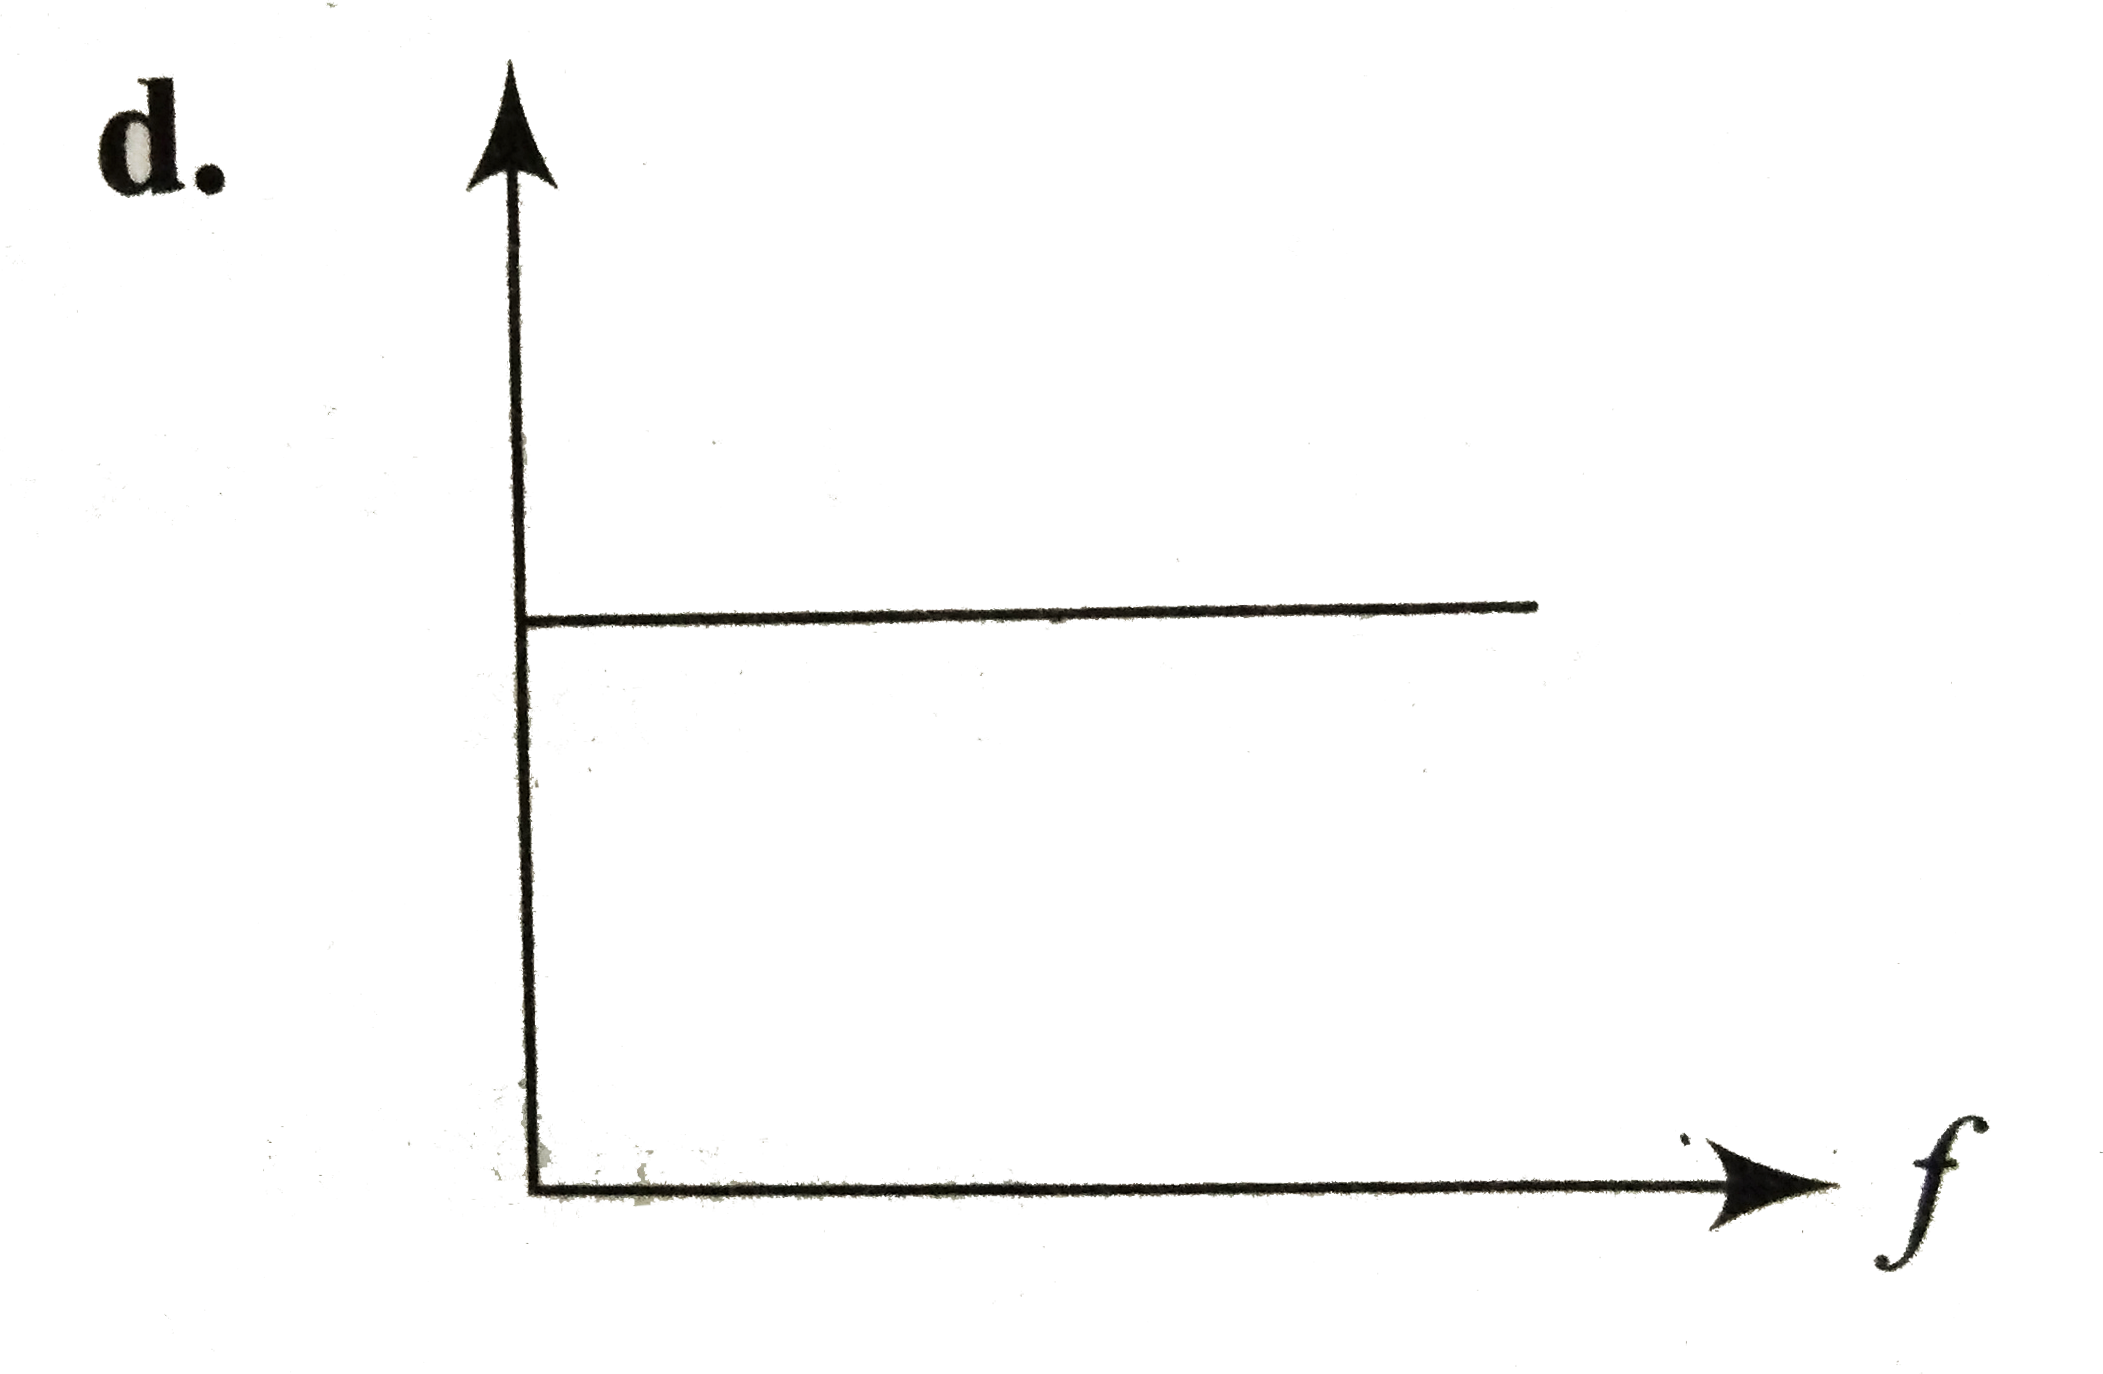
In an experiment on the photoelectric effect, an evecuated photocell with a pure metal cothode is used. Which graph best represents the variation of B, the minimum potential defference needed to prevent current from flowing, when x, the frequency of the incident light, is varied?


The correct Answer is:B
To solve the problem regarding the variation of the minimum potential difference (B) needed to prevent current from flowing in a photoelectric effect experiment as the frequency (x) of the incident light is varied, we can follow these steps:
1. Understanding the Photoelectric Effect:
The photoelectric effect states that when light of sufficient frequency shines on a metal surface, it can eject electrons from that surface. The energy of the incident photons is given by E=hf, where h is Planck's constant and f is the frequency of the incident light.
Hint: Remember that the energy of the incident photon is directly proportional to its frequency.
2. Work Function and Kinetic Energy:
The energy of the incident photon must overcome the work function (ϕ) of the metal to release an electron. The equation can be expressed as:
hf=ϕ+KEmax
where KEmax is the maximum kinetic energy of the emitted electrons.
3. Relating Potential Difference to Kinetic Energy:
The maximum kinetic energy of the emitted electrons can also be expressed in terms of the potential difference (V) as:
KEmax=eV
where e is the charge of an electron. Therefore, we can rewrite the equation as:
hf=ϕ+eV
4. Rearranging the Equation:
Rearranging the equation gives us:
V=hf−ϕe
This shows that the potential difference (V) is a linear function of the frequency (f).
5. Identifying the Minimum Potential Difference:
The minimum potential difference (B) needed to prevent current from flowing occurs when hf=ϕ. Thus, if we set V=0, we find that:
0=hf−ϕe⟹hf=ϕ⟹f=ϕh
This indicates that there is a threshold frequency (f0=ϕh) below which no photoelectrons are emitted.
6. Graphical Representation:
The graph of B (potential difference) versus x (frequency) will be a straight line with a positive slope, starting from the threshold frequency. Below this frequency, the potential difference will be constant (zero), and above this frequency, it will increase linearly.
7. Selecting the Correct Graph:
Based on the above analysis, the graph that best represents this relationship will be a straight line that starts from a point on the frequency axis corresponding to the threshold frequency and continues upward, indicating that as the frequency increases, the minimum potential difference also increases.
Conclusion:
The correct graph is the one that shows a linear increase in potential difference (B) with increasing frequency (x) after a certain threshold frequency.
The photoelectric effect states that when light of sufficient frequency shines on a metal surface, it can eject electrons from that surface. The energy of the incident photons is given by E=hf, where h is Planck's constant and f is the frequency of the incident light.
The energy of the incident photon must overcome the work function (ϕ) of the metal to release an electron. The equation can be expressed as:
hf=ϕ+KEmax
where KEmax is the maximum kinetic energy of the emitted electrons.
The maximum kinetic energy of the emitted electrons can also be expressed in terms of the potential difference (V) as:
KEmax=eV
where e is the charge of an electron. Therefore, we can rewrite the equation as:
hf=ϕ+eV
Rearranging the equation gives us:
V=hf−ϕe
This shows that the potential difference (V) is a linear function of the frequency (f).
The minimum potential difference (B) needed to prevent current from flowing occurs when hf=ϕ. Thus, if we set V=0, we find that:
0=hf−ϕe⟹hf=ϕ⟹f=ϕh
This indicates that there is a threshold frequency (f0=ϕh) below which no photoelectrons are emitted.
The graph of B (potential difference) versus x (frequency) will be a straight line with a positive slope, starting from the threshold frequency. Below this frequency, the potential difference will be constant (zero), and above this frequency, it will increase linearly.
Based on the above analysis, the graph that best represents this relationship will be a straight line that starts from a point on the frequency axis corresponding to the threshold frequency and continues upward, indicating that as the frequency increases, the minimum potential difference also increases.
The correct graph is the one that shows a linear increase in potential difference (B) with increasing frequency (x) after a certain threshold frequency.
Topper's Solved these Questions
- PHOTOELECTRIC EFFECTBOOK - CENGAGE PHYSICS ENGLISHCHAPTER - PHOTOELECTRIC EFFECTEXERCISE - Multiple Correct
10 Videos
- PHOTOELECTRIC EFFECTBOOK - CENGAGE PHYSICS ENGLISHCHAPTER - PHOTOELECTRIC EFFECTEXERCISE - Linked Comprehension
44 Videos
- PHOTOELECTRIC EFFECTBOOK - CENGAGE PHYSICS ENGLISHCHAPTER - PHOTOELECTRIC EFFECTEXERCISE - Subjective
16 Videos
- NUCLEAR PHYSICSBOOK - CENGAGE PHYSICS ENGLISHCHAPTER - NUCLEAR PHYSICSEXERCISE - ddp.5.5
14 Videos
- RAY OPTICSBOOK - CENGAGE PHYSICS ENGLISHCHAPTER - RAY OPTICSEXERCISE - DPP 1.6
12 Videos
Similar Questions
A point source of light is used in an experiment on photoelectric effect . Which of the following curves best represents the variation of photo current (i) with distance (d) of the source from the emitter ?

View SolutionIn an experiment of photoelectric effect, the graph of maximum kinetic energy EK of the emitted photoelectrons versus the frequency v of the incident light is a straight line AB as shown in Figure below:
Find : (i) Threshold frequency of the metal.
(ii) work function of the metal
(iii) Stopping potential for the photoelectrons emitted by the light of frequency v=30×1014 Hz.
View Solution
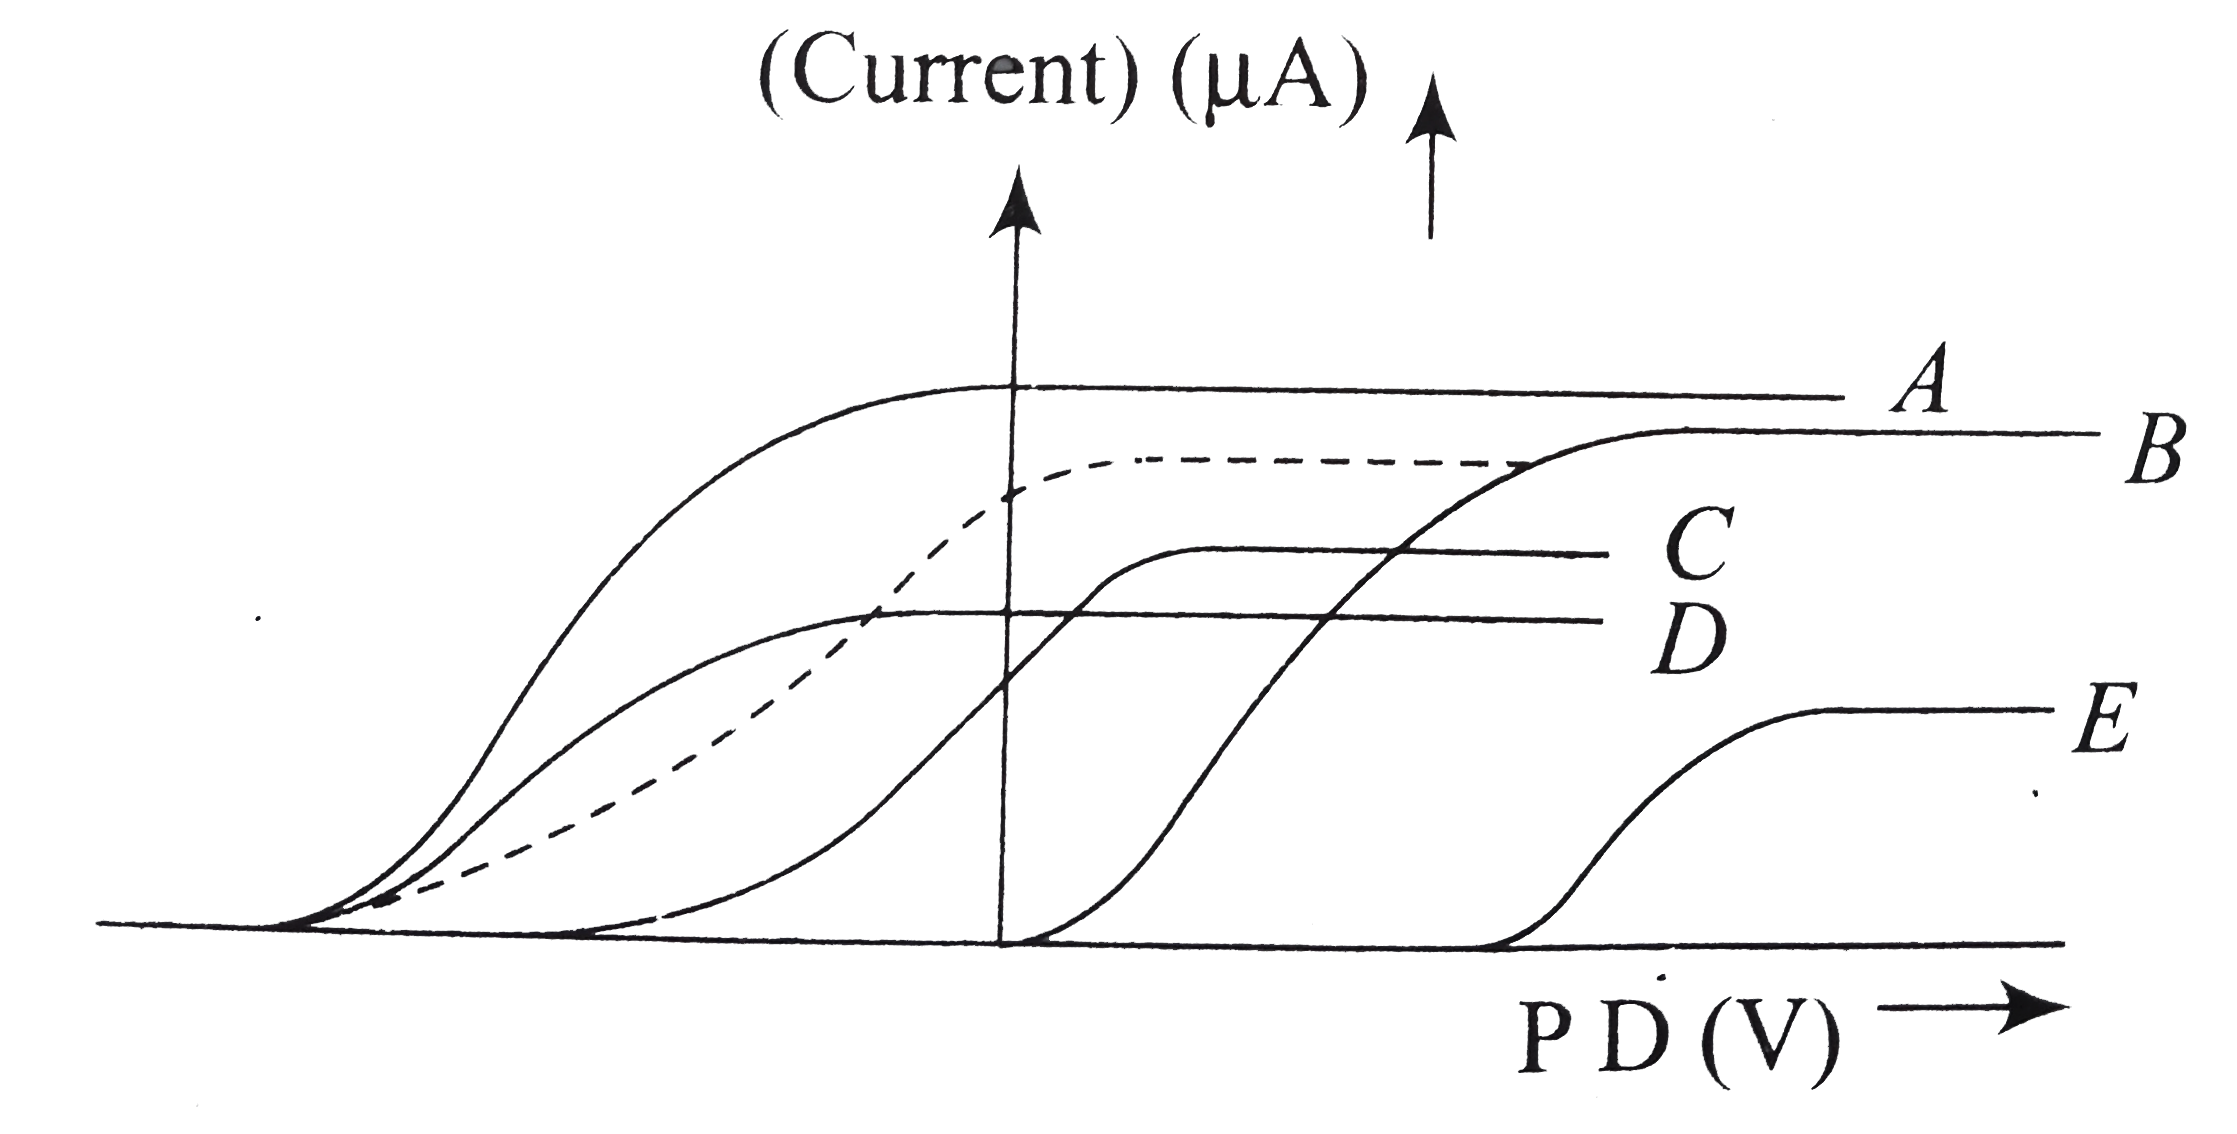
A photoelectric cell is connected to a source of variable potential difference, connected across it and the photoelectric current resulting (μA) is plotted against the applied potential difference (V). The graph in the broken line represents one for a given frequency and intensity of the incident radiation . If the frequency is increased and the intensity is reduced, which of the following graphs of unbroken line represents the new situation?
View SolutionExplain giving reasons for the following :
(a) Photoelectric current in a photocell increases with the increase in intensity of the incident radiation.
(b) The stopping potential V0 varies linearly with the frequency ν of the incident radiation for a given photosensitive surface with the slope remaining the same for different surfaces.
(c) Maximum kinetic energy of the photoelectrons is independent of the intensity of incident radiation.
View SolutionTwo charge +q1 and +q2 placed on x-axis at posiution A and B as shown in figure. Which graph best represent potential as a function of distance r from charge q1

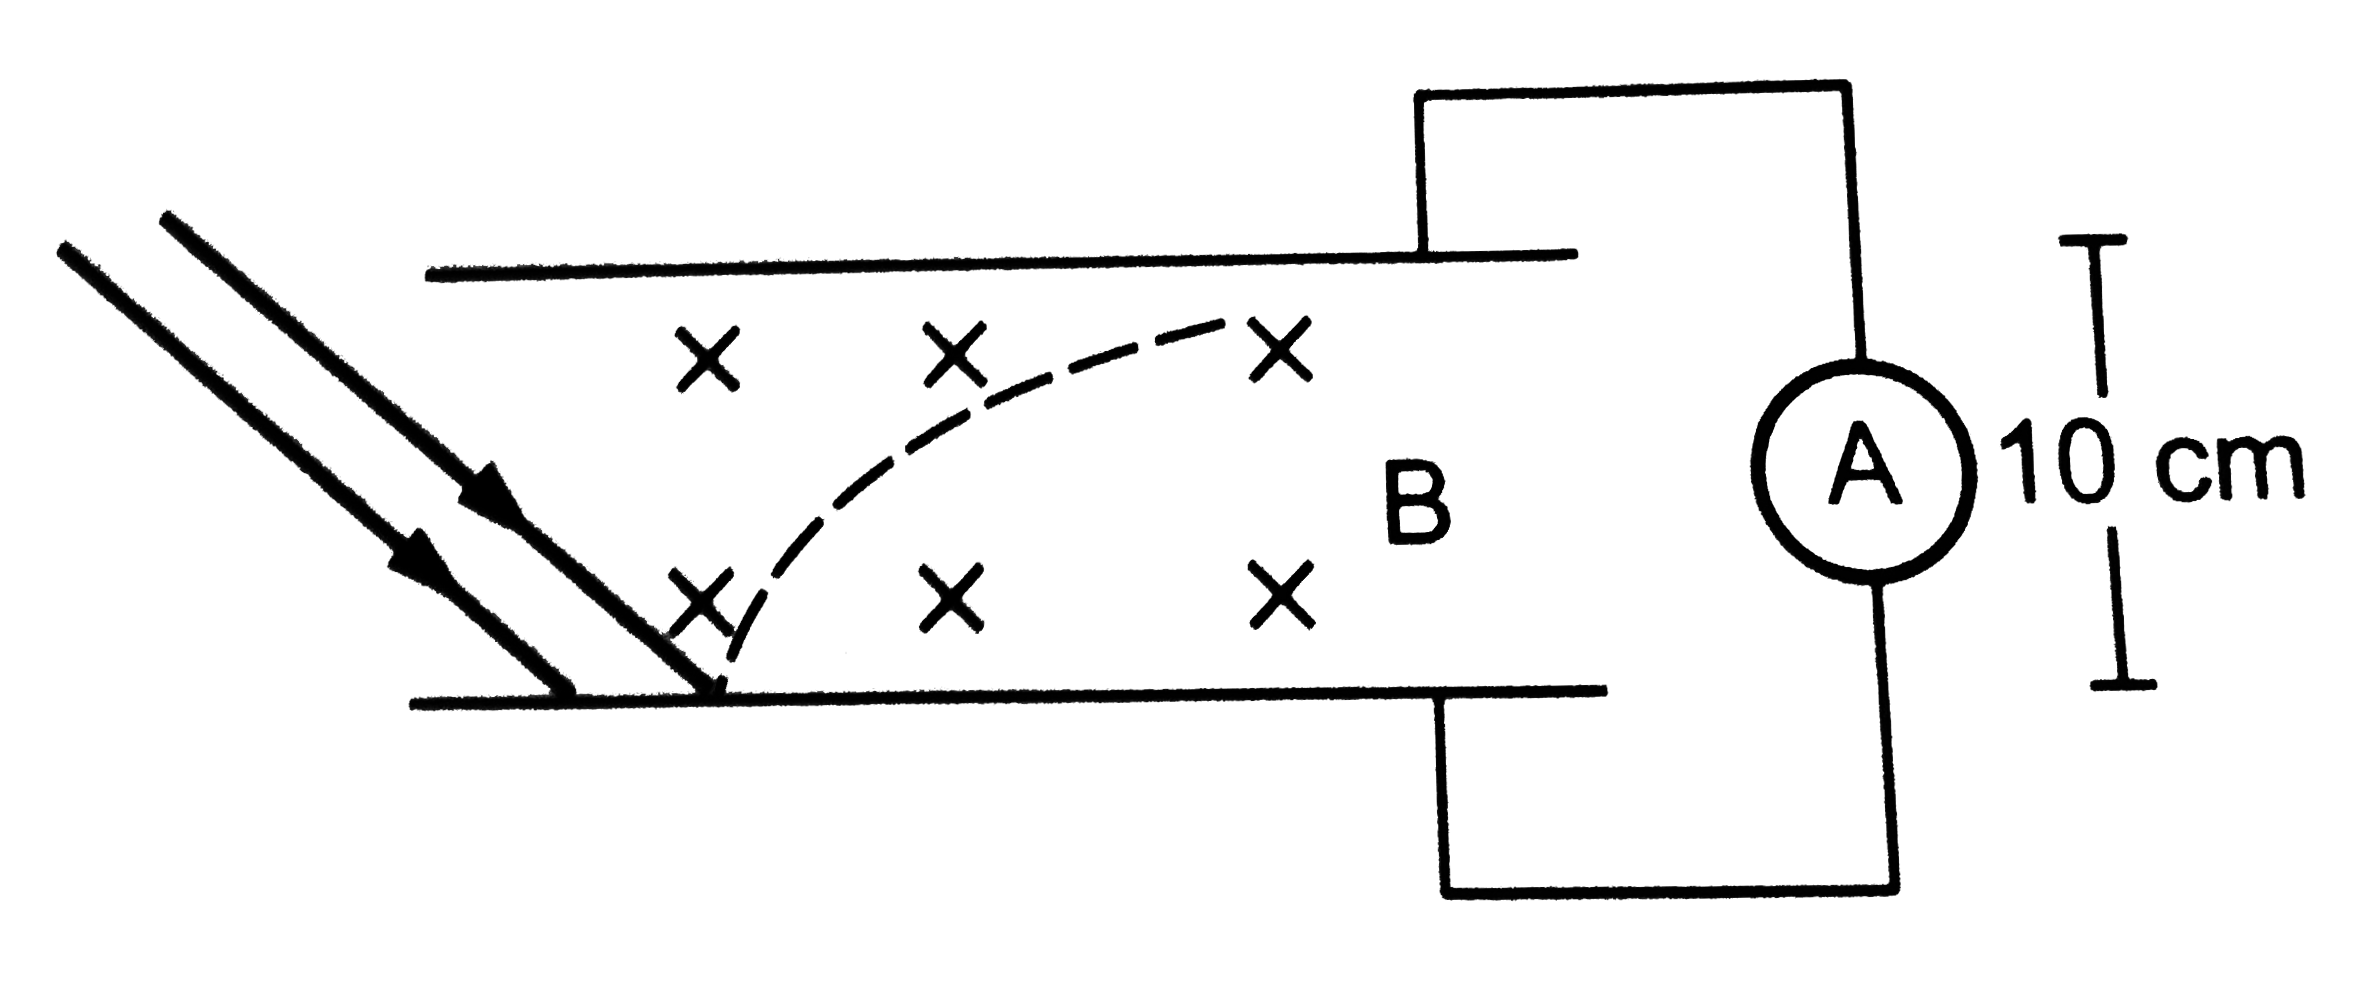
View SolutionIn an experiment on photoelectric effect, the emitter and the collector plates are placed at a separation of 10cm and are connected through an ammeter without any cell. A magnetic field B exists parallel to the plates. The work function of the emitter is 2.39 e V and the light incident on it has wavelengths between 400nm and 600nm. Find the minimum value of B for which the current registered by the ammeter is zero. Neglect any effect of space charge.

View SolutionFor a photoelectric cell the graph showing the variation of cut of voltage (V0) with frequency (v) of incident light is best represented by

View SolutionIn an experiment on the photo-electric effect Singly ionized helium is excited electronically to different energy levels. The light emitted by ionised helium is incident on photo-electric plate in a photocell. When helium is excited to fourth energy level, then the observed stopping potential of the photocell is found to be five times the stopping potential measured when the photoelectrons are produced by using light emitted by hydrogen atom, excited to the third energy level. Determine the work function of the material of the photo-electric plate.
View SolutionIn an experiment on photoelectric effect light of wavelength 400nm is incident on a metal plate at rate of 5W. The potential of the collector plate is made sufficiently positive with respect to emitter so that the current reaches the saturation value. Assuming that on the average one out of every 106 photons is able to eject a photoelectron, find the photocurrent in the circuit.
View SolutionIn an experiment on photoelectric effect of light wavelength 400 nm is incident on a metal plate at rate of 5W. The potential of the collector plate is made sufficiently positive with respect to emitter so that the current reaches the saturation value. Assuming that on the average one out of every 106 photons is able to eject a photoelectron, find the photocurrent in the cirucuit.
View Solution
