For a photoelectric cell the graph showing the variation of cut of voltage (V0) with frequency (v) of incident light is best represented by


The correct Answer is:D
Step by step video & image solution for For a photoelectric cell the graph showing the variation of cut of voltage (V_(0)) with frequency (v) of incident light is best represented by by Physics experts to help you in doubts & scoring excellent marks in Class 12 exams.
Updated on:21/07/2023Topper's Solved these Questions
- ELECTRON,PHONTS,PHOTOELECTRIC EFFECT & X-RAYSBOOK - CENGAGE PHYSICS ENGLISHCHAPTER - ELECTRON,PHONTS,PHOTOELECTRIC EFFECT & X-RAYSEXERCISE - dpp 3.3
15 Videos
- ELECTRON,PHONTS,PHOTOELECTRIC EFFECT & X-RAYSBOOK - CENGAGE PHYSICS ENGLISHCHAPTER - ELECTRON,PHONTS,PHOTOELECTRIC EFFECT & X-RAYSEXERCISE - multiple correct
1 Videos
- ELECTROMAGNETIC INDUCTIONBOOK - CENGAGE PHYSICS ENGLISHCHAPTER - ELECTROMAGNETIC INDUCTIONEXERCISE - compression type
7 Videos
- GEOMETRICAL OPTICSBOOK - CENGAGE PHYSICS ENGLISHCHAPTER - GEOMETRICAL OPTICSEXERCISE - Integer Type
4 Videos
Similar Questions
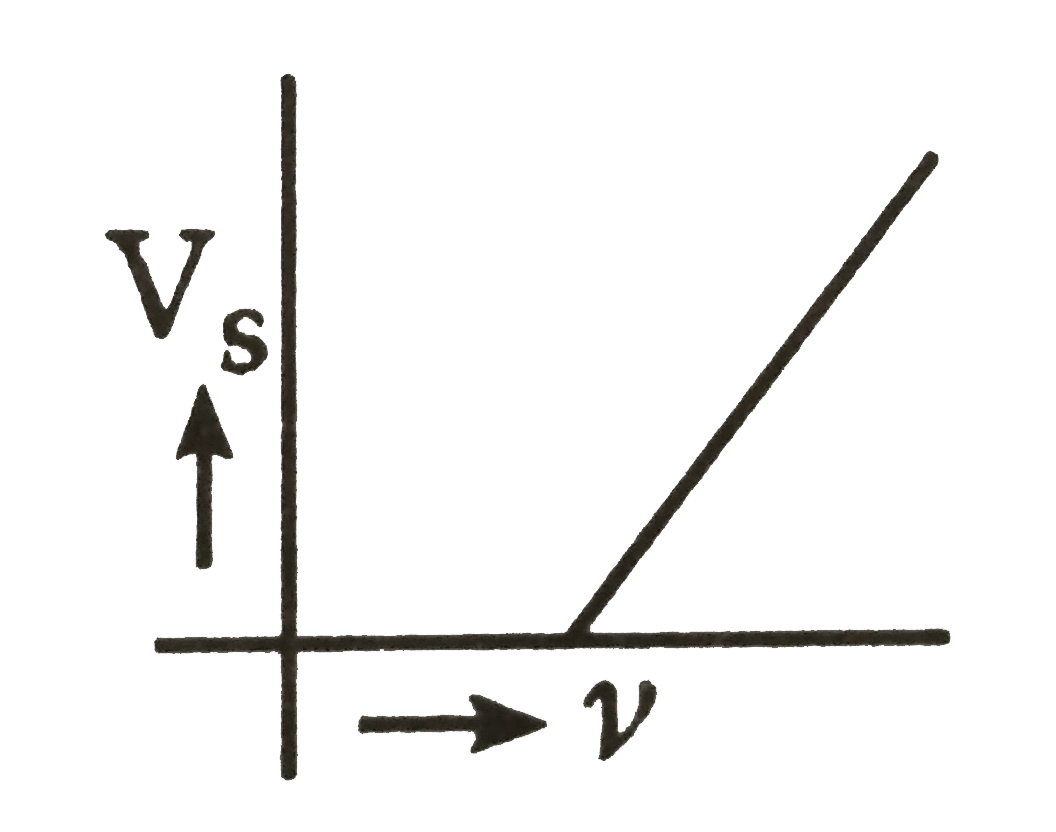
Sketch the graphs, showing the variation of stopping potential Vs with frequency v of the incident radiations for two photosensitive materials A and B having threshold frequencies v0>v'0 respectively.
(i) which of the two metals A or B has higher work function?
(ii) What information do you get from the slope of the graphs?
(iii) What does the value of the intercept of graph A on the potential axis represent?
View SolutionPlot a graph showing variation of current versus voltage for the material Ga.
View SolutionIn photoelectric effect the slope of straight line graph between stopping potential (Vs) and frequency of incident light (v) gives
View SolutionWhat is the photoelectric effect? With the help of suitable graph show the variation of photocurrent with (i) the intensity of incident radiation. (ii) the voltage applied between cathode and anode. (iii) the frequency of incident radiation.
View SolutionThe correct graph respectivley the relation between energy (E) of photoelectrons and frequency v of incident light is
View SolutionThe emission of electrons from a metal surface exposed rto light radaition of appropriate wavelength is called photoelectric effect .The emmited electron are called photo=-weklectron work function of threshold energy may be defined as the minimum amount of energy required to ejected electron from a most surface .According to Einstein
Maximum kinetic energy of ejected electron = Absorbed energy - Work function
12mv2max=h(v)−h(vn)=hv[1λ−1λn]
Where vn and λ0 are thereshold frequency and threshold wavelength respectively
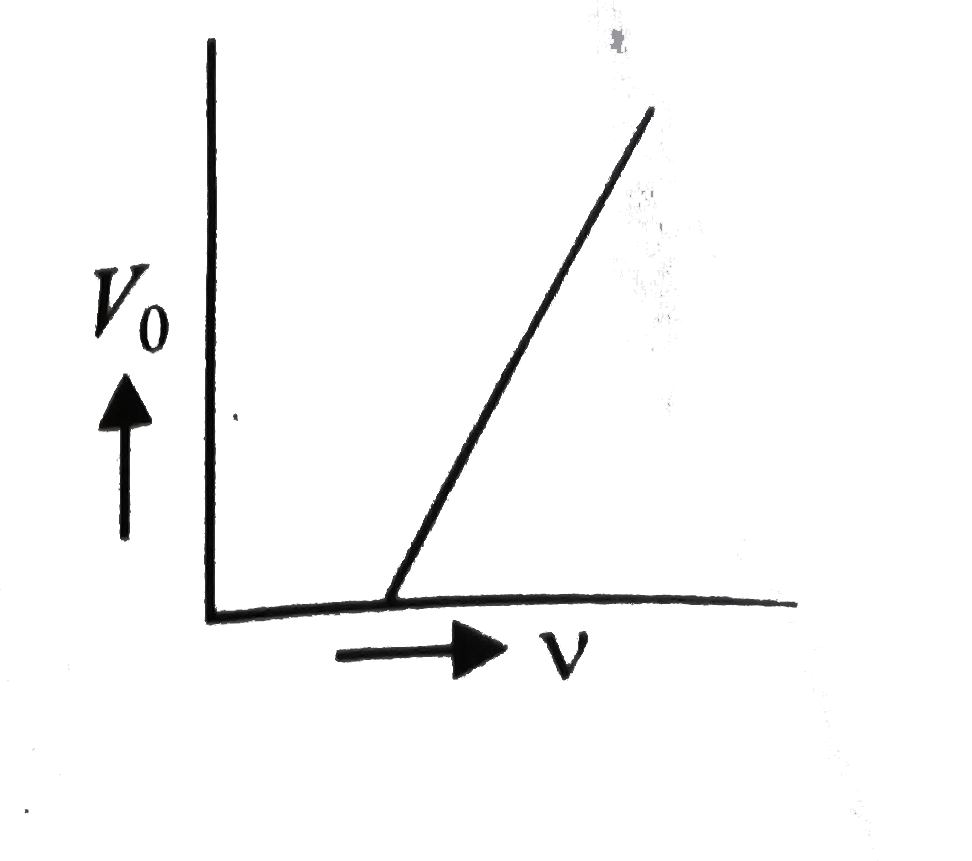
Sopping potential : it is the miximum potential at which the photoelectric current becomes zero if V0 is the stopping potential eV0=h(v−v0)
In the photoelectric currect effect the shape of strainght line graph between stopping potential (V0) and frequency of incident light (V) gves
View SolutionIn a photoelectric experiment , the stopping potential Vs is plotted against the frequency v of the incident light . The resulting curve is a straight line which makes an angle θ with the v - axis. Then tanθ will be equal to (Here E0 = work function of the surface_
View SolutionA graph regarding photoelectric effect is shown between the maximum kinetic energy of electrons and the frequency of the incident light. On the basis of data as shown in the graph, calculate (a) threshold frequency , (b) work- function, (c ) planck constant
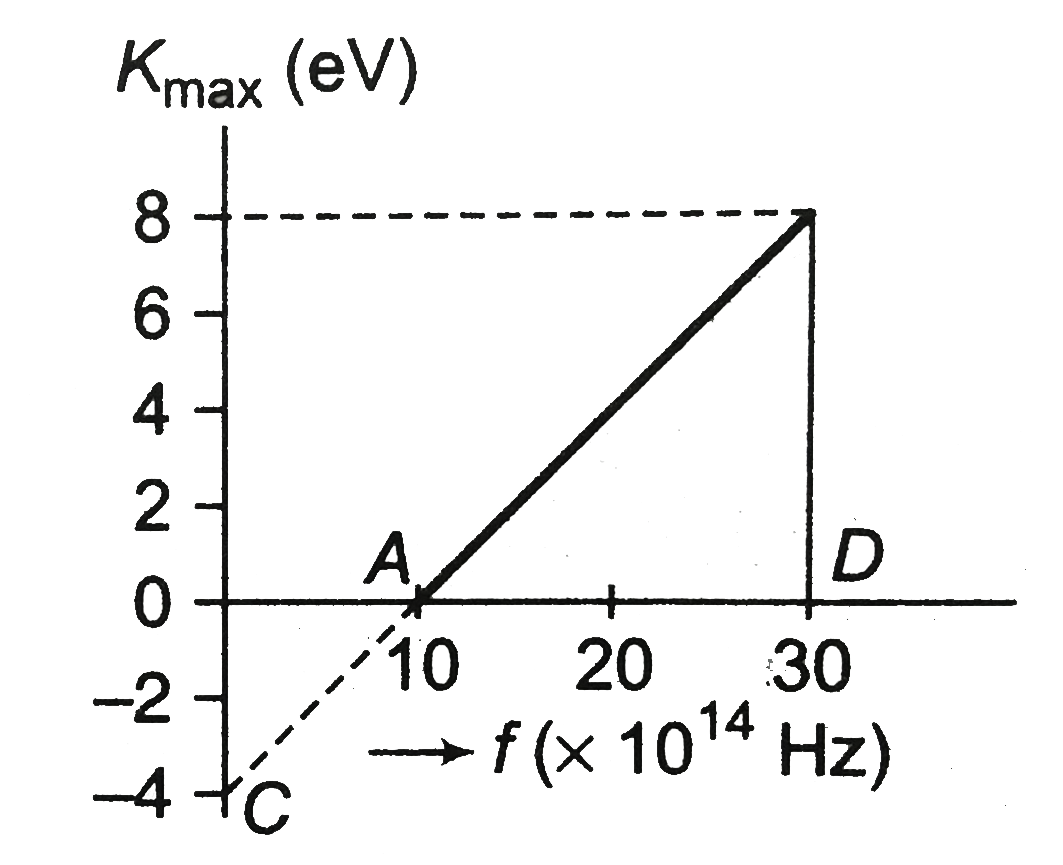
View SolutionIn an experiment of photo-electric effect, the graph of maximum kinetic energy Ek of the emitted photoelectrons versus the frequency v of the incident light is a straight line AB as shown in figure below :
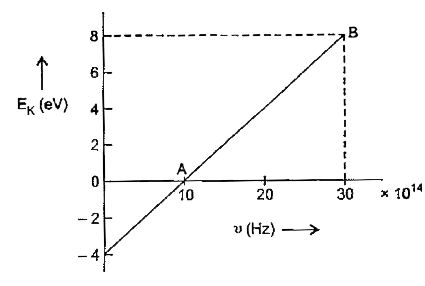
Stopping potential for the photoelectrons emitted by the light of frequency
v=30×1014Hz
View SolutionIn an experiment of photo-electric effect, the graph of maximum kinetic energy Ek of the emitted photoelectrons versus the frequency v of the incident light is a straight line AB as shown in figure below :
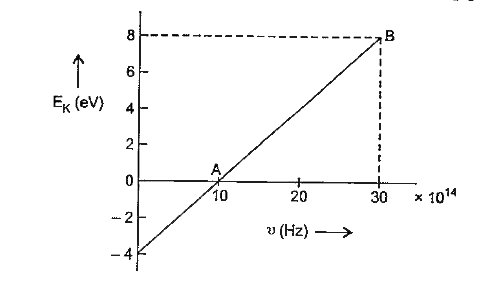
Threshold frequency of the metal.
View Solution
