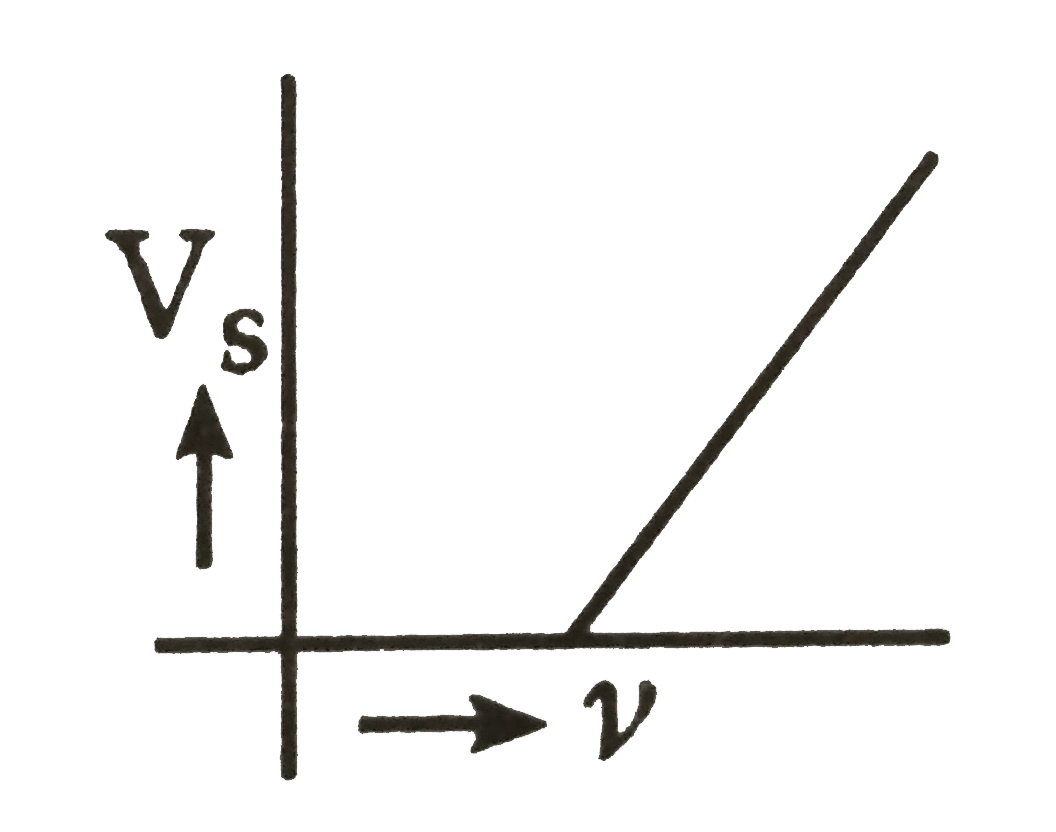
In photoelectric the slope of the straight line graph between stopping potential and frequency of incident radiation gives the ratio of Plancks constant to Solution in Telugu
Velocity of light
Mass of electron
Charge of electron
Intensity of photon
The correct Answer is:C
The graph shown above results in a ratio of Planck's constant to charge on electron .

Topper's Solved these Questions
Similar Questions
A battery of the emf 18 V and internal resistance of 3 Ω and another of emf 10 V and internal resistance of 1 Ω are connected as shown in figure. Then the voltmeter reading is
 03:27View Solution
An elastic spring of unstretched length L and force constant k is stretched by a small length x. It is further stretched by another small length y. Work done during the second stretching is
01:28View SolutionWhat is the effect of decrease in frequency of incident radiation on the stopping potential in photoelectric emission?
View SolutionIn photo electric effect, the slope of the straight line graph between stopping potential and frequency of the incident light gives the ratio of Planck's constant to
View SolutionIn photoelectric effect the slope of straight line graph between stopping potential (V_(0)) and freqency of incident light (v) gives:
01:41View SolutionWhich of the following is the graph between the frequency (v) of the incident radiations and the stopping potential ?
04:17View SolutionIn photoelectric effect the slope of straight line graph between stopping potential (V_(s)) and frequency of incident light (v) gives
02:52View SolutionIn a photoelectric experiment, the reciprocal of the slope of the straight line graph giving the relation between the stopping potential and the frequency of incident radiation gives
05:30View SolutionIn case of photoelectric effect, the graph of kinetic energy of photoelectron with respect to the frequency of incident radiation will be a straight line. The slope of this straight line depends on
04:58View SolutionIn photoelectric effect the slope of stop of stopping potential versus frequency of incident light for a given surface will be
04:58View SolutionAccording to Einstein's photoelectric equation, the graph of KE of the photoelectron emitted from the metal versus the frequency of the incident radiation gives a straight line graph, whose slope
View SolutionAccording to Einstein's photoelectric equation the graph of K.E. of the photoelectron emitted from the metal versus the frequency of the incident radiation gives a straight line graph whose slope
View SolutionThe slope of the graph drawn between stopping potential and frequency of incident radiation will be
01:12View SolutionThe graph between cut-off potential and frequency of incident radiation in photoelectric effect is
View SolutionIn photoelectric effect the slope of straight line graph between stopping potential (Vs) and frequency of incident light (v) gives
 View Solution

