In the figure Vab versus time graph along an inductor is shown. Match the following
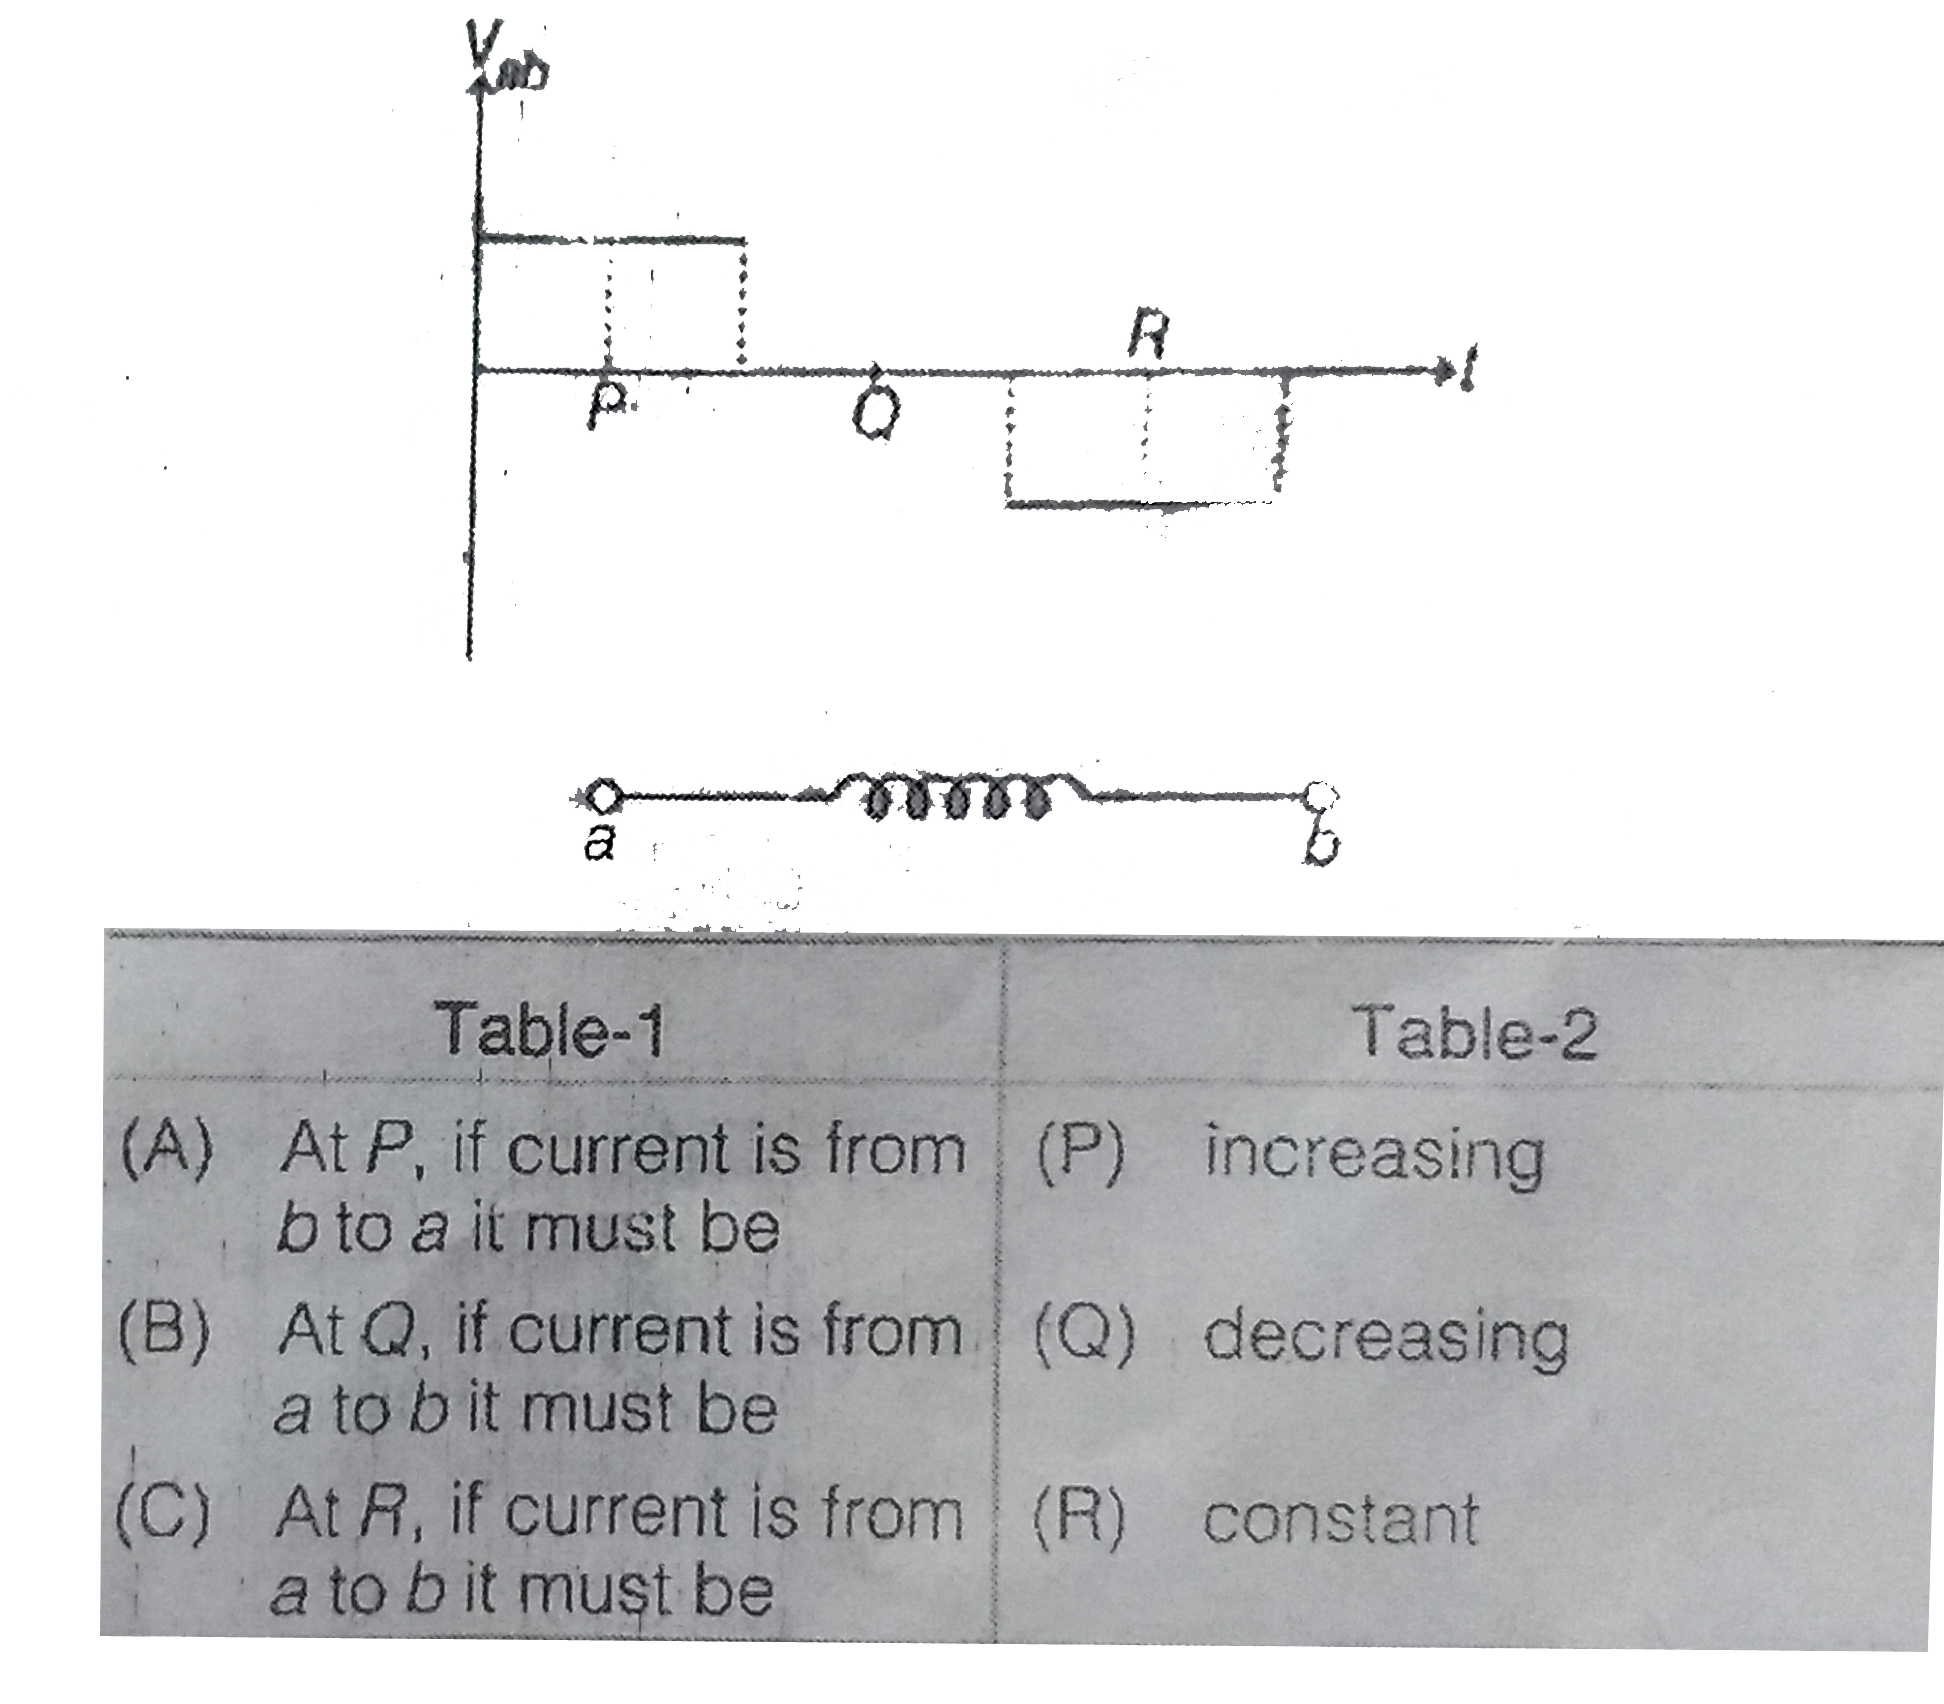
The correct Answer is:(A) Q, (B) R, (C) Q
Step by step video, text & image solution for In the figure V_(ab) versus time graph along an inductor is shown. Match the following by Physics experts to help you in doubts & scoring excellent marks in Class 12 exams.
Similar Questions
Knowledge Check
- Question 1 - Select One
Pressure versus density graph of an ideal gas is shown in figure
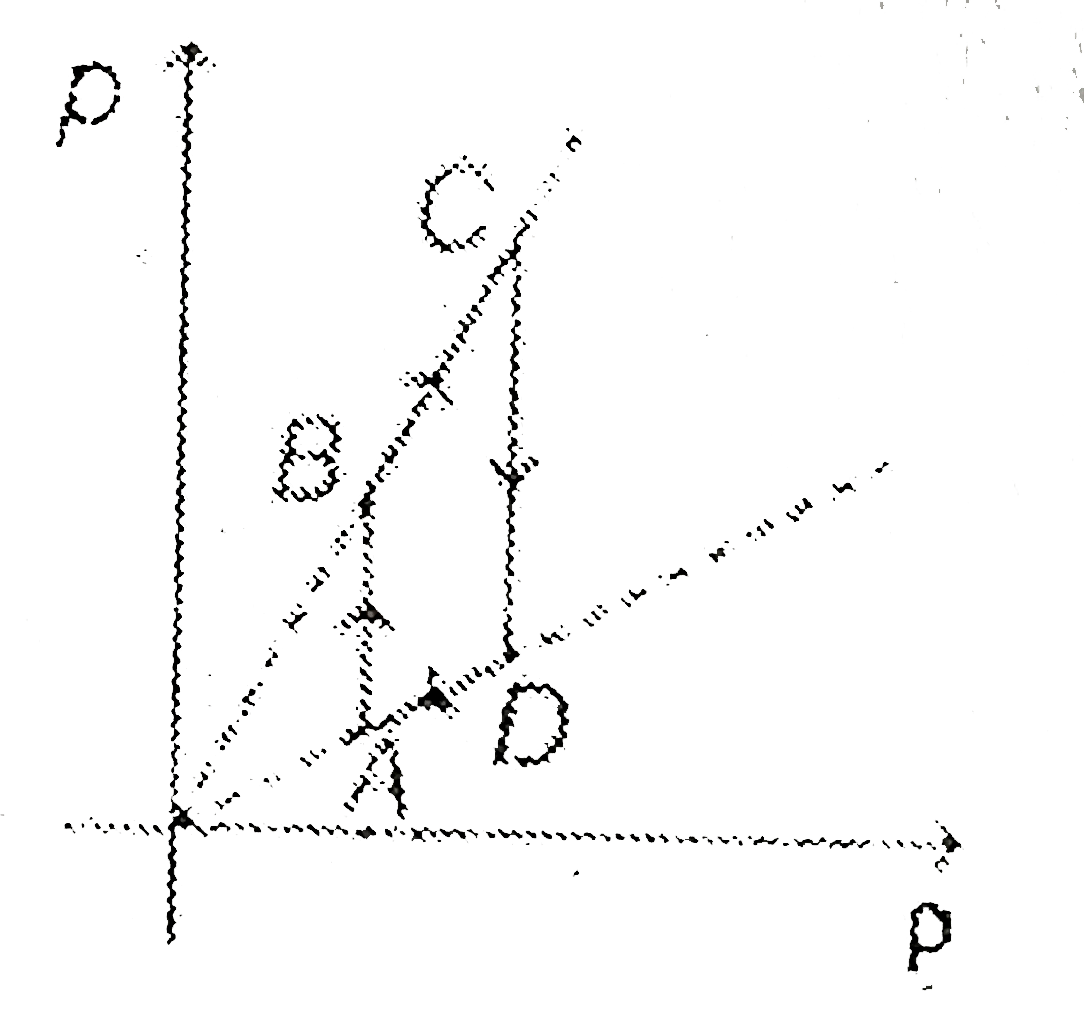 Aduring the process AB work done by the gas is positiveBduring the process AB work done by the gas is negativeCduring the process BC internal energy of the gas is increasingDNone of the above
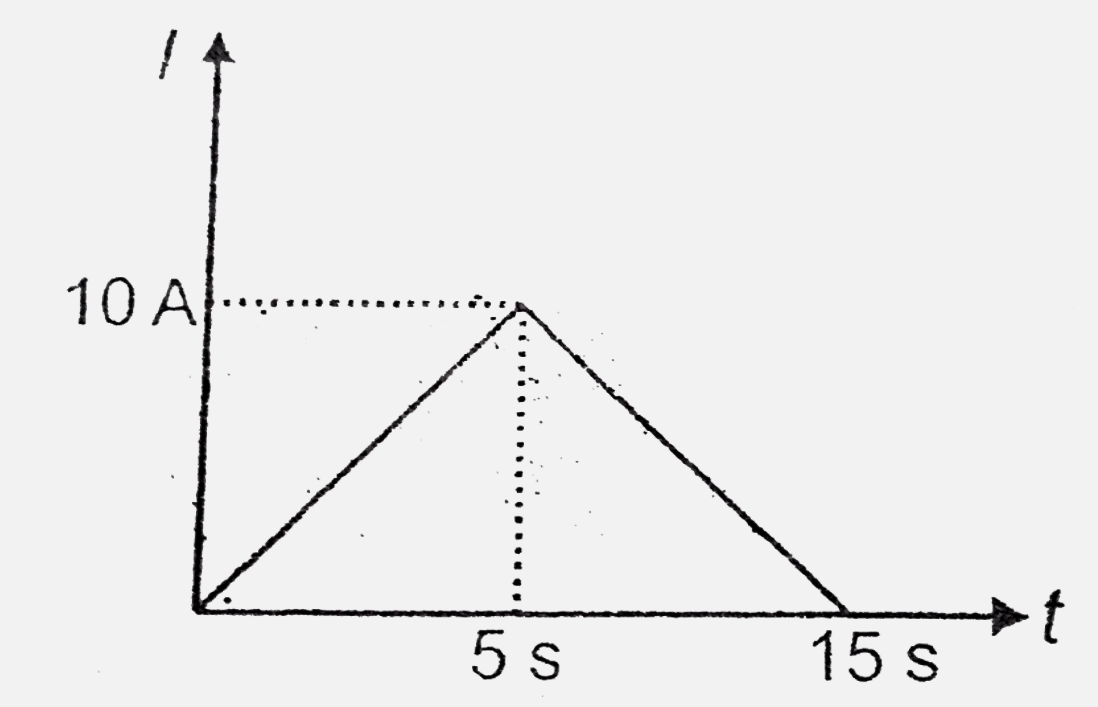
Current l versus time t graph through a conductor is shown in the figure. Average current through the conductor in the interval 0 to 15 s is
 View Solution
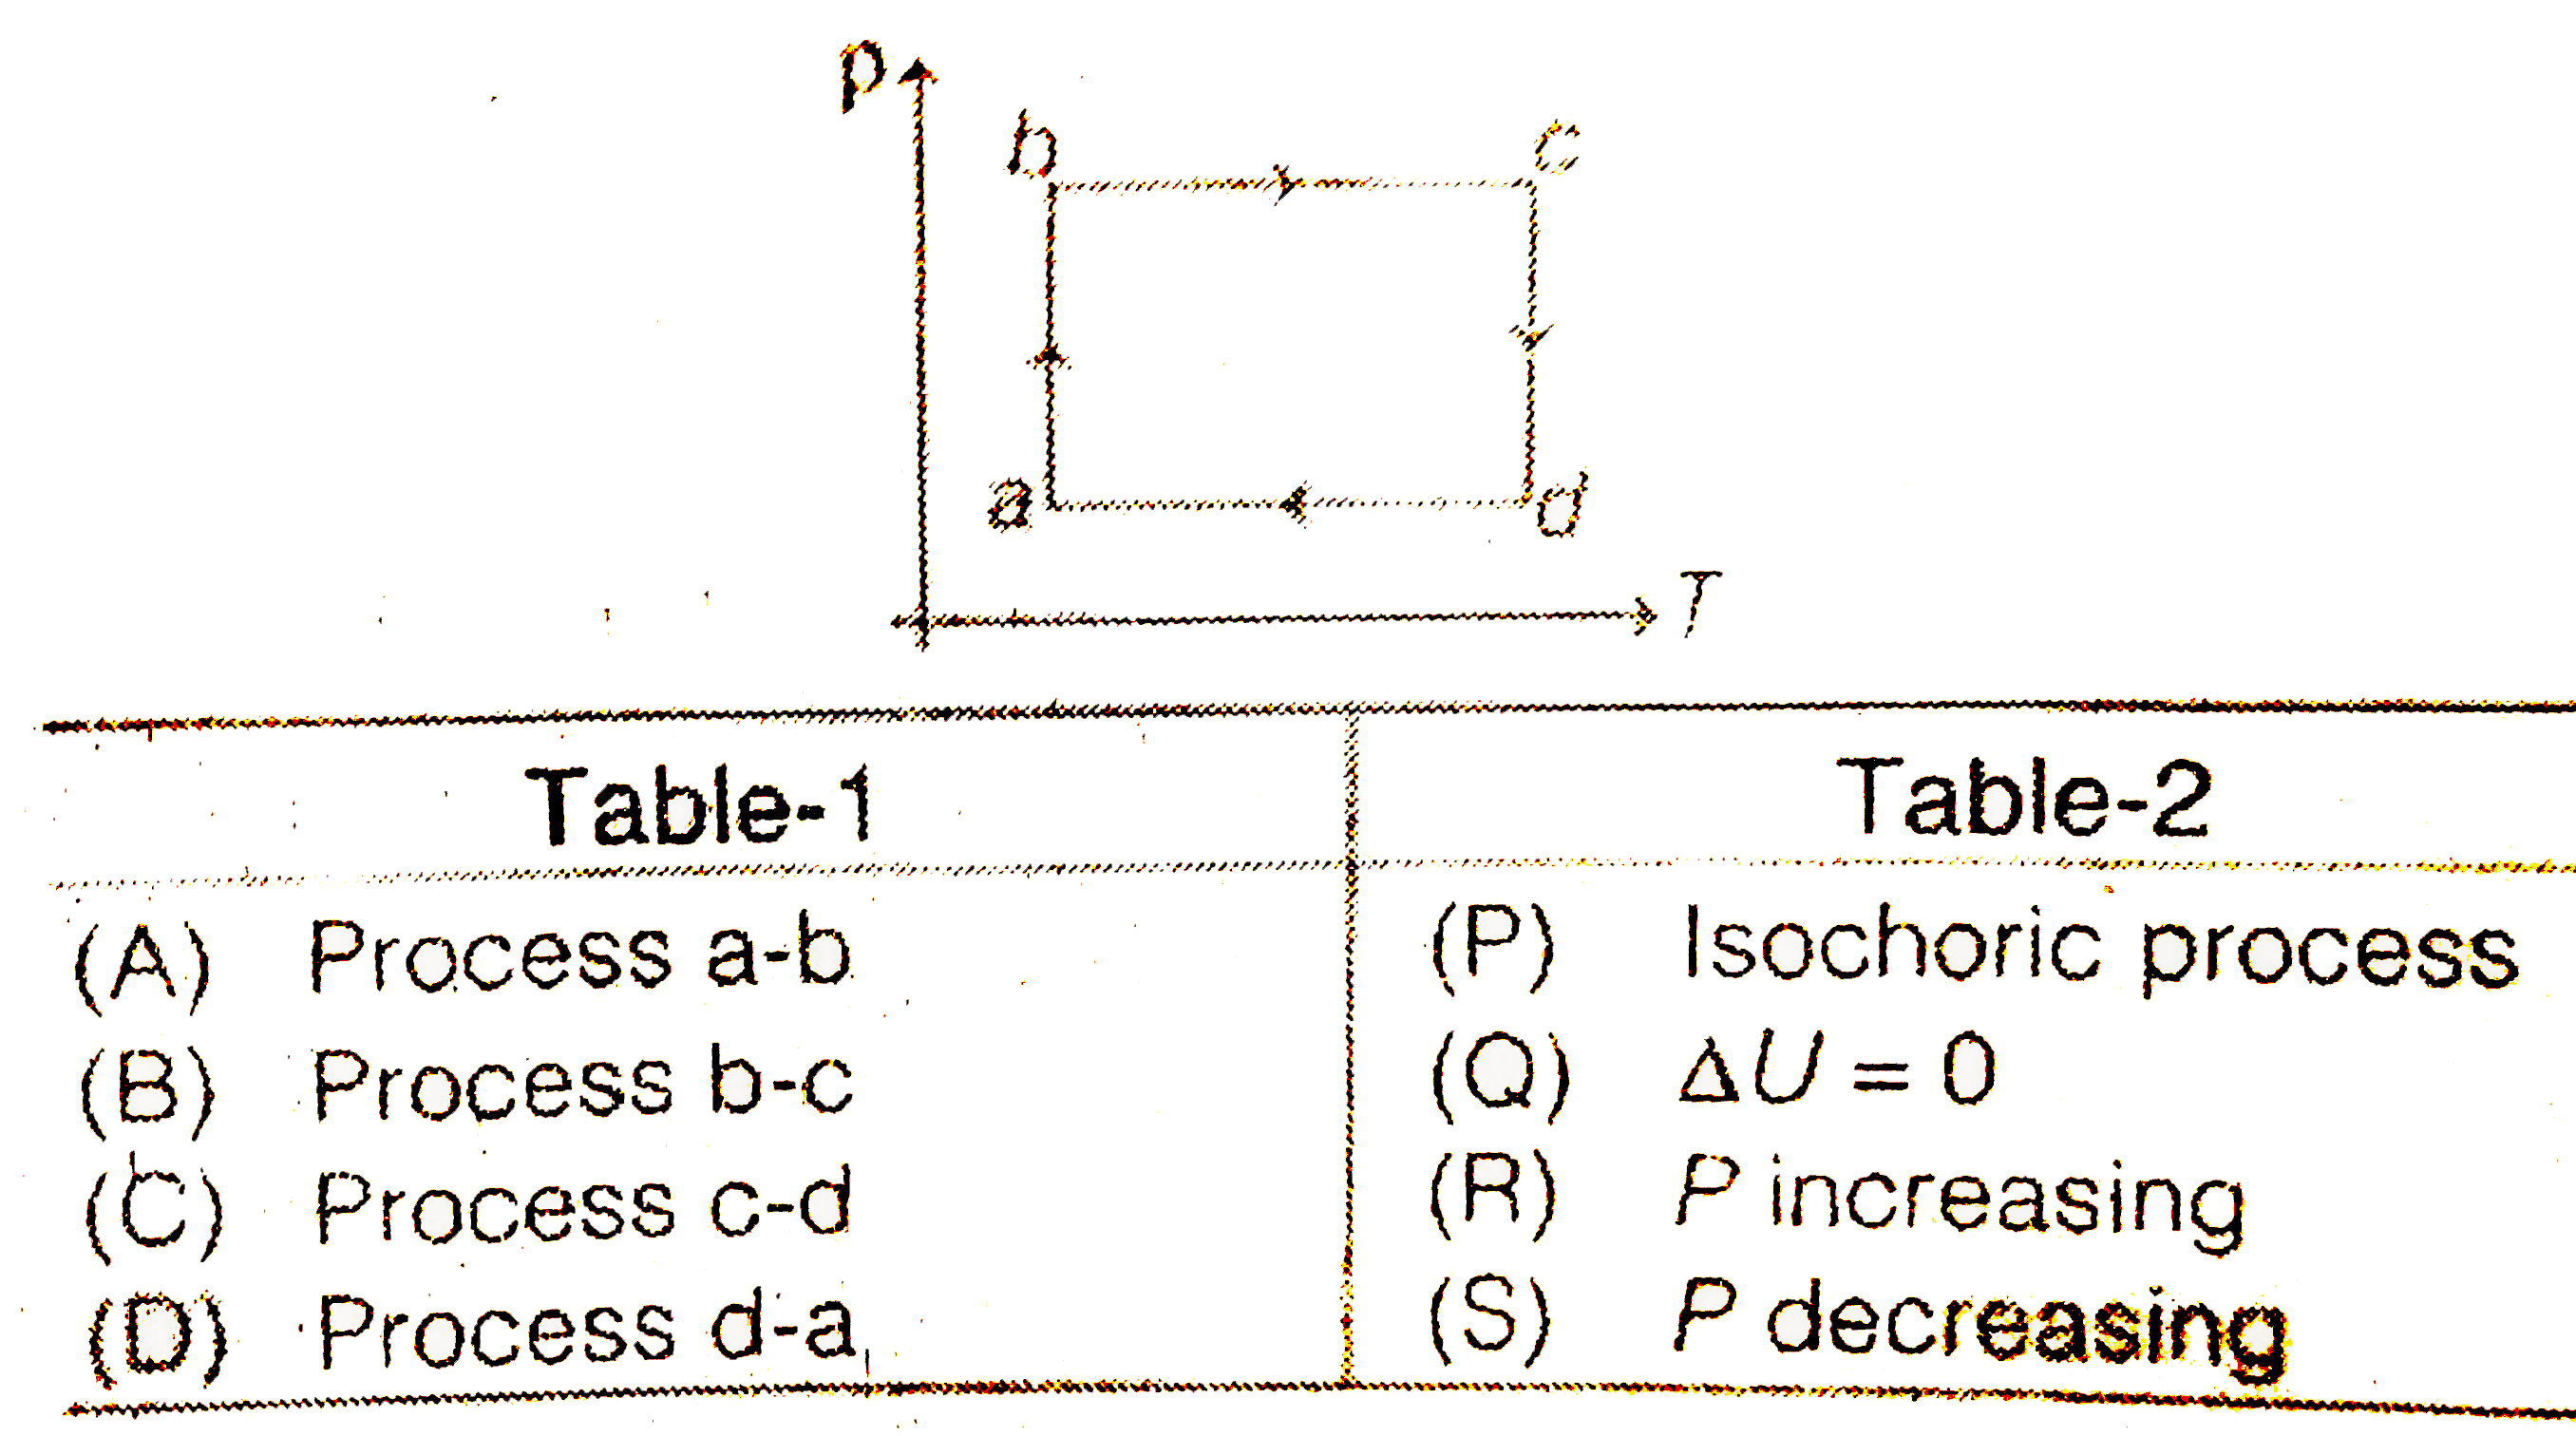
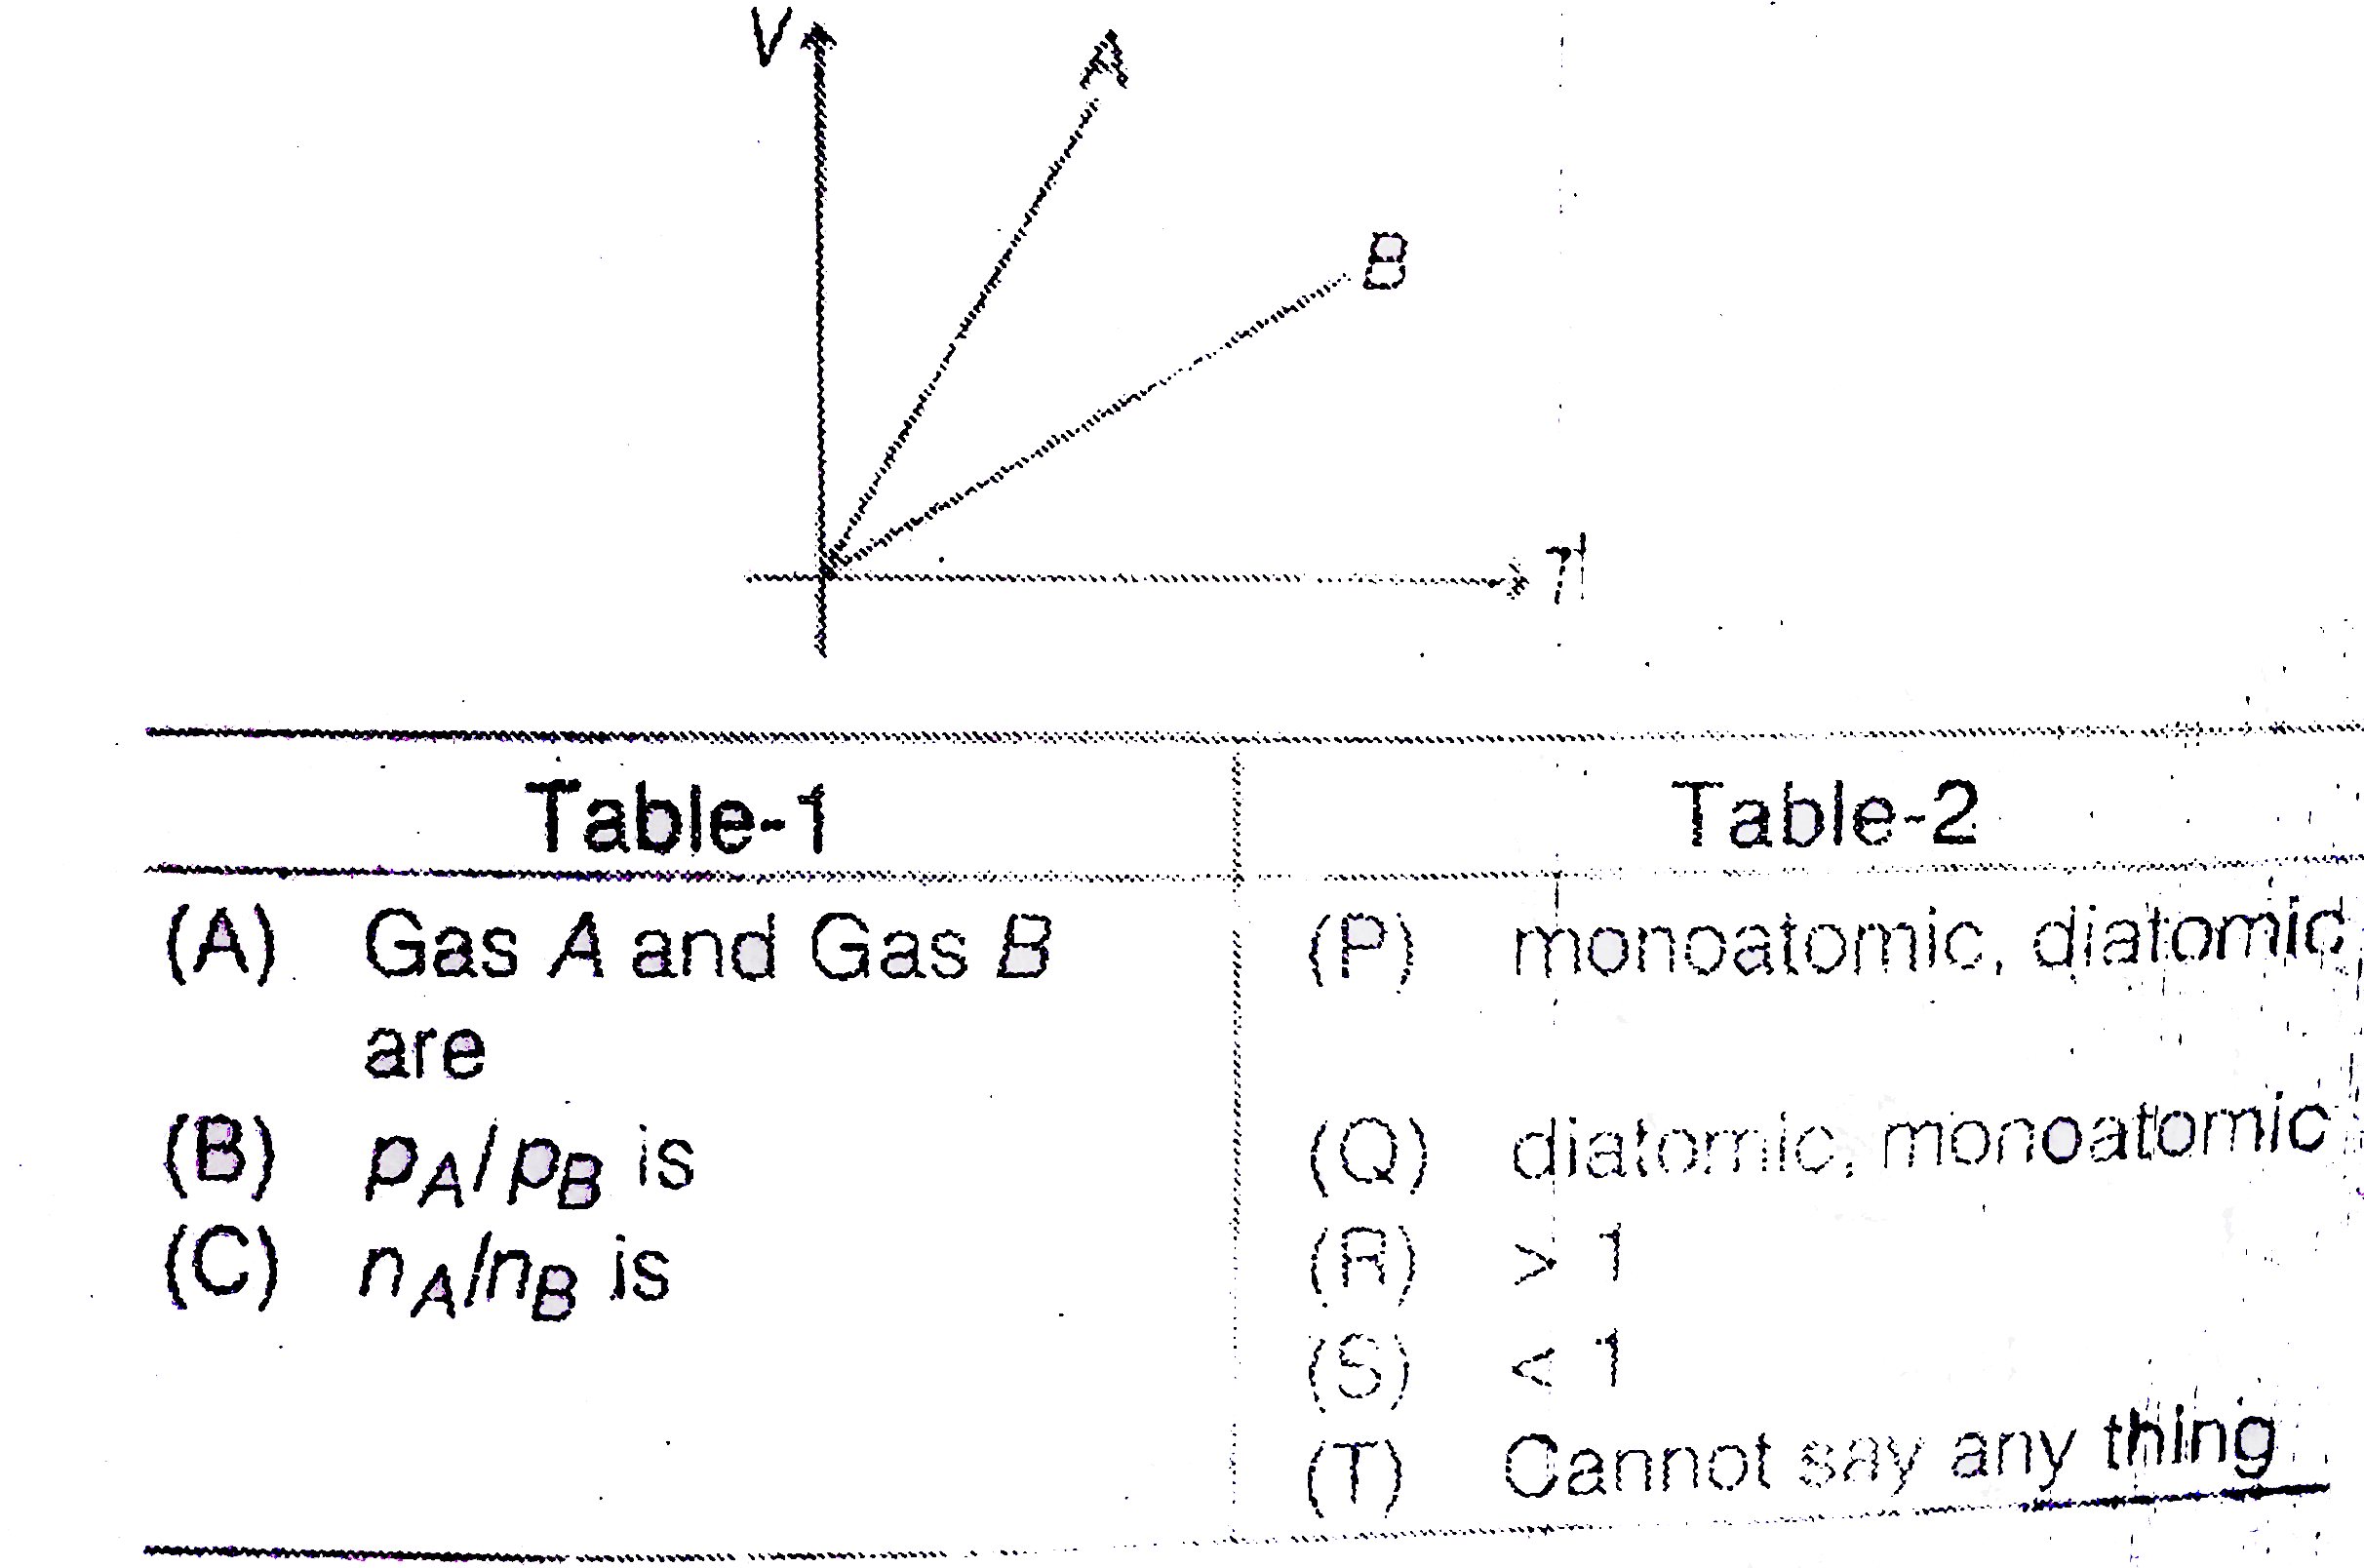
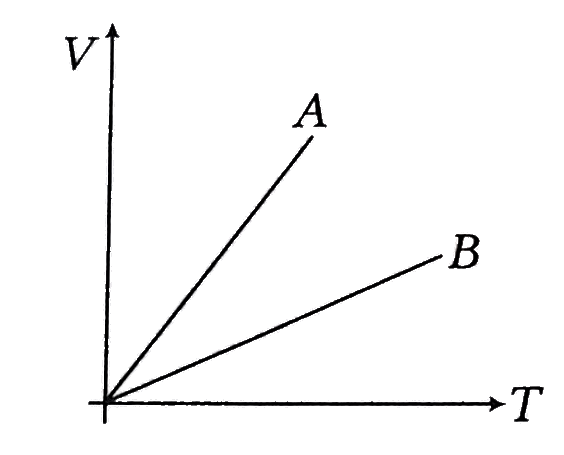
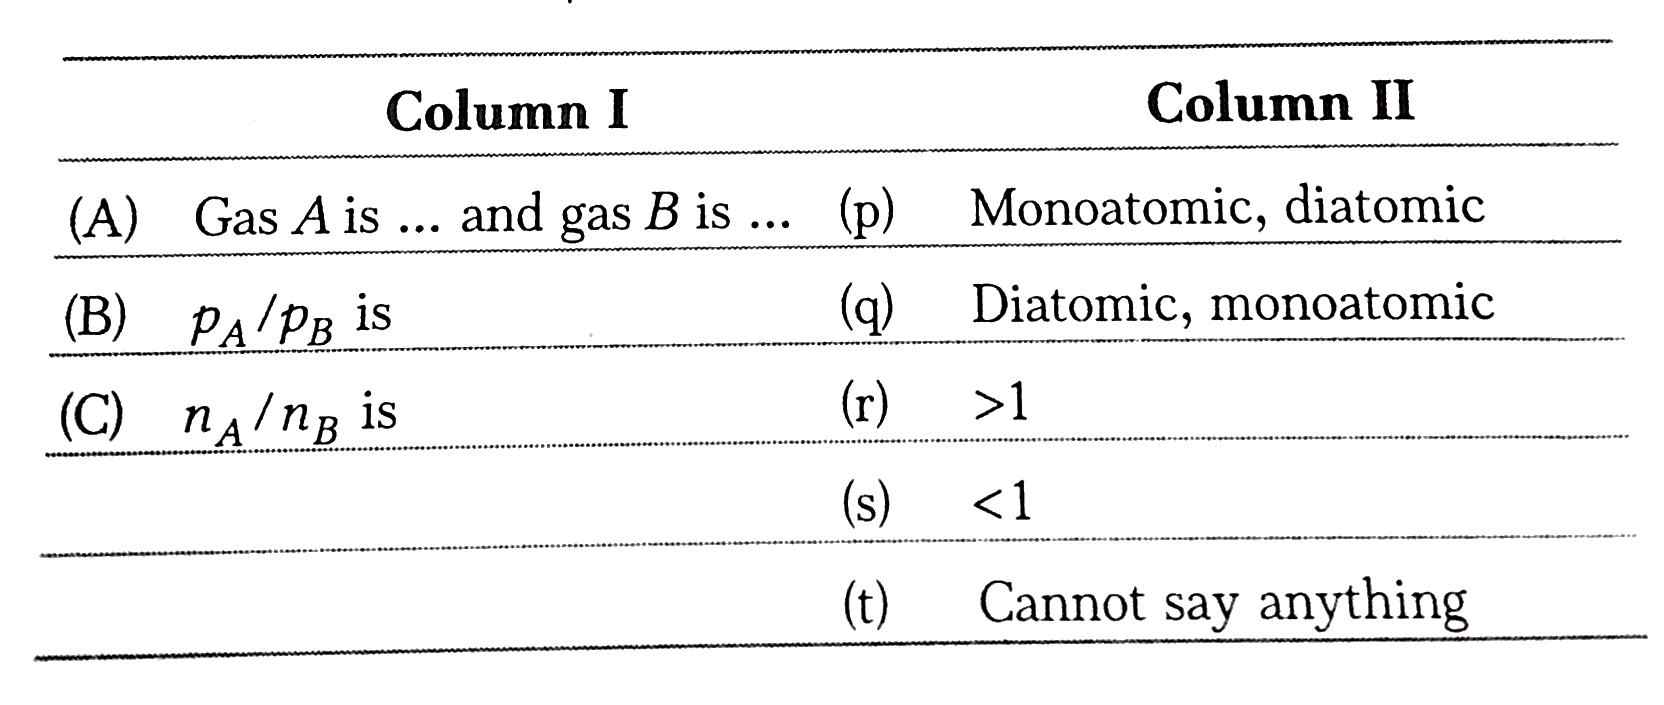
In the V-T graph shown in figure match the following.
 View Solution
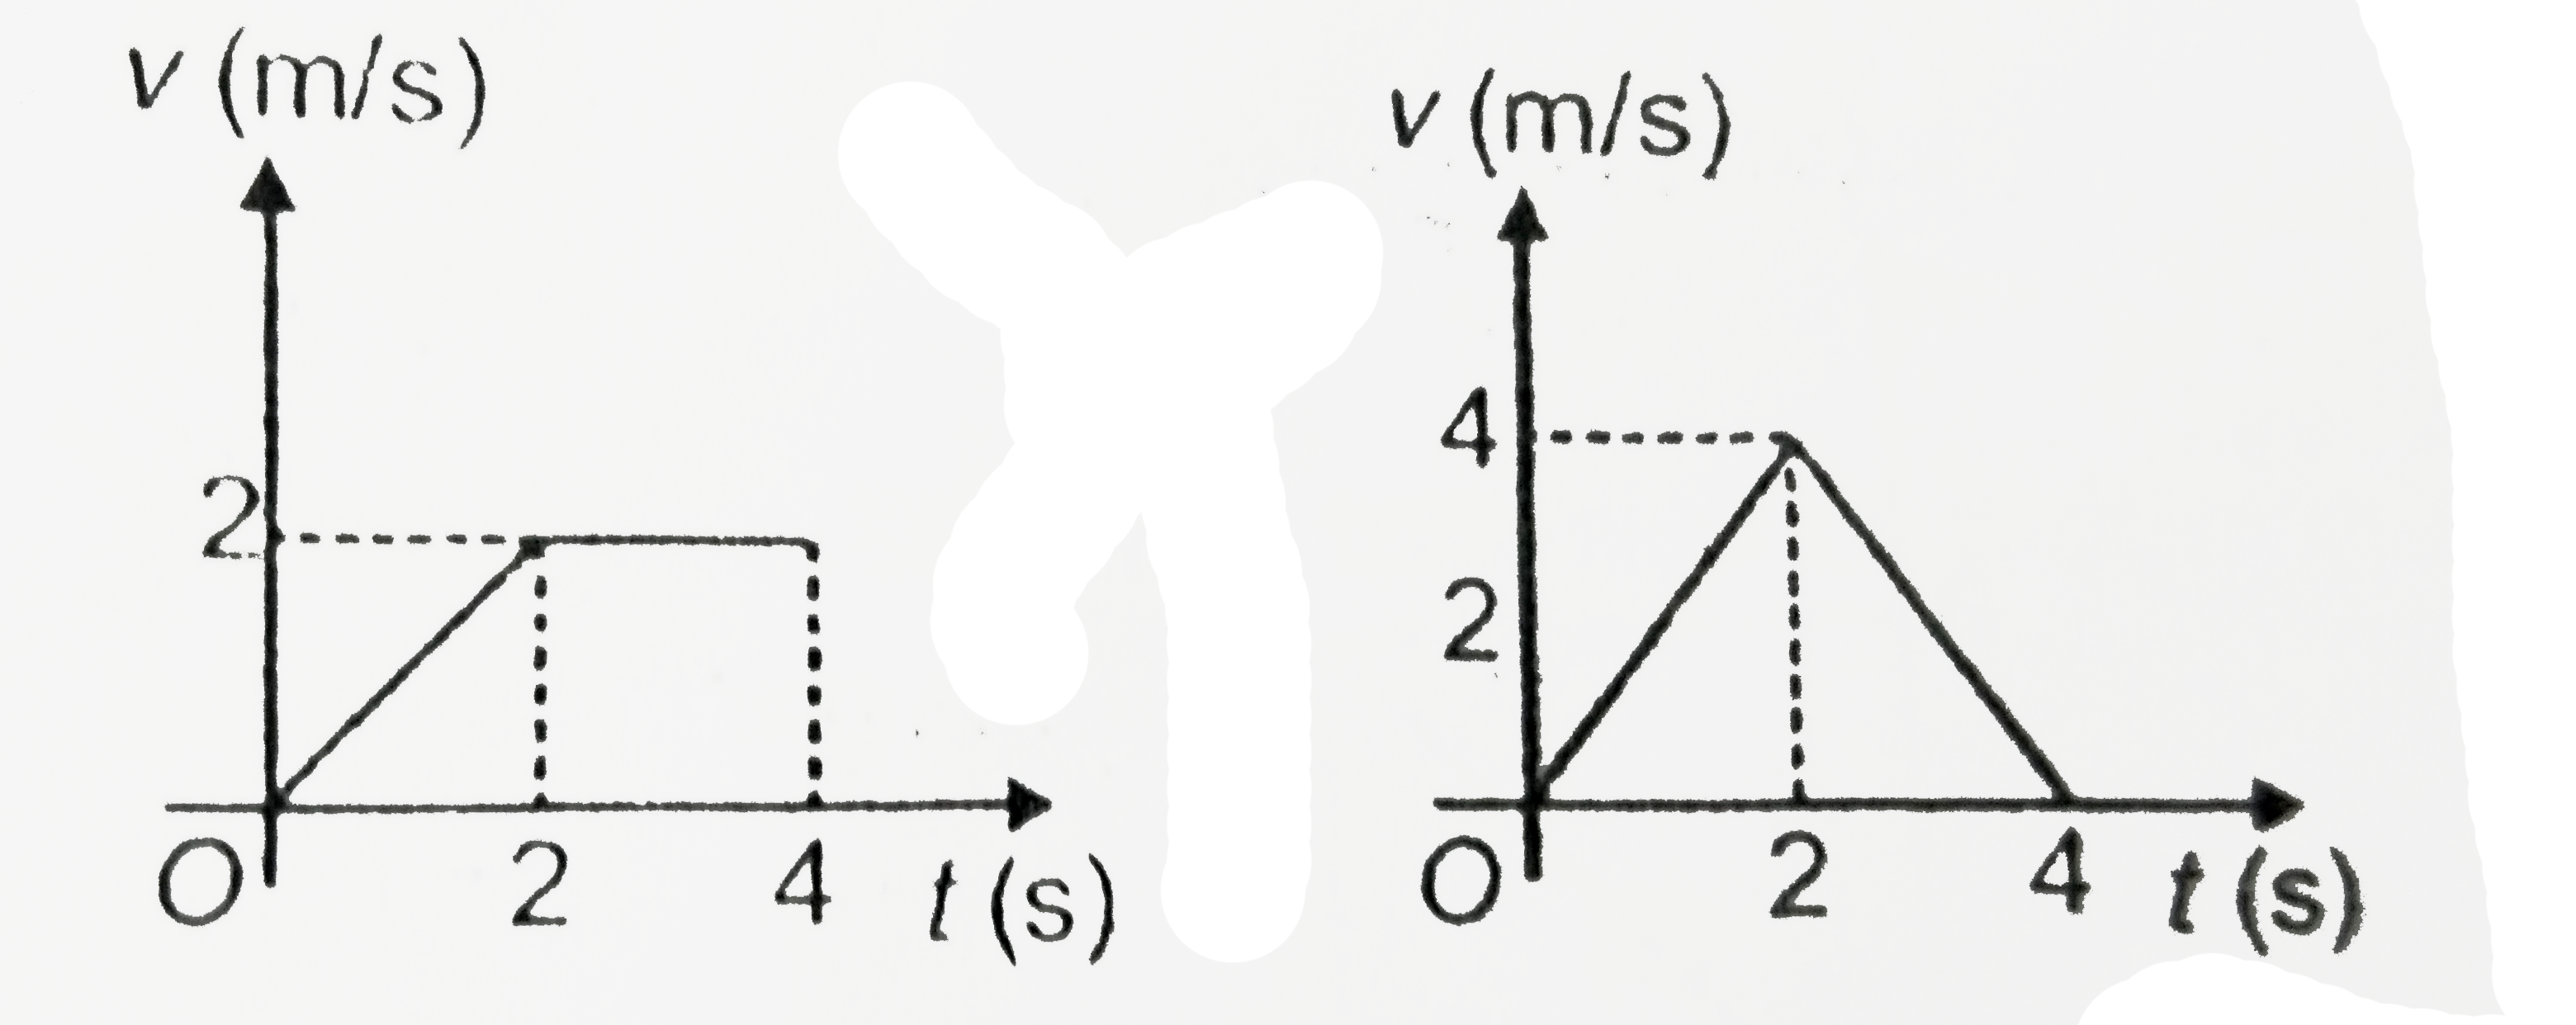
The velocity versus time graph of two particles moving along x-axis varies are shown in the following two plots. Then
 View Solution
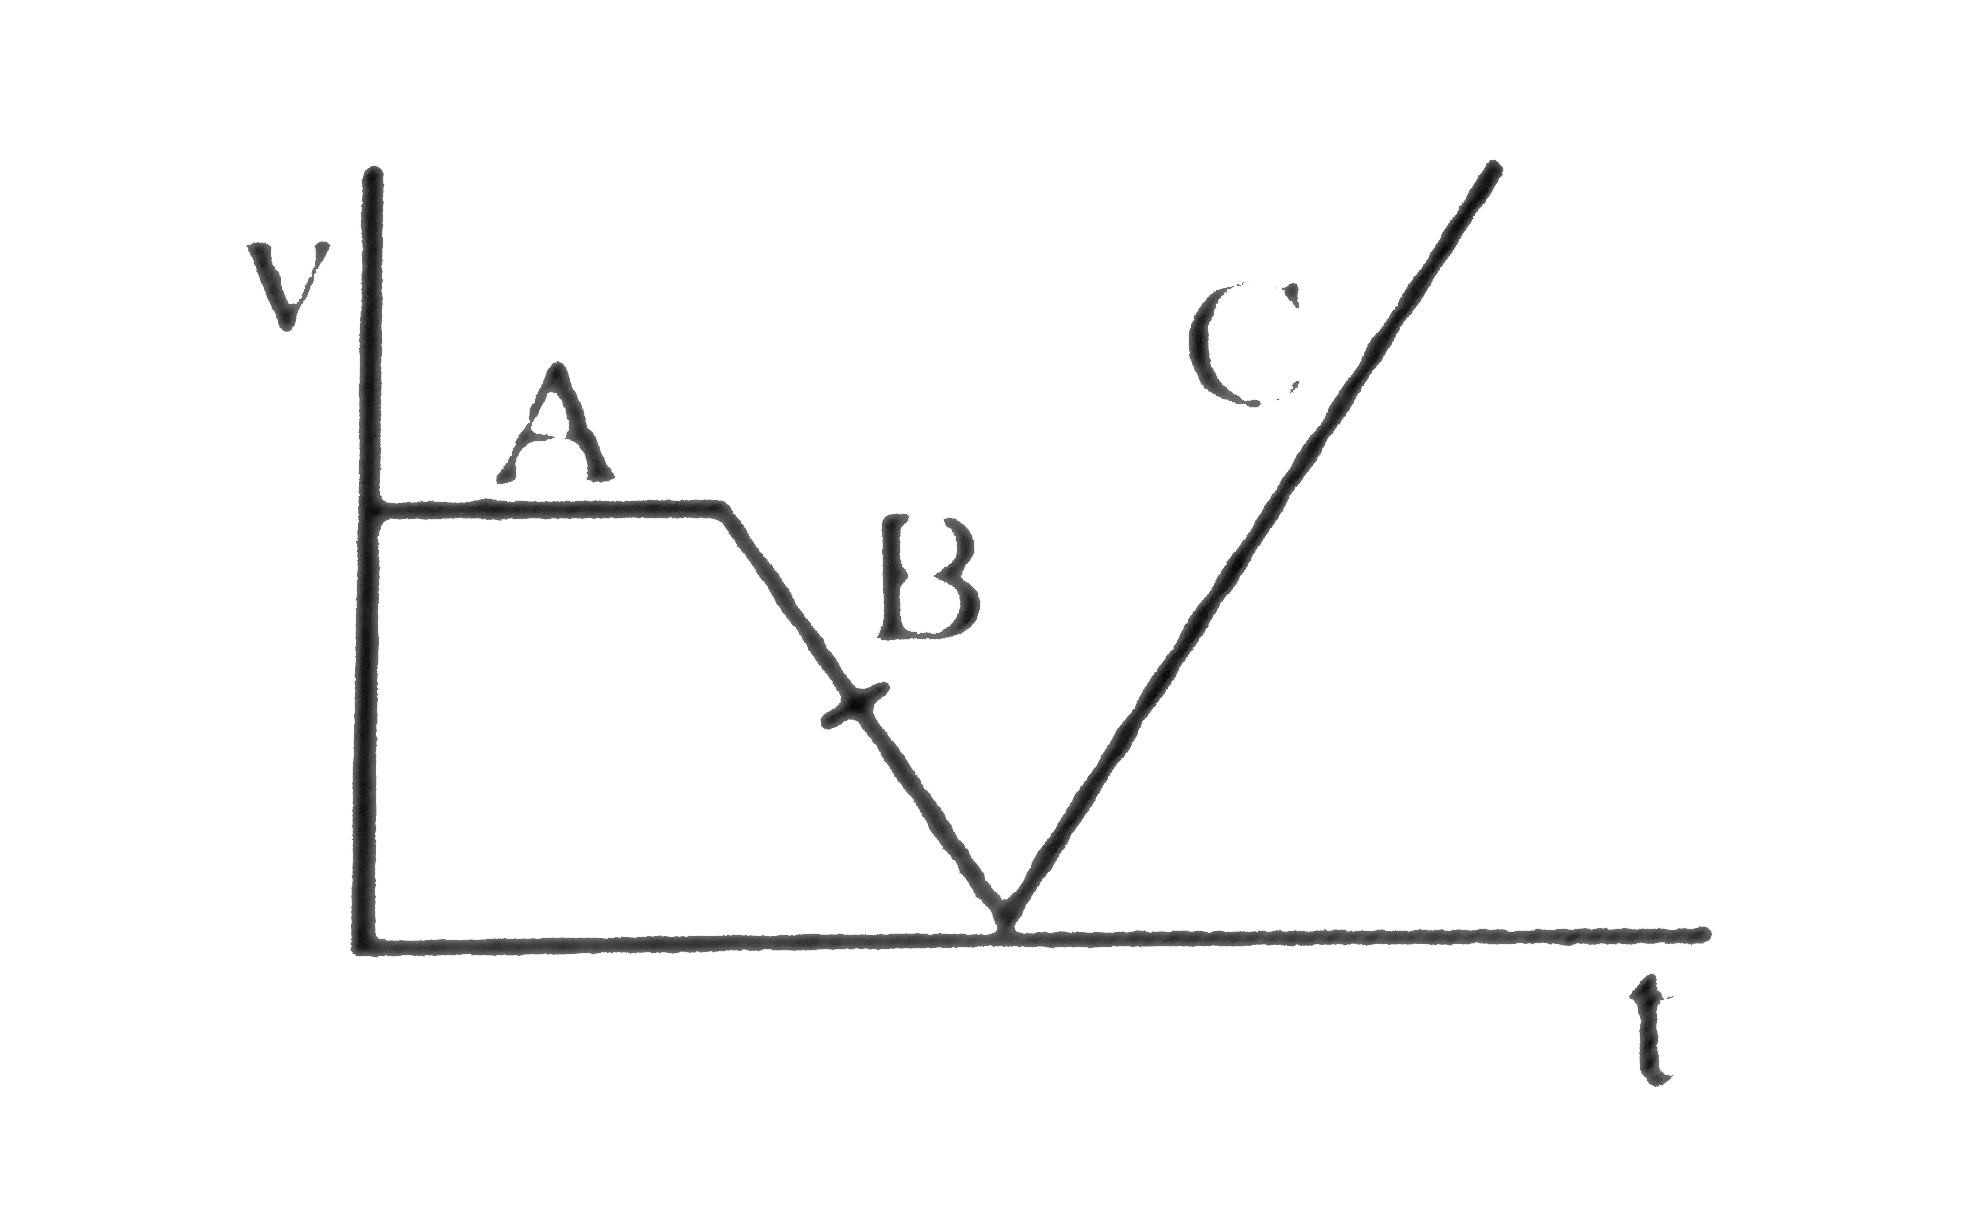
Velocity versus time graph of a body is shown in figure. It explains that
 View Solution
In the V-T graph shown in the figure match the following columns.
 View Solution
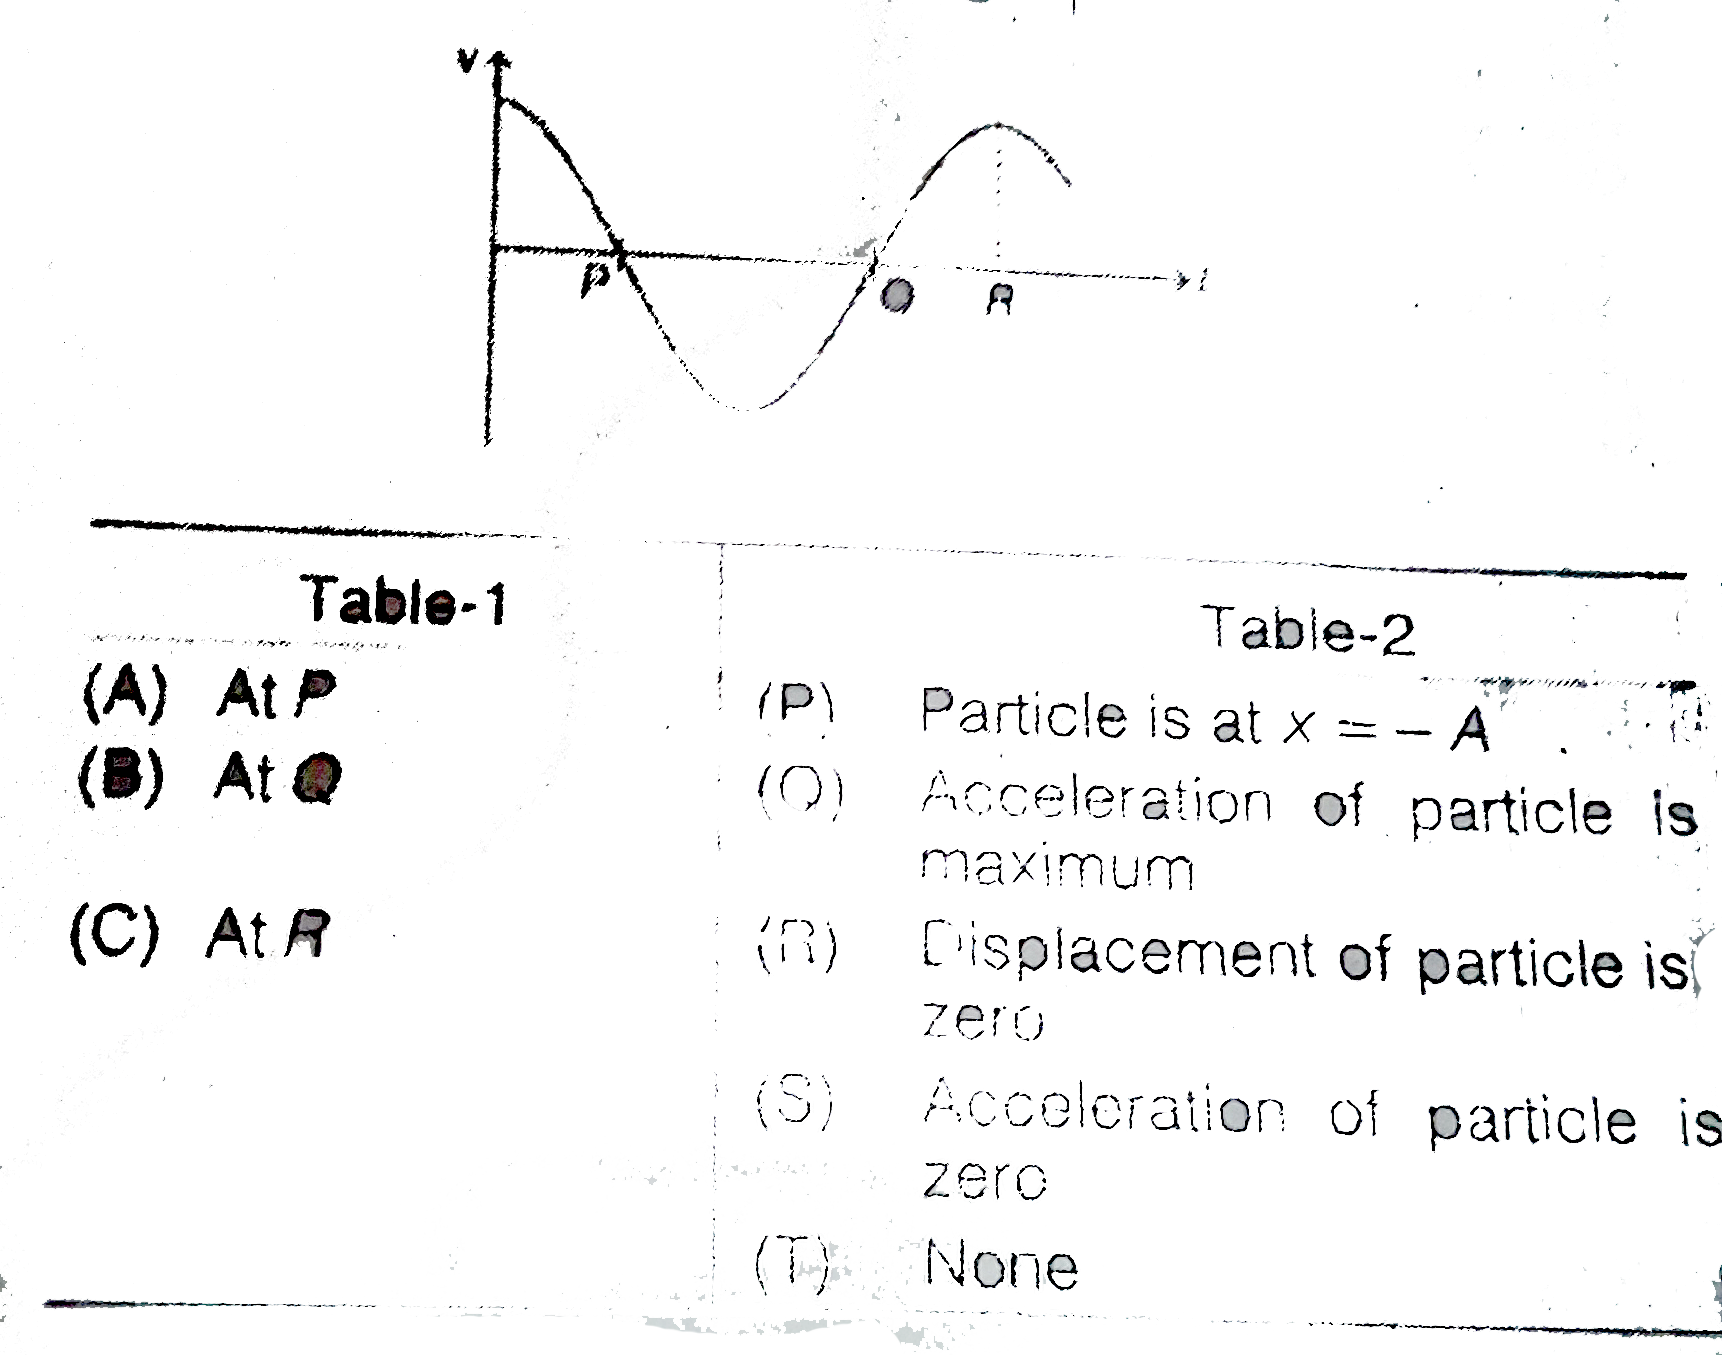
Velocity-time graph of a particle in SHM is as shown in figure. Match the following
 View Solution
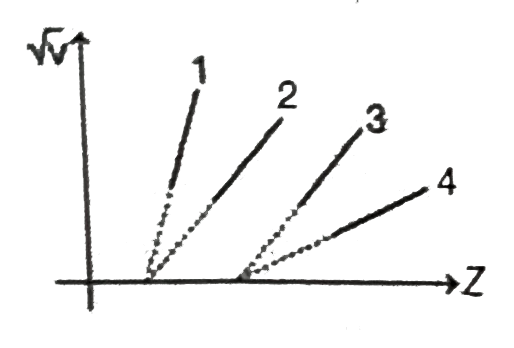
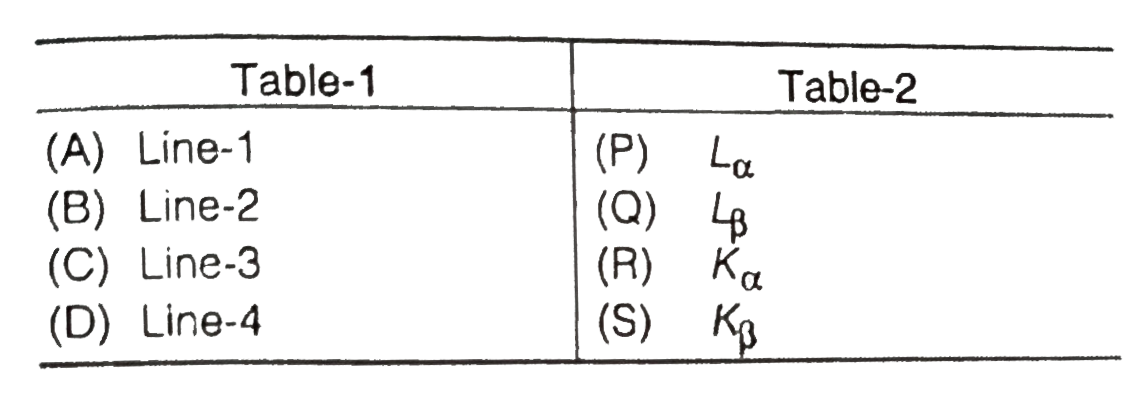
√v versus Z graph for dcharacteristic X-rays is as shown in figure. Mathc the following
 View Solution


