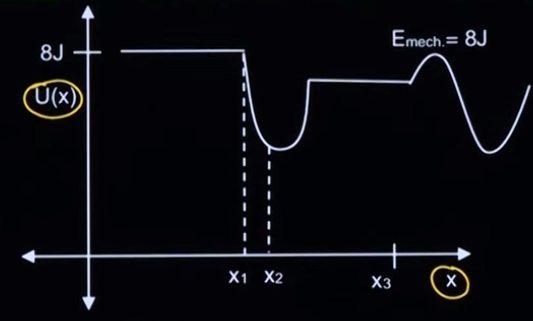
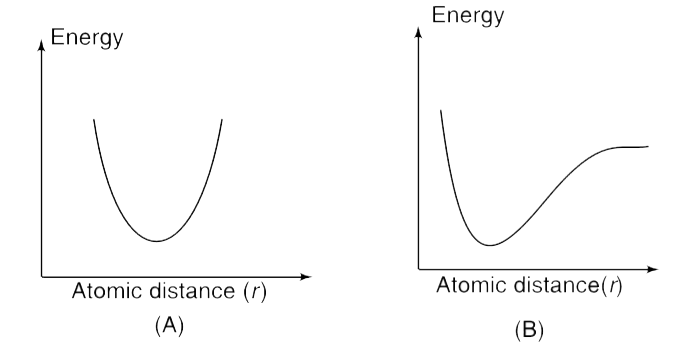
In the given figure graph B shows the variation of potential energy versus atomic separation (r) in a material. Argue qualitatively to show that if the potential energy graph was a symmetrical one as depicted in graph A, there would have been no thermal expansion on heatin
|
Topper's Solved these Questions
Similar Questions
Knowledge Check
The slope of potential energy versus position graph represents
AforceBpowerCmomentumDworkThe following plot shows the variation of potential energy (U) of a system versus position (x). From the graph we can interpret that :
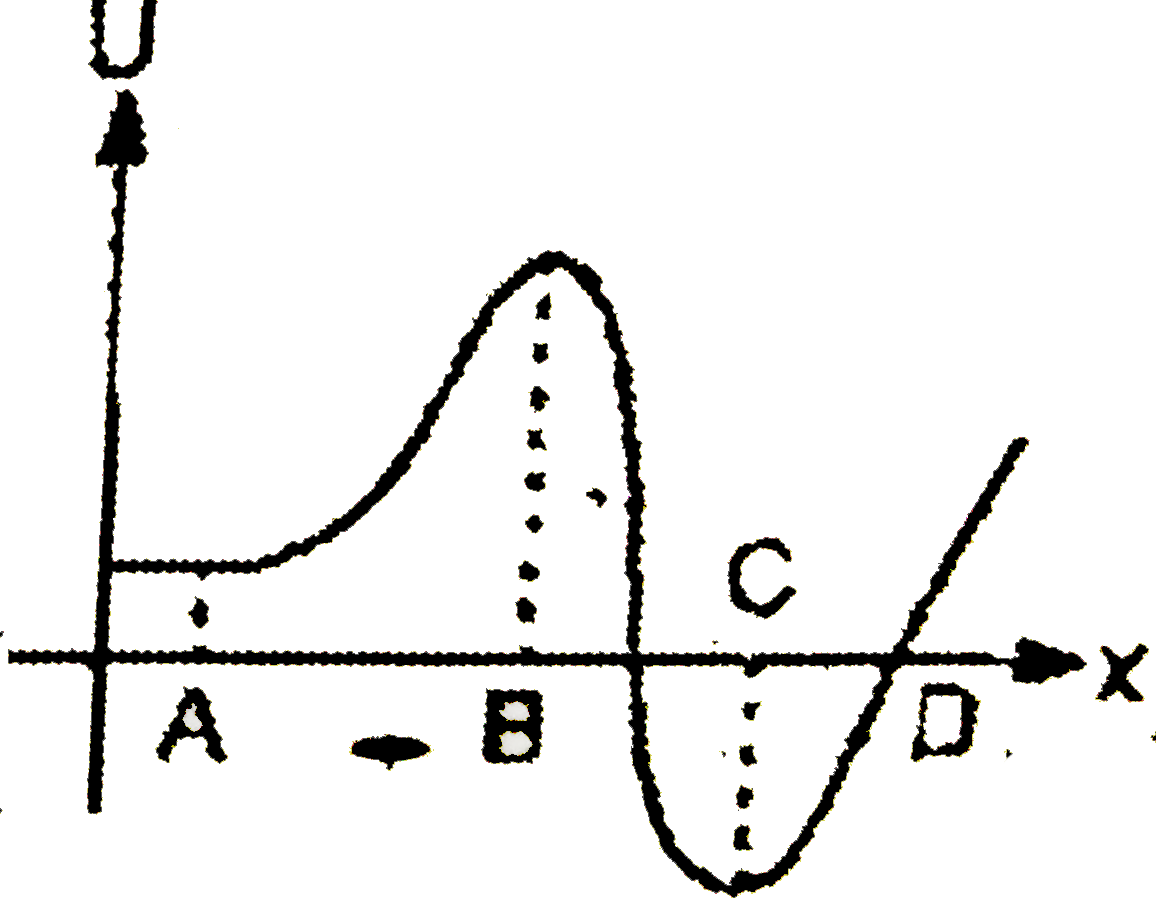 APoint D is position of neutral equilibriumBPoint B is position of unstable equilibriumCPoint C is position of stable equilibriumDPoint A is position of neutral equilibrium
The given plot shows the variation of U, the potential energy of interaction between two particles with the distance separating them r,
 AB and D are equilibrium pointsBC is a point of stable equilibriumCThe force of stable equilibrium between the two particles is attracive between points C and D and repulsive between D and E .DThe force of interaction between particles is repulsive between points E and F.
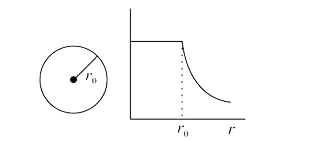
The given graph shows variation (with distance r form center) of :

View SolutionThe given graph shows variation (with distance r from centre) of:
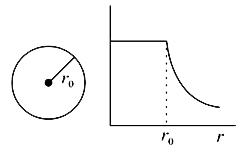
View SolutionThe given graph shows variation (with distance r from centre) of:
View SolutionThe given plot shows the variation of U, the potential energy of interaction between two particles with the distance separating them r,

View SolutionThe given plot shows the variation of U, the potential energy of interaction between two particles with the distance separating them r,

View Solution

