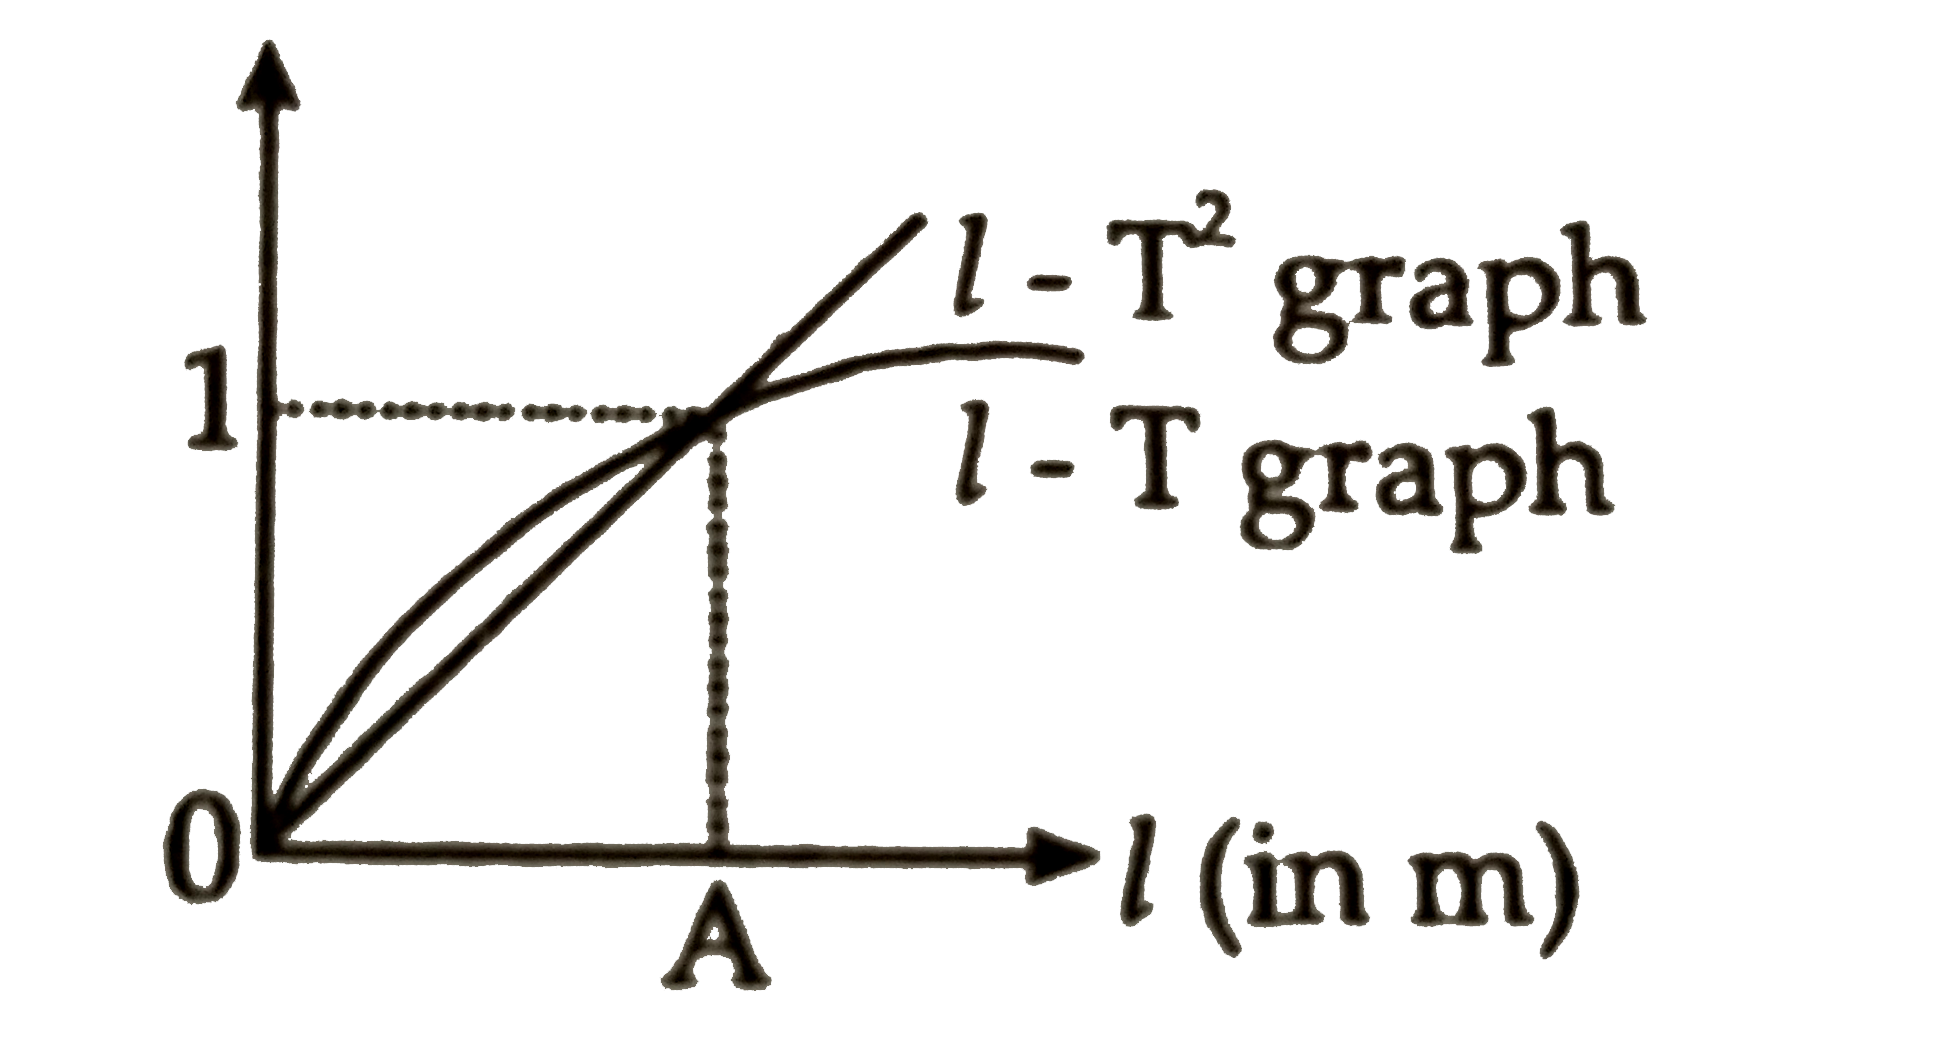
l - T and l−T2 graphs of a simple pendulum on earth are as shown in the figure. The x-coordiante (OA) of point of intersection of the graphs is nearly equal to (on the earth g=9.8ms−2)
A
20 cm
B
25 cm
C
50 cm
D
100 cm
Video Solution
Text Solution
The correct Answer is:B
Slope of l=T2 graph = T2l
But, g=4π2lT2
∴T2l=4π2g
T=T2=1s at the point of intersection
∴1l=4π2g,l=g4π2≈14m=25cm
|
Topper's Solved these Questions
Similar Questions
Knowledge Check
The l−T2 graph of a simple pendulum is an shown in the figure. The time period of the pendulum of length 0.5 mm is
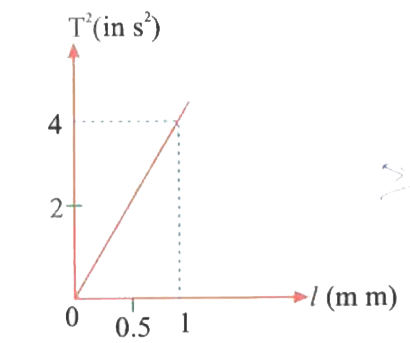 A1sB1.2 sC√2 sD1√2s
The graph of l against T for a simple pendulum is
Aa curveBa straight lineCa parabolaDan ellipseThe x-t graph of a particle undergoing SHM is as shown in figure. The acceleration of the particle at t=2/3 is
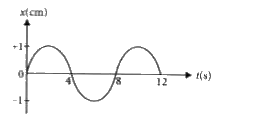 A√332π2cms−2B−π232cms−2Cπ232cms−2D−√332π2cms−2
If the time period of a pendulum is 1sec, then what is the length of the pendulum at point of intersection of l−T and l−T2 graph.
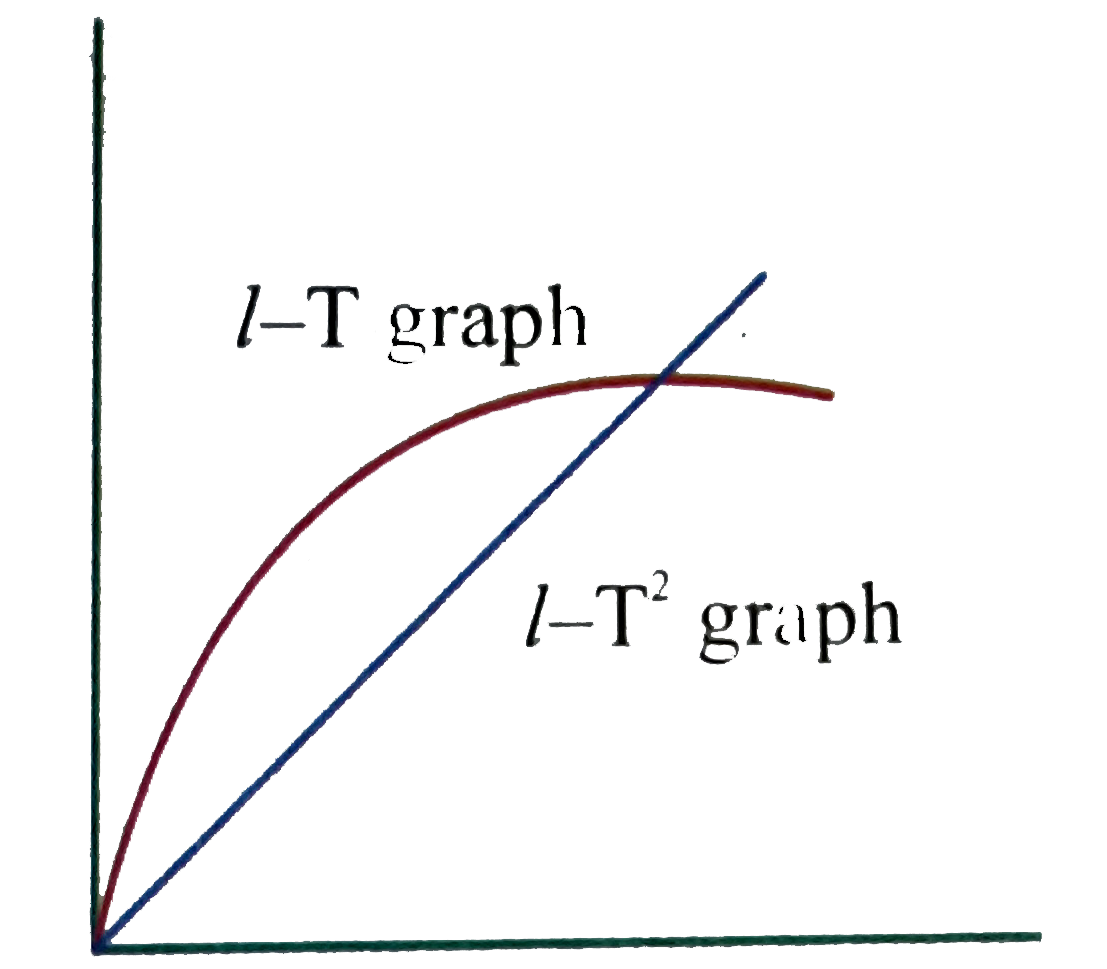
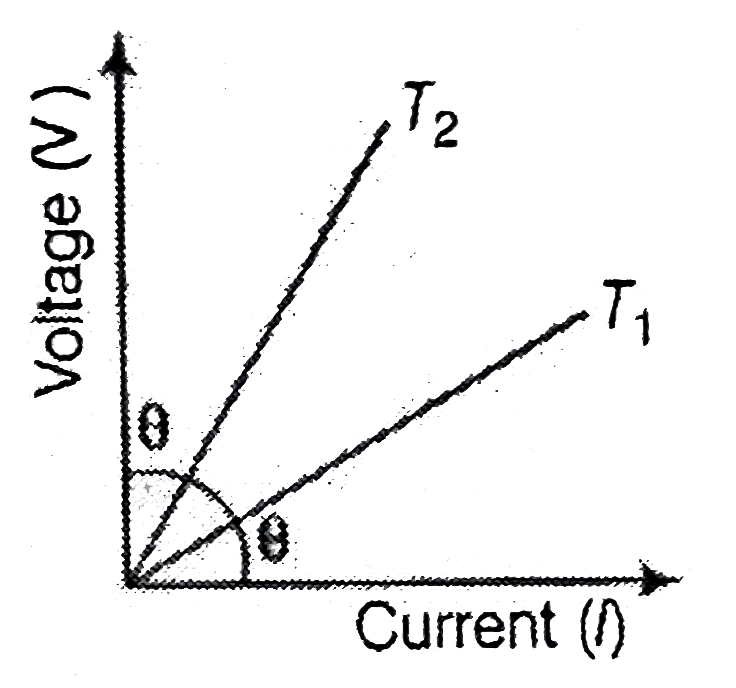
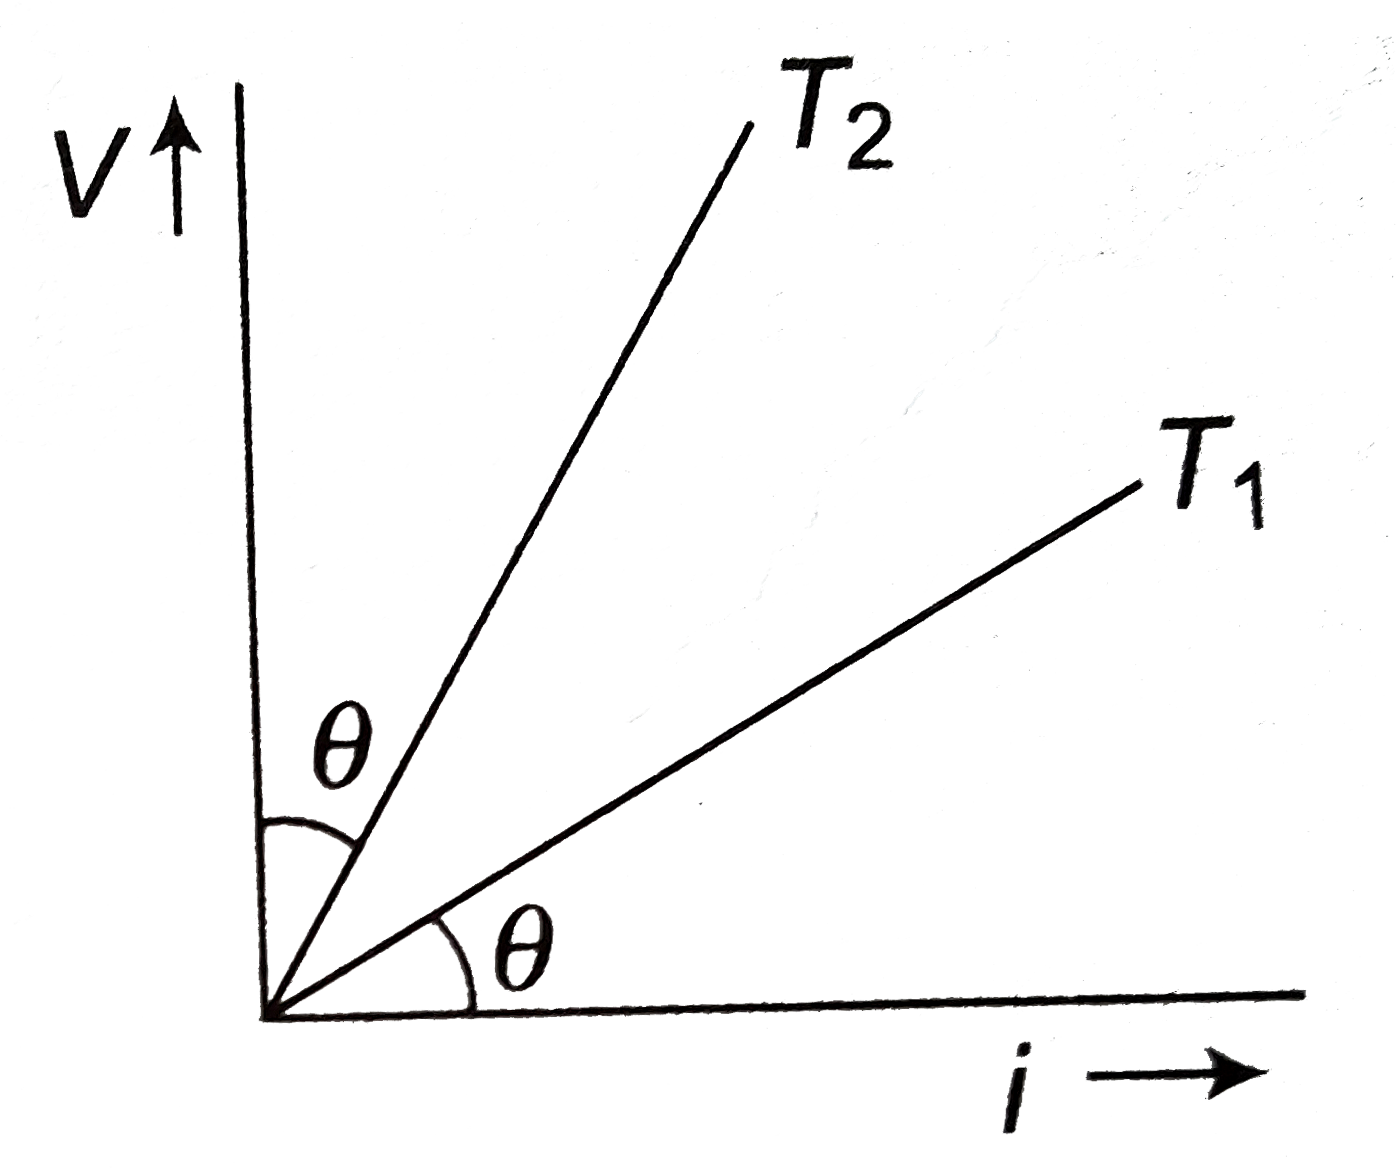
View SolutionThe V-l graph for a conductor at temperatures T1 and T2 are as shown in the figure. The term T2−T1 is proportional to
View SolutionThe x-t graph of a particle moving along a straight line is shown in figure

The v-t graph of the particle is correctly shown by
View SolutionThe x−t graph of particle moving along a straight line is shown in figure
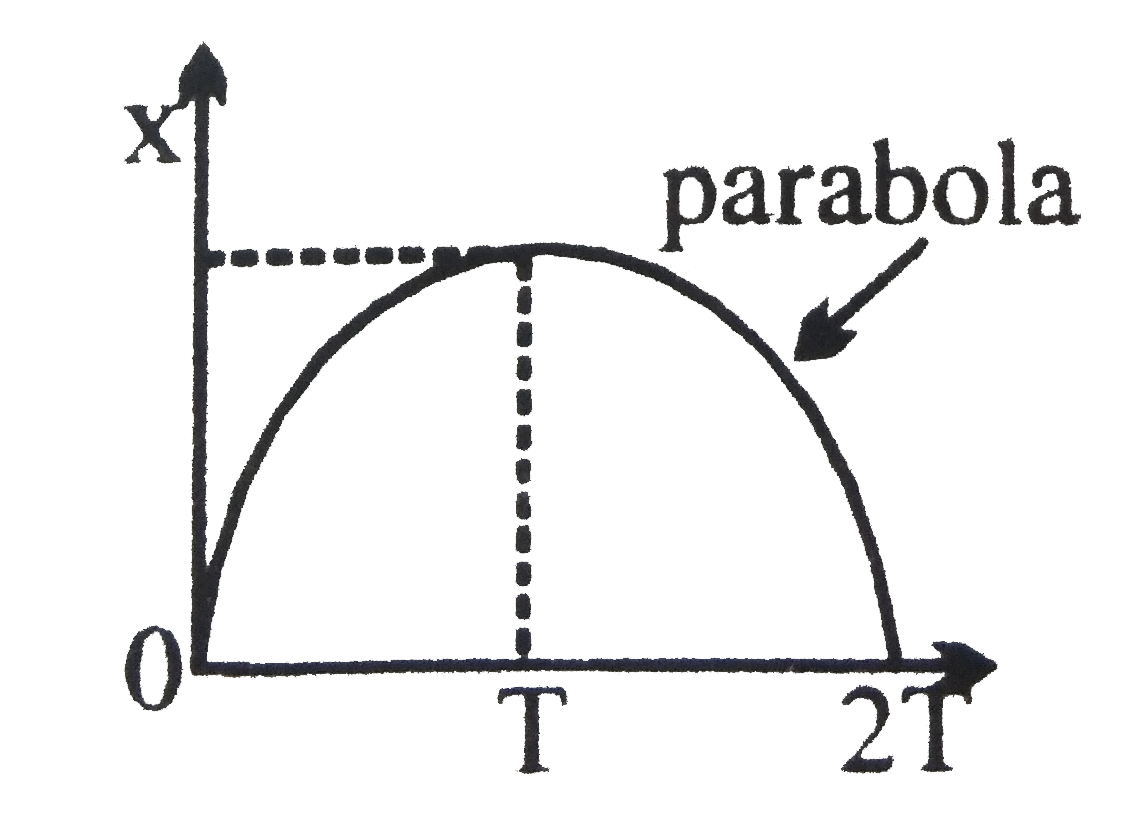
The v−t graph of the particles is correctly shown by
View SolutionThe x−t graph of particle moving along a straight line is shown in figure
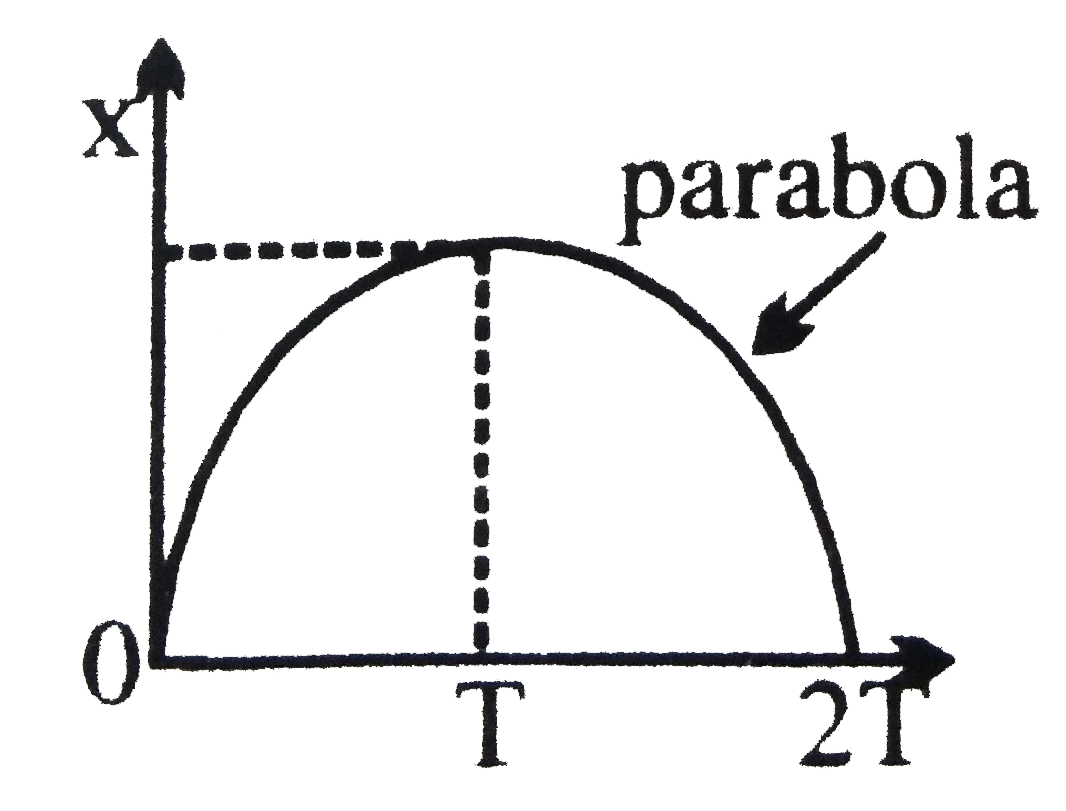
The a−t graph of the particle is correctly shown by
View Solution

 .
.