Liquid oxygen at 50K is heated to 300K at constant pressure of 1atm. The rate of heating is constant. Which of the following graphs represents the variation of temperature with time?
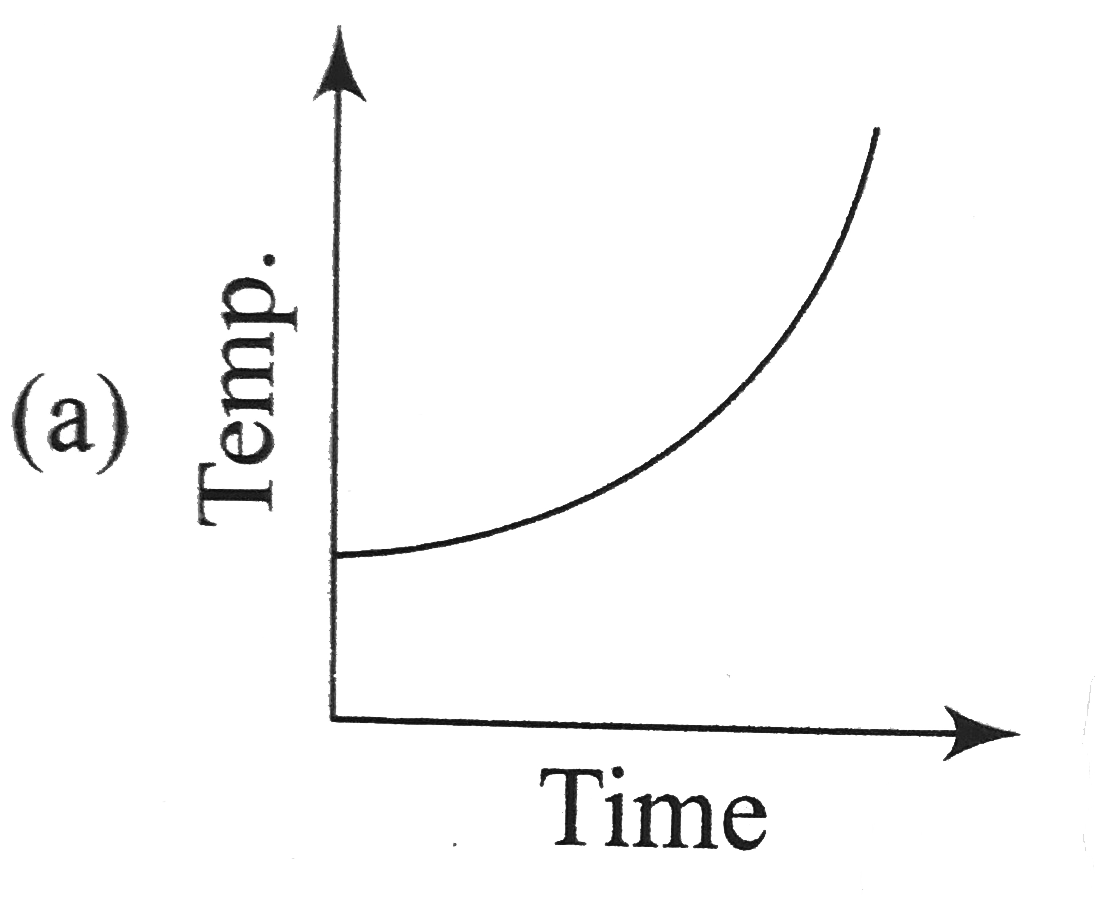
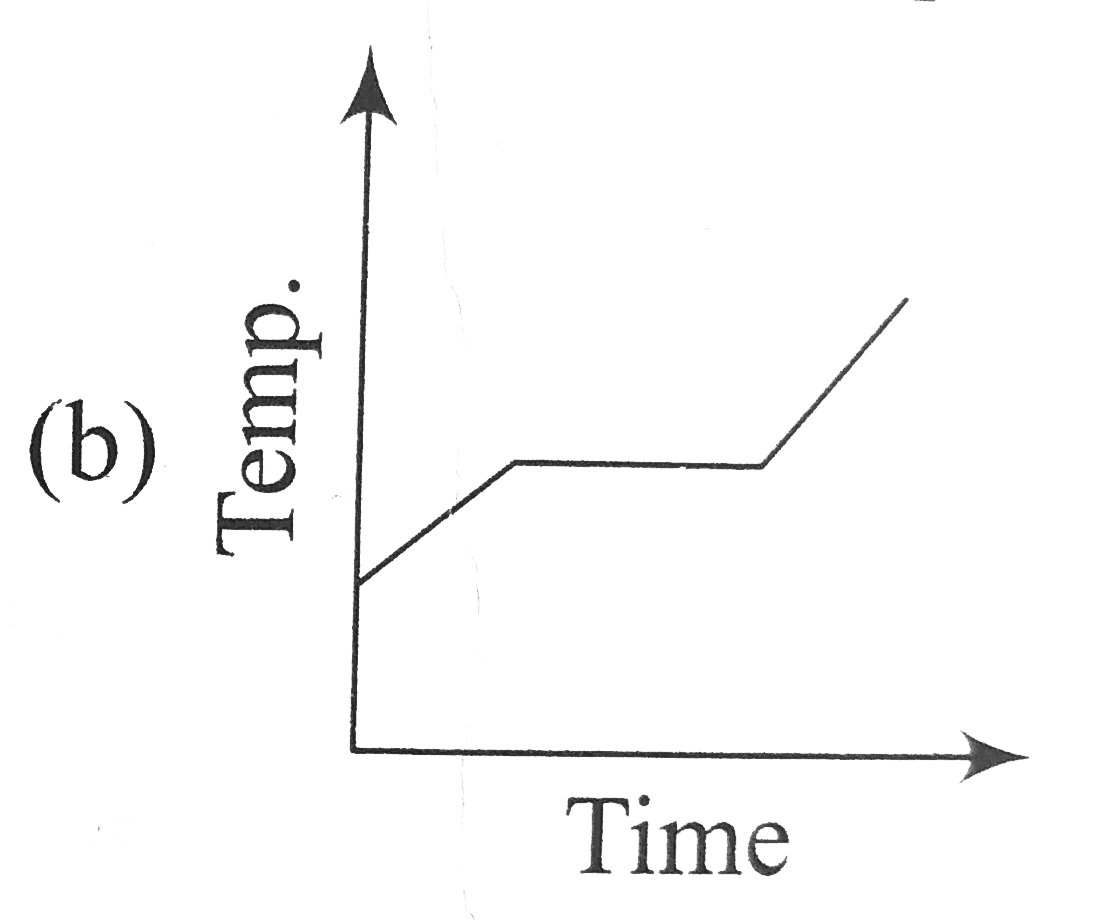
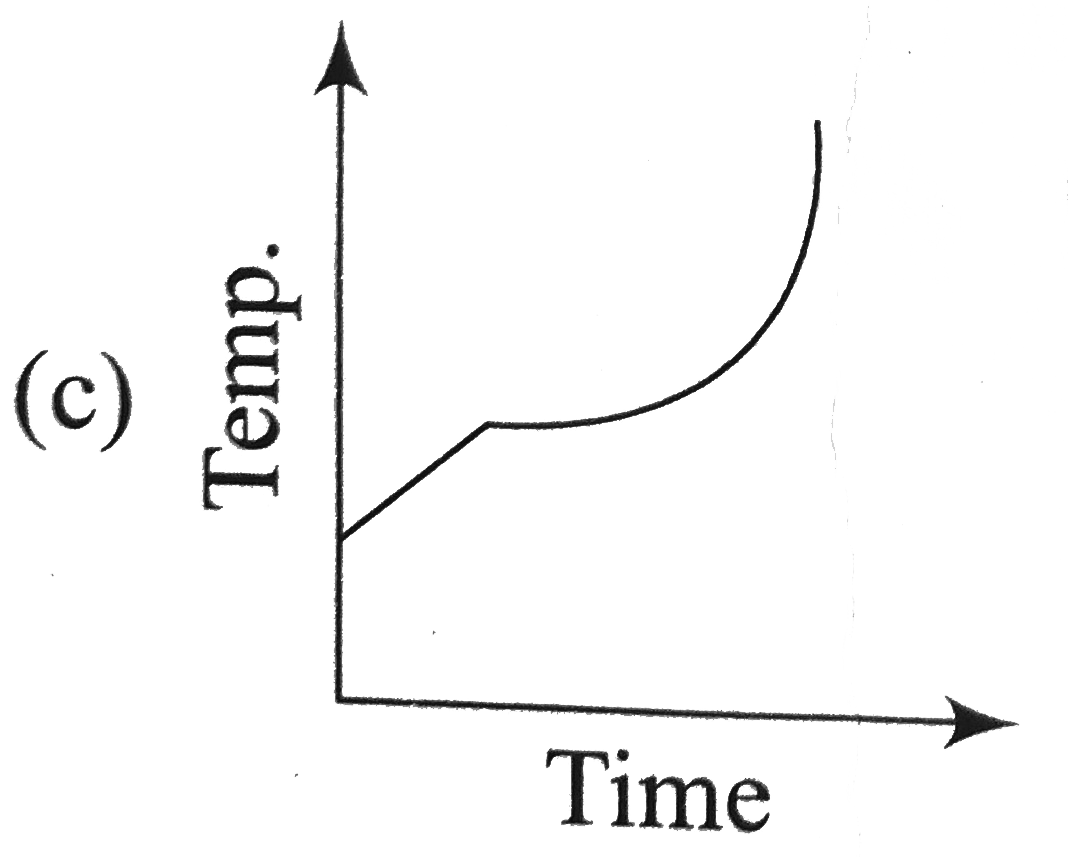
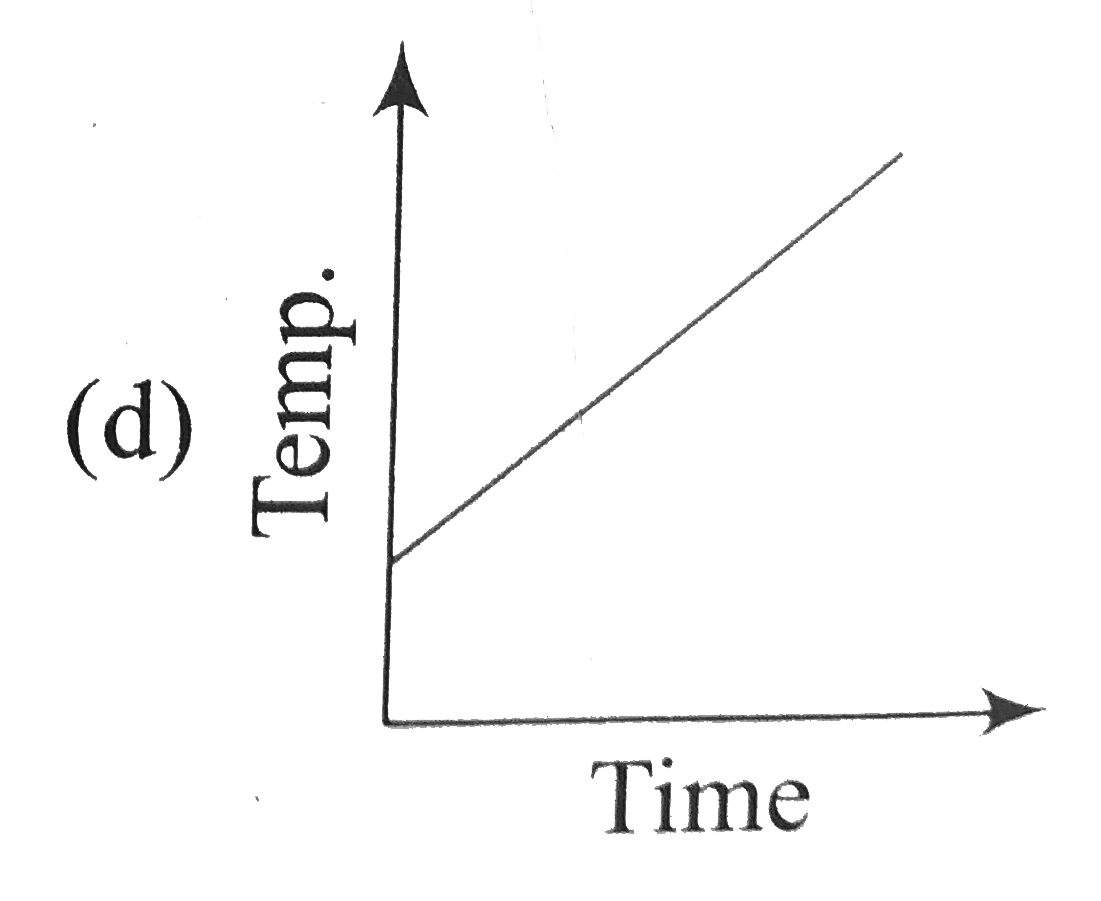
The correct Answer is:B
To solve the problem, we need to analyze the heating process of liquid oxygen as it transitions from a liquid state at 50 K to a gaseous state at 300 K under constant pressure. Here’s a step-by-step breakdown of the process:
Step 1: Understand the Initial Condition
- The liquid oxygen starts at a temperature of 50 K.
Step 2: Heating the Liquid
- As we begin to heat the liquid oxygen, its temperature will rise. The rate of heating is constant, meaning that the temperature will increase linearly with time until it reaches the boiling point of oxygen.
Step 3: Identify the Boiling Point
- The boiling point of oxygen is approximately 90 K. As the temperature approaches this point, the liquid will begin to boil.
Step 4: Phase Change
- During the phase change from liquid to gas (boiling), the temperature remains constant at the boiling point (90 K) until all the liquid has converted to gas. This is because the heat energy added during this phase change is used to overcome the latent heat of vaporization rather than increasing the temperature.
Step 5: Heating the Gas
- Once all the liquid has turned into gas, the temperature of the gaseous oxygen will start to increase again. This increase in temperature will continue until it reaches 300 K.
Step 6: Graphical Representation
- The graph representing the temperature vs. time will show a linear increase in temperature from 50 K to 90 K, followed by a horizontal line (constant temperature) at 90 K during the boiling phase, and finally another linear increase from 90 K to 300 K.
Conclusion
- The correct graph will show an initial linear increase, a plateau at the boiling point, and then another linear increase.
- The liquid oxygen starts at a temperature of 50 K.
- As we begin to heat the liquid oxygen, its temperature will rise. The rate of heating is constant, meaning that the temperature will increase linearly with time until it reaches the boiling point of oxygen.
- The boiling point of oxygen is approximately 90 K. As the temperature approaches this point, the liquid will begin to boil.
- During the phase change from liquid to gas (boiling), the temperature remains constant at the boiling point (90 K) until all the liquid has converted to gas. This is because the heat energy added during this phase change is used to overcome the latent heat of vaporization rather than increasing the temperature.
- Once all the liquid has turned into gas, the temperature of the gaseous oxygen will start to increase again. This increase in temperature will continue until it reaches 300 K.
- The graph representing the temperature vs. time will show a linear increase in temperature from 50 K to 90 K, followed by a horizontal line (constant temperature) at 90 K during the boiling phase, and finally another linear increase from 90 K to 300 K.
- The correct graph will show an initial linear increase, a plateau at the boiling point, and then another linear increase.
Topper's Solved these Questions
- THERMAL PROPERTIES OF MATTERBOOK - A2ZCHAPTER - THERMAL PROPERTIES OF MATTEREXERCISE - AIIMS Questions
28 Videos
- THERMAL PROPERTIES OF MATTERBOOK - A2ZCHAPTER - THERMAL PROPERTIES OF MATTEREXERCISE - Chapter Test
30 Videos
- THERMAL PROPERTIES OF MATTERBOOK - A2ZCHAPTER - THERMAL PROPERTIES OF MATTEREXERCISE - Assertion Reasoning
21 Videos
- ROTATIONAL DYNAMICSBOOK - A2ZCHAPTER - ROTATIONAL DYNAMICSEXERCISE - Chapter Test
29 Videos
- UNIT, DIMENSION AND ERROR ANALYSISBOOK - A2ZCHAPTER - UNIT, DIMENSION AND ERROR ANALYSISEXERCISE - Chapter Test
28 Videos
Similar Questions
Which one of the following given graphs represents the variation of rate constant (k) with temperature (f) for an endothermic reaction ?
View SolutionWhich one of the following given graphs represents the variation of rate constant (k) with temperature (t) for an endothermic reaction ?
View Solution
Knowledge Check
Liquid oxygen at 50K is heated to 300K at constant pressure of 1atm. The rate of heating is constant. Which of the following graphs represents the variation of temperature with time?
A B
B C
C D
D
Arrhenius equation is :
k=Ae−E/RT
Which of the following graphs represents the variation of rate constant k against temperatureT ?A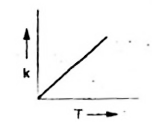 B
B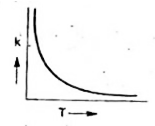 C
C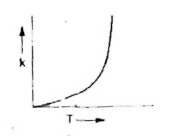 D
D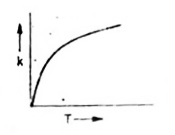
Arrehnius equation is :
k=Ae−Ea/RT
Which of the following graphs represents the variation of rate constant k against temerature T?A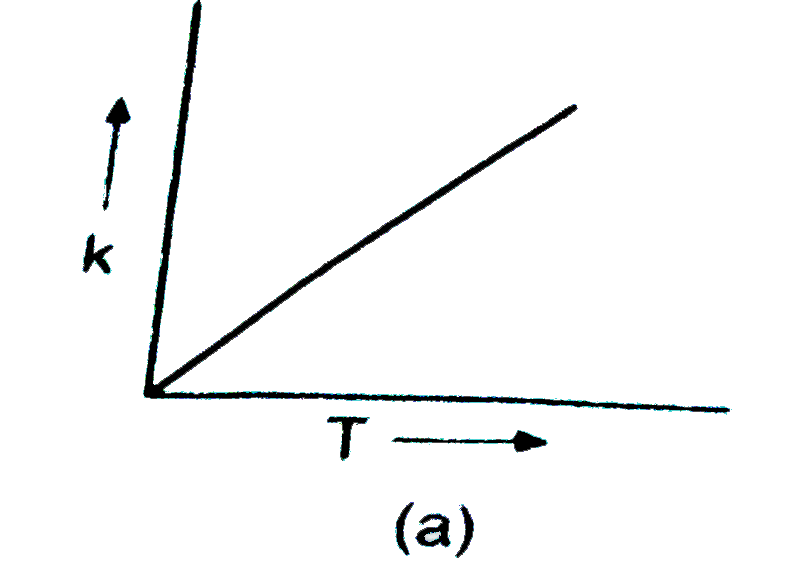 B
B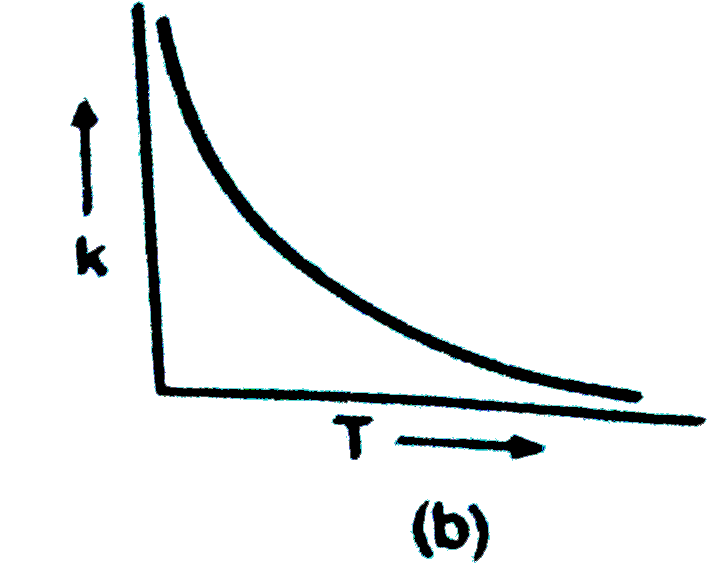 C
C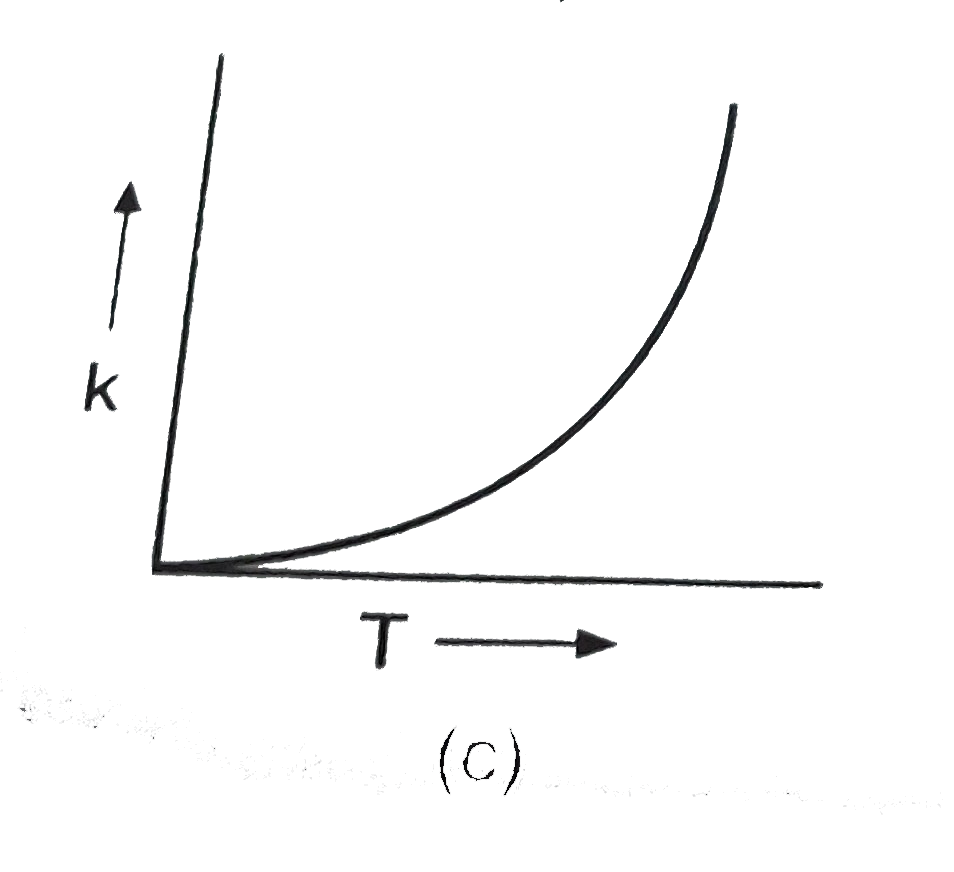 D
D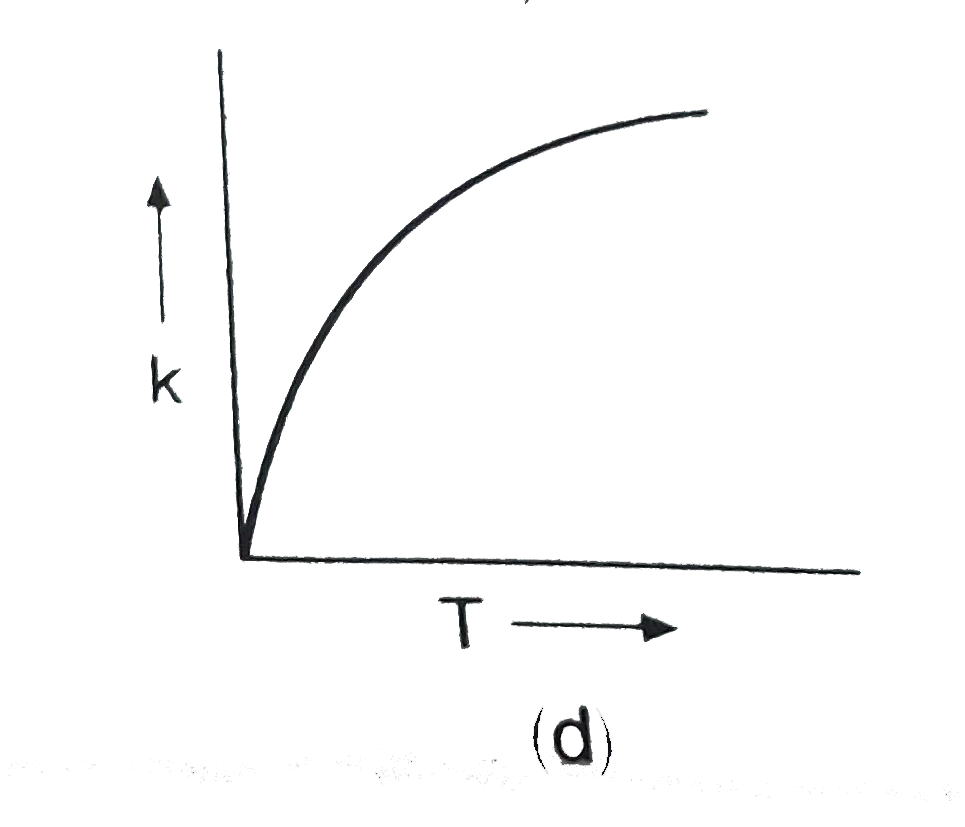
Which one of the following graphs represents variation of specific heat capacity of water with temperature?
View SolutionIf heat energy is given to an ideal gas at constant pressure, then select the graph which best represents the variation of VT with temperature (T).
View SolutionAt a constant pressure, of the following graphs that one which represents the variation of the density of an ideal gas with the absolute temperature T, is
View SolutionAccording to Arrheneius equation rate constant k is equal to Ae−Ea/RT. Which of the following options represents the graph of ln k vs 1T?
View SolutionOne mole of an ideal gas requires 207 J heat to raise the temperature by 10K When heated at constant pressure. If the same gas is heated at constant volume to raise the temperature by 5K, then the heat required is
View Solution
