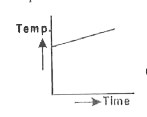
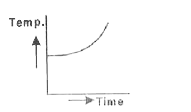
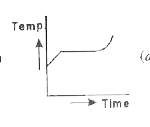
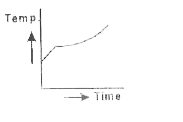
Liquid oxygen at 50 K is heated to 300 K at constant pressure of 1 atm. The rate of heating is constant. Which of the following graphs represents the variation of temperature with time ?


The correct Answer is:B
Topper's Solved these Questions
- HEAT AND THERMODYNAMICSBOOK - MODERN PUBLICATIONCHAPTER - HEAT AND THERMODYNAMICSEXERCISE - Multiple Choice Questions (Level - III) (Questions From AIEEE/JEE Examination)
17 Videos
- HEAT AND THERMODYNAMICSBOOK - MODERN PUBLICATIONCHAPTER - HEAT AND THERMODYNAMICSEXERCISE - Recent Competitve Questions
17 Videos
- HEAT AND THERMODYNAMICSBOOK - MODERN PUBLICATIONCHAPTER - HEAT AND THERMODYNAMICSEXERCISE - Recent Competitve Questions
17 Videos
- GRAVITATIONBOOK - MODERN PUBLICATIONCHAPTER - GRAVITATIONEXERCISE - Recent Competitive Questions
8 Videos
- LAWS OF MOTIONBOOK - MODERN PUBLICATIONCHAPTER - LAWS OF MOTIONEXERCISE - Revision test
43 Videos
Similar Questions
A thermally insulated vessel contains an ideal gas of molecular mass M and ratio of specific heats γ. It is moving with speed v and it is suddenly brought to rest. Assuming no heat is lost to the surroundings, its temperature increases by:
View SolutionThe temperature of a gas contained in a closed vessel of constant volume increases by 1∘C when the pressure of the gas is increased by 1%. The initial temperature of the gas is:
View SolutionThe temperature of a gas contained in a closed vessel of constant volume increases by 1∘C when the pressure of the gas is increased by 1%. The initial temperature of the gas is:
View SolutionAn astronaut on a strange planet finds that acceleration due to gravity is twice as that on the surface of earth. Which of the following could explain thin ?
View SolutionWhen a carpet is beaten with a stick, dust comes out of it. Explain.
View SolutionIf liquefied oxygen at 1 atmospheric pressure is heated from 50K to 300k by supplying heat at constant rate. The graph of temperature vs time will be
View SolutionLiquid oxygen at 50K is heated to 300K at constant pressure of 1atm. The rate of heating is constant. Which of the following graphs represents the variation of temperature with time?
View Solution50 K ताप पर द्रव ऑक्सीजन को 300 K तक एक वायुमंडलीय स्थिर दाब पर गर्म किया जाता है | यदि गर्म करने की दर स्थिर हो , तो निम्न में से कौन - सा ग्राफ समय के साथ ताप परिवर्तन प्रदर्शित करता है -
View Solution1 वायुमण्डल के स्थिर दाब पर द्रव्य ऑक्सीजन (Liquid oxygen) का ताप 50 केल्विन से बढ़ाकर 300 केल्विन कर दिया जाता है | ऊष्मा की दर नियत है | निम्न में से कौन - सा वक्र ताप का समय के साथ सही परिवर्तन दर्शाता है ?
View SolutionLiquid oxygen at 50K is heated to 300K at constant pressure of 1atm. The rate of heating is constant. Which of the following graphs represents the variation of temperature with time?
View SolutionIf liquefied oxygen at 1 atmospheric pressure is heated from 50K to 300k by supplying heat at constant rate. The graph of temperature vs time will be
View SolutionLiquid oxygen at 50 K is heated to 300 K at constant pressure of 1 atm. The rate of heating is constant. Which of the following graphs represent the variation of temperature with time ?
View SolutionLiquid oxygen at 50 K is heated to 300 K at constant pressure of 1 atm. The rate of heating is constant. Which of the following graphs represent the variation of temperature with time?
View SolutionLiquid oxygen at 50K is heated to 300K at constant pressure of 1atm. The rate of heating is constant. Which of the following graphs represents the variation of temperature with time?
View SolutionLiquid oxygen at 50 K is heated to 300 K at constant pressure of 1 atm. The rate of heatingis constant. Which of the following graph represent the variation of temperature with time ?
View Solution
