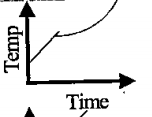
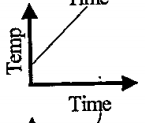
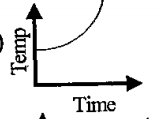
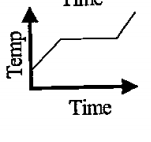
Liquid oxygen at 50K is heated to 300 K at constant pressure of 1 atm . The rate of heating is constant. Which one of the following graphs represents the varitation of temperature with time ?Solution in Tamil


Step by step video & image solution for Liquid oxygen at 50K is heated to 300 K at constant pressure of 1 atm . The rate of heating is constant. Which one of the following graphs represents the varitation of temperature with time ? by Physics experts to help you in doubts & scoring excellent marks in Class 11 exams.
Updated on:21/07/2023Topper's Solved these Questions
Similar Questions
Two satellites of earth, S1 andS2 aremoving inthe same orbit.The mass of S1 is four times the mass of S2. Which oneofthe following statements s true?
View SolutionAssuming the sun to have a spherical outer surface of radiating like a black body at temperature t∘C, the power received by a unit surface,(normal to the incident rays) at a distance R from the centre of the sun is
View SolutionIf liquefied oxygen at 1 atmospheric pressure is heated from 50K to 300k by supplying heat at constant rate. The graph of temperature vs time will be
View SolutionLiquid oxygen at 50K is heated to 300K at constant pressure of 1atm. The rate of heating is constant. Which of the following graphs represents the variation of temperature with time?
View Solution50 K ताप पर द्रव ऑक्सीजन को 300 K तक एक वायुमंडलीय स्थिर दाब पर गर्म किया जाता है | यदि गर्म करने की दर स्थिर हो , तो निम्न में से कौन - सा ग्राफ समय के साथ ताप परिवर्तन प्रदर्शित करता है -
View Solution1 वायुमण्डल के स्थिर दाब पर द्रव्य ऑक्सीजन (Liquid oxygen) का ताप 50 केल्विन से बढ़ाकर 300 केल्विन कर दिया जाता है | ऊष्मा की दर नियत है | निम्न में से कौन - सा वक्र ताप का समय के साथ सही परिवर्तन दर्शाता है ?
View SolutionLiquid oxygen at 50K is heated to 300K at constant pressure of 1atm. The rate of heating is constant. Which of the following graphs represents the variation of temperature with time?
View SolutionLiquid oxygen at 50 K is heated to 300 K at constant pressure of 1 atm. The rate of heating is constant. Which of the following graphs represents the variation of temperature with time ?
View SolutionIf liquefied oxygen at 1 atmospheric pressure is heated from 50K to 300k by supplying heat at constant rate. The graph of temperature vs time will be
View SolutionLiquid oxygen at 50 K is heated to 300 K at constant pressure of 1 atm. The rate of heating is constant. Which of the following graphs represent the variation of temperature with time ?
View SolutionFive kilomoles of oxygen is heated at constant pressure. The temperature of the oxygen gas is increased from 295K to 305K. If the molar heat capacity of oxygen at constant pressure is 6.994 kcal/kmole K. The amount of heat absorbed is in kcal,
View SolutionLiquid oxygen at 50 K is heated to 300 K at constant pressure of 1 atm. The rate of heating is constant. Which of the following graphs represent the variation of temperature with time?
View SolutionFive kilomoles of oxygen is heated at constant pressure. The temperature of the oxygen gas is increased from 295K to 305K. If the molar heat capacity of oxygen at constant pressure is 6.994 kcal/kmole K. The amount of heat absorbed is in kcal,
View SolutionLiquid oxygen at 50K is heated to 300K at constant pressure of 1atm. The rate of heating is constant. Which of the following graphs represents the variation of temperature with time?
View SolutionLiquid oxygen at 50 K is heated to 300 K at constant pressure of 1 atm. The rate of heatingis constant. Which of the following graph represent the variation of temperature with time ?
View SolutionIf liquefied oxygen at 1 atmospheric pressure is heated from 50K to 300k by supplying heat at constant rate. The graph of temperature vs time will be
View Solution
