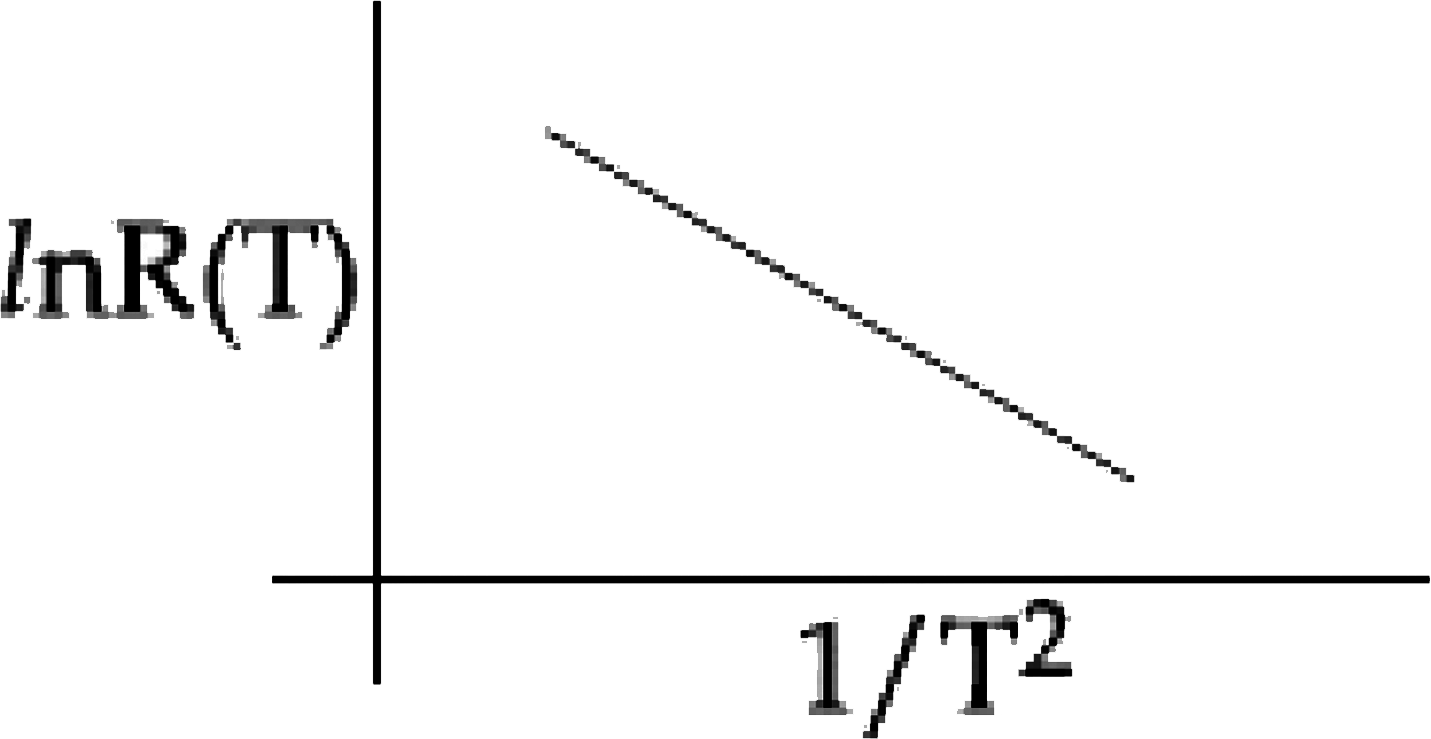
In an experiment, the resistance of a material is plotted as a function of temperature (in some range).As shown in the figure, it is a straight line.
One may conclude that :
R(T)=R0e−T2/T20
R(T)=R0T2
R(T)=R0e−T20T2
R(T)=R0eT2/T20
In R varies linearly with 1T2
So, IN R=−M(1T2)+C[m>0,c>0] Using Y=−mx+c,R=e0−mT2=ec.e−mT2
Or R=R0e−m/T2 type of form will do good
Topper's Solved these Questions
- DC CIRCUITBOOK - VMC MODULES ENGLISHCHAPTER - DC CIRCUITEXERCISE - JEE ADVANCED ARCHIVE
68 Videos
- DC CIRCUITBOOK - VMC MODULES ENGLISHCHAPTER - DC CIRCUITEXERCISE - LEVEL-2 DAILY TUTORIAL SHEET-5
10 Videos
- CURRENT ELECTRICITYBOOK - VMC MODULES ENGLISHCHAPTER - CURRENT ELECTRICITYEXERCISE - IN-CHAPTER EXERCISE-F
10 Videos
- DYNAMICS OF A PARTICLEBOOK - VMC MODULES ENGLISHCHAPTER - DYNAMICS OF A PARTICLEEXERCISE - JEE Advance (Archive) Level - II (SINGLE OPTION CORRECT TYPE )
31 Videos
Similar Questions
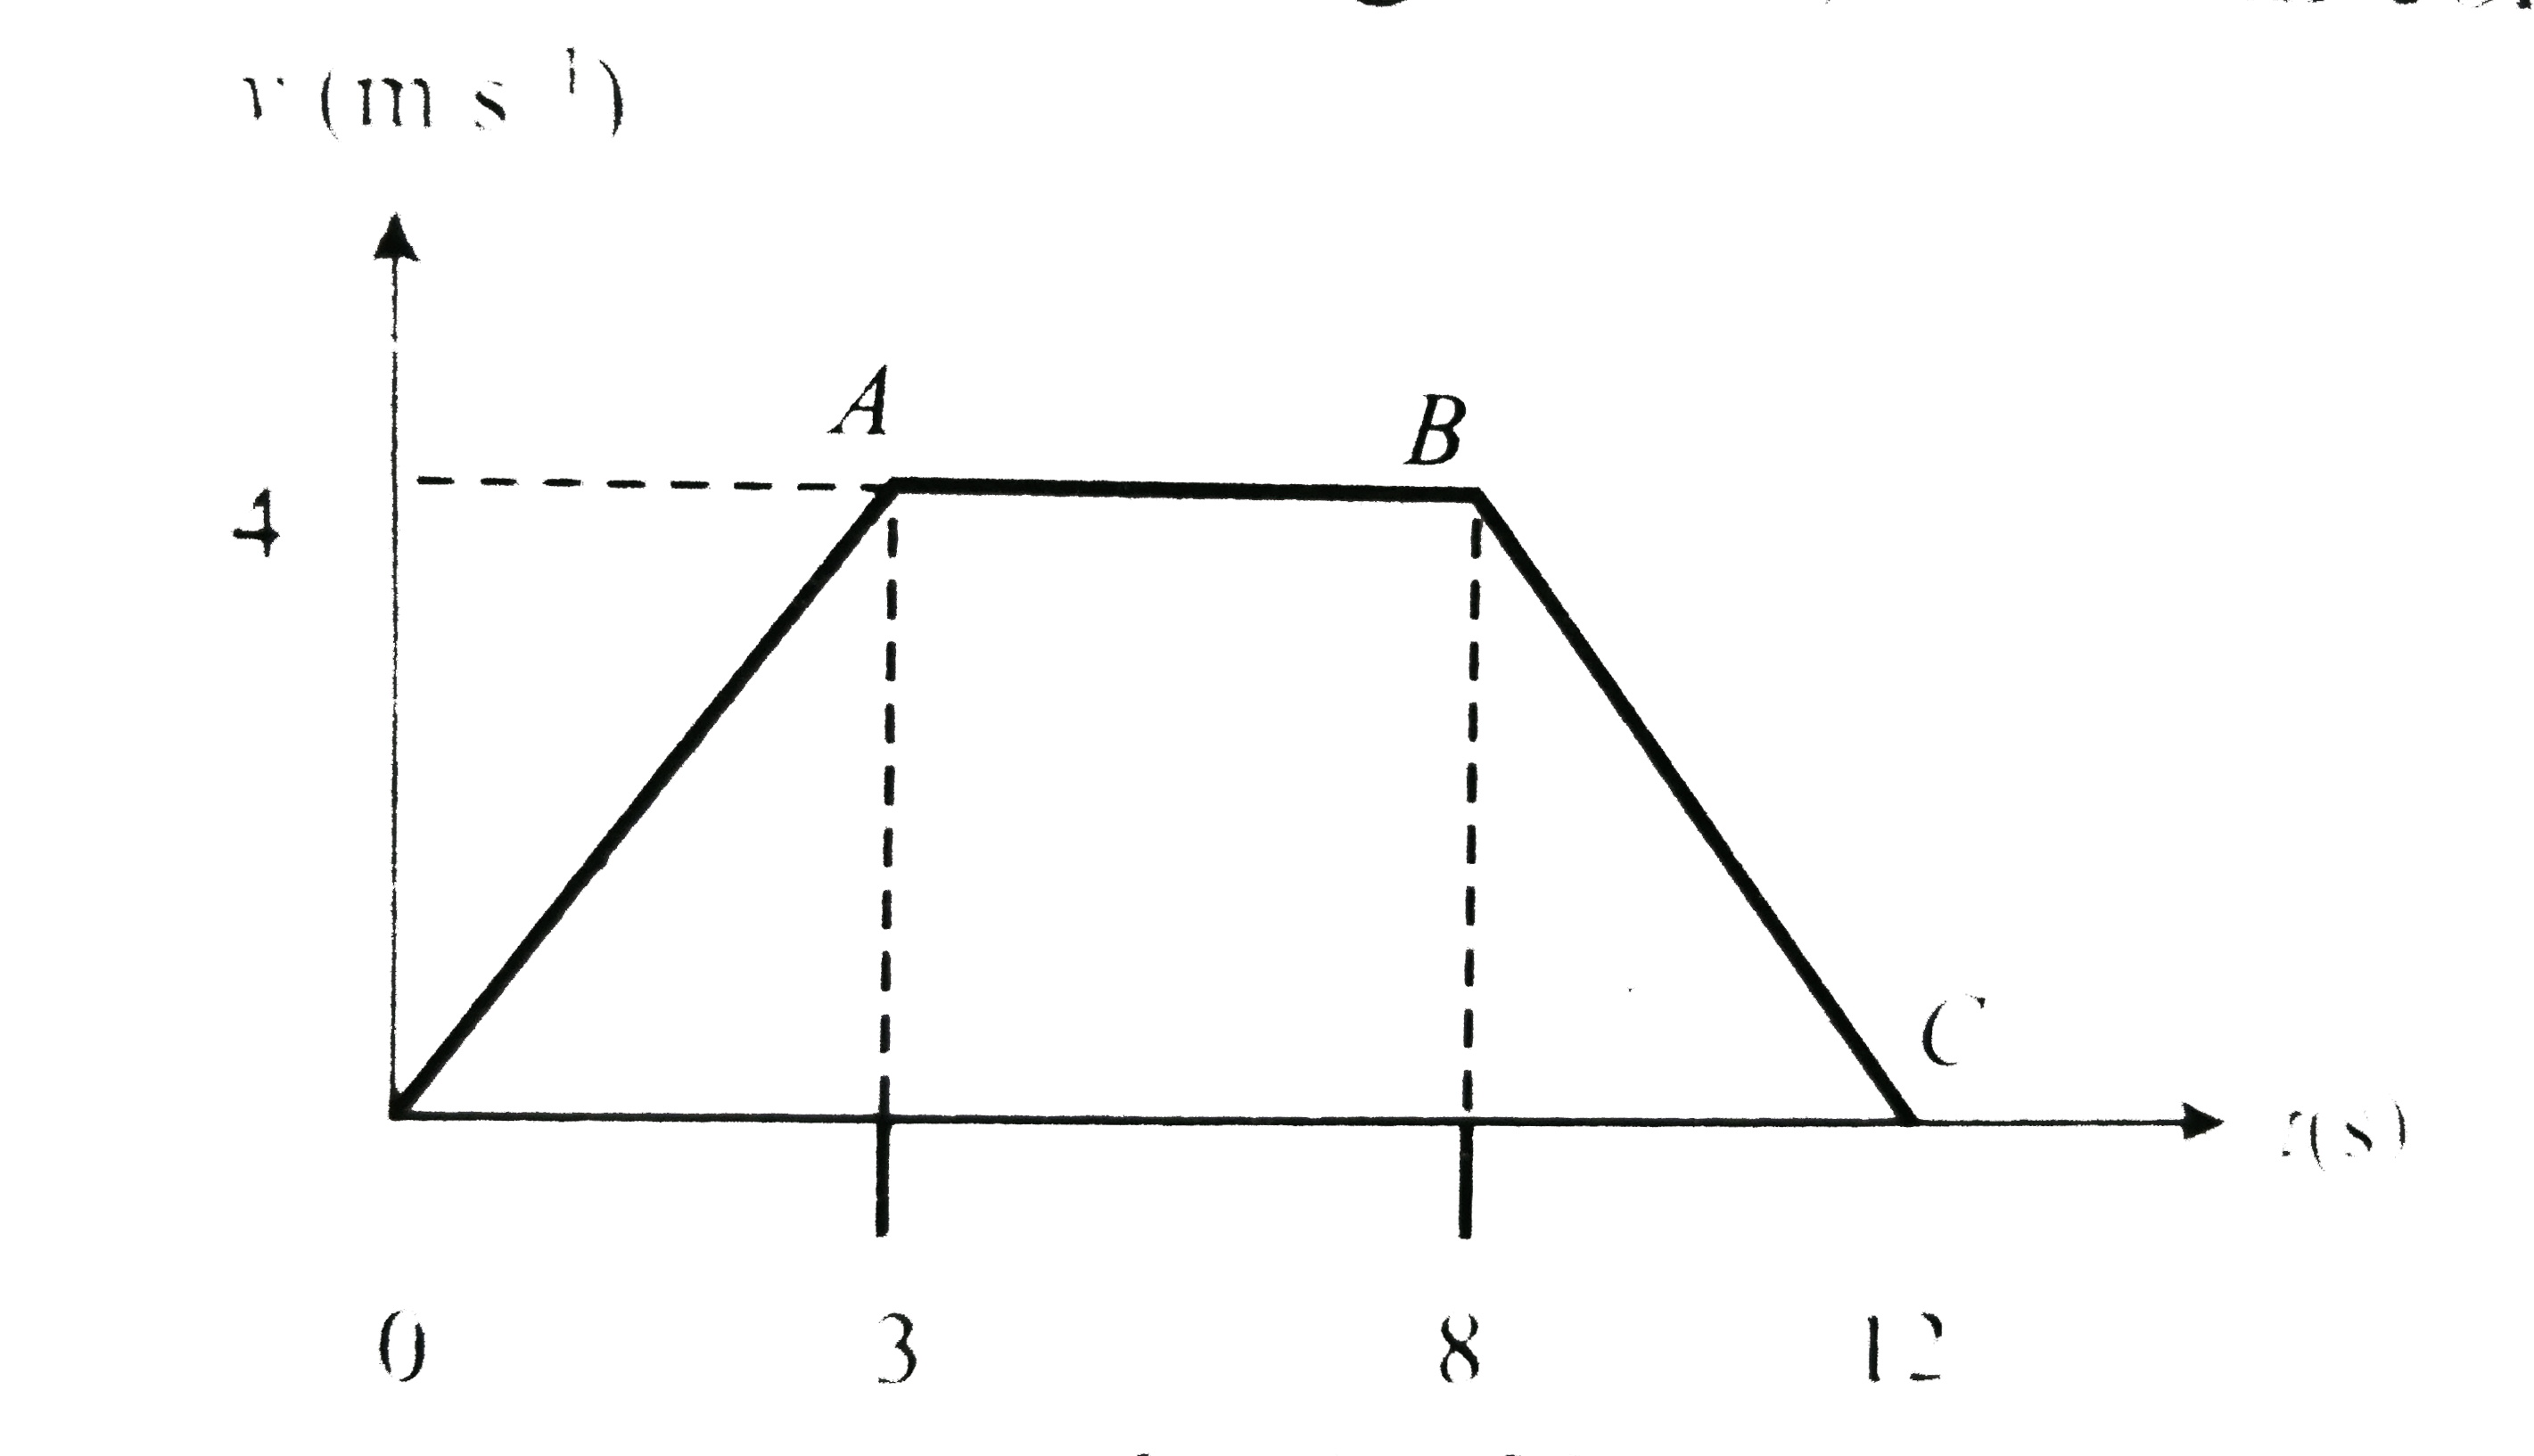
From athe velocity time graph, given in of a particle moving in a straight line, one can conclude that
 .
.
View SolutionThe velocity time plot for a particle moving on straight line is shown in the figure.
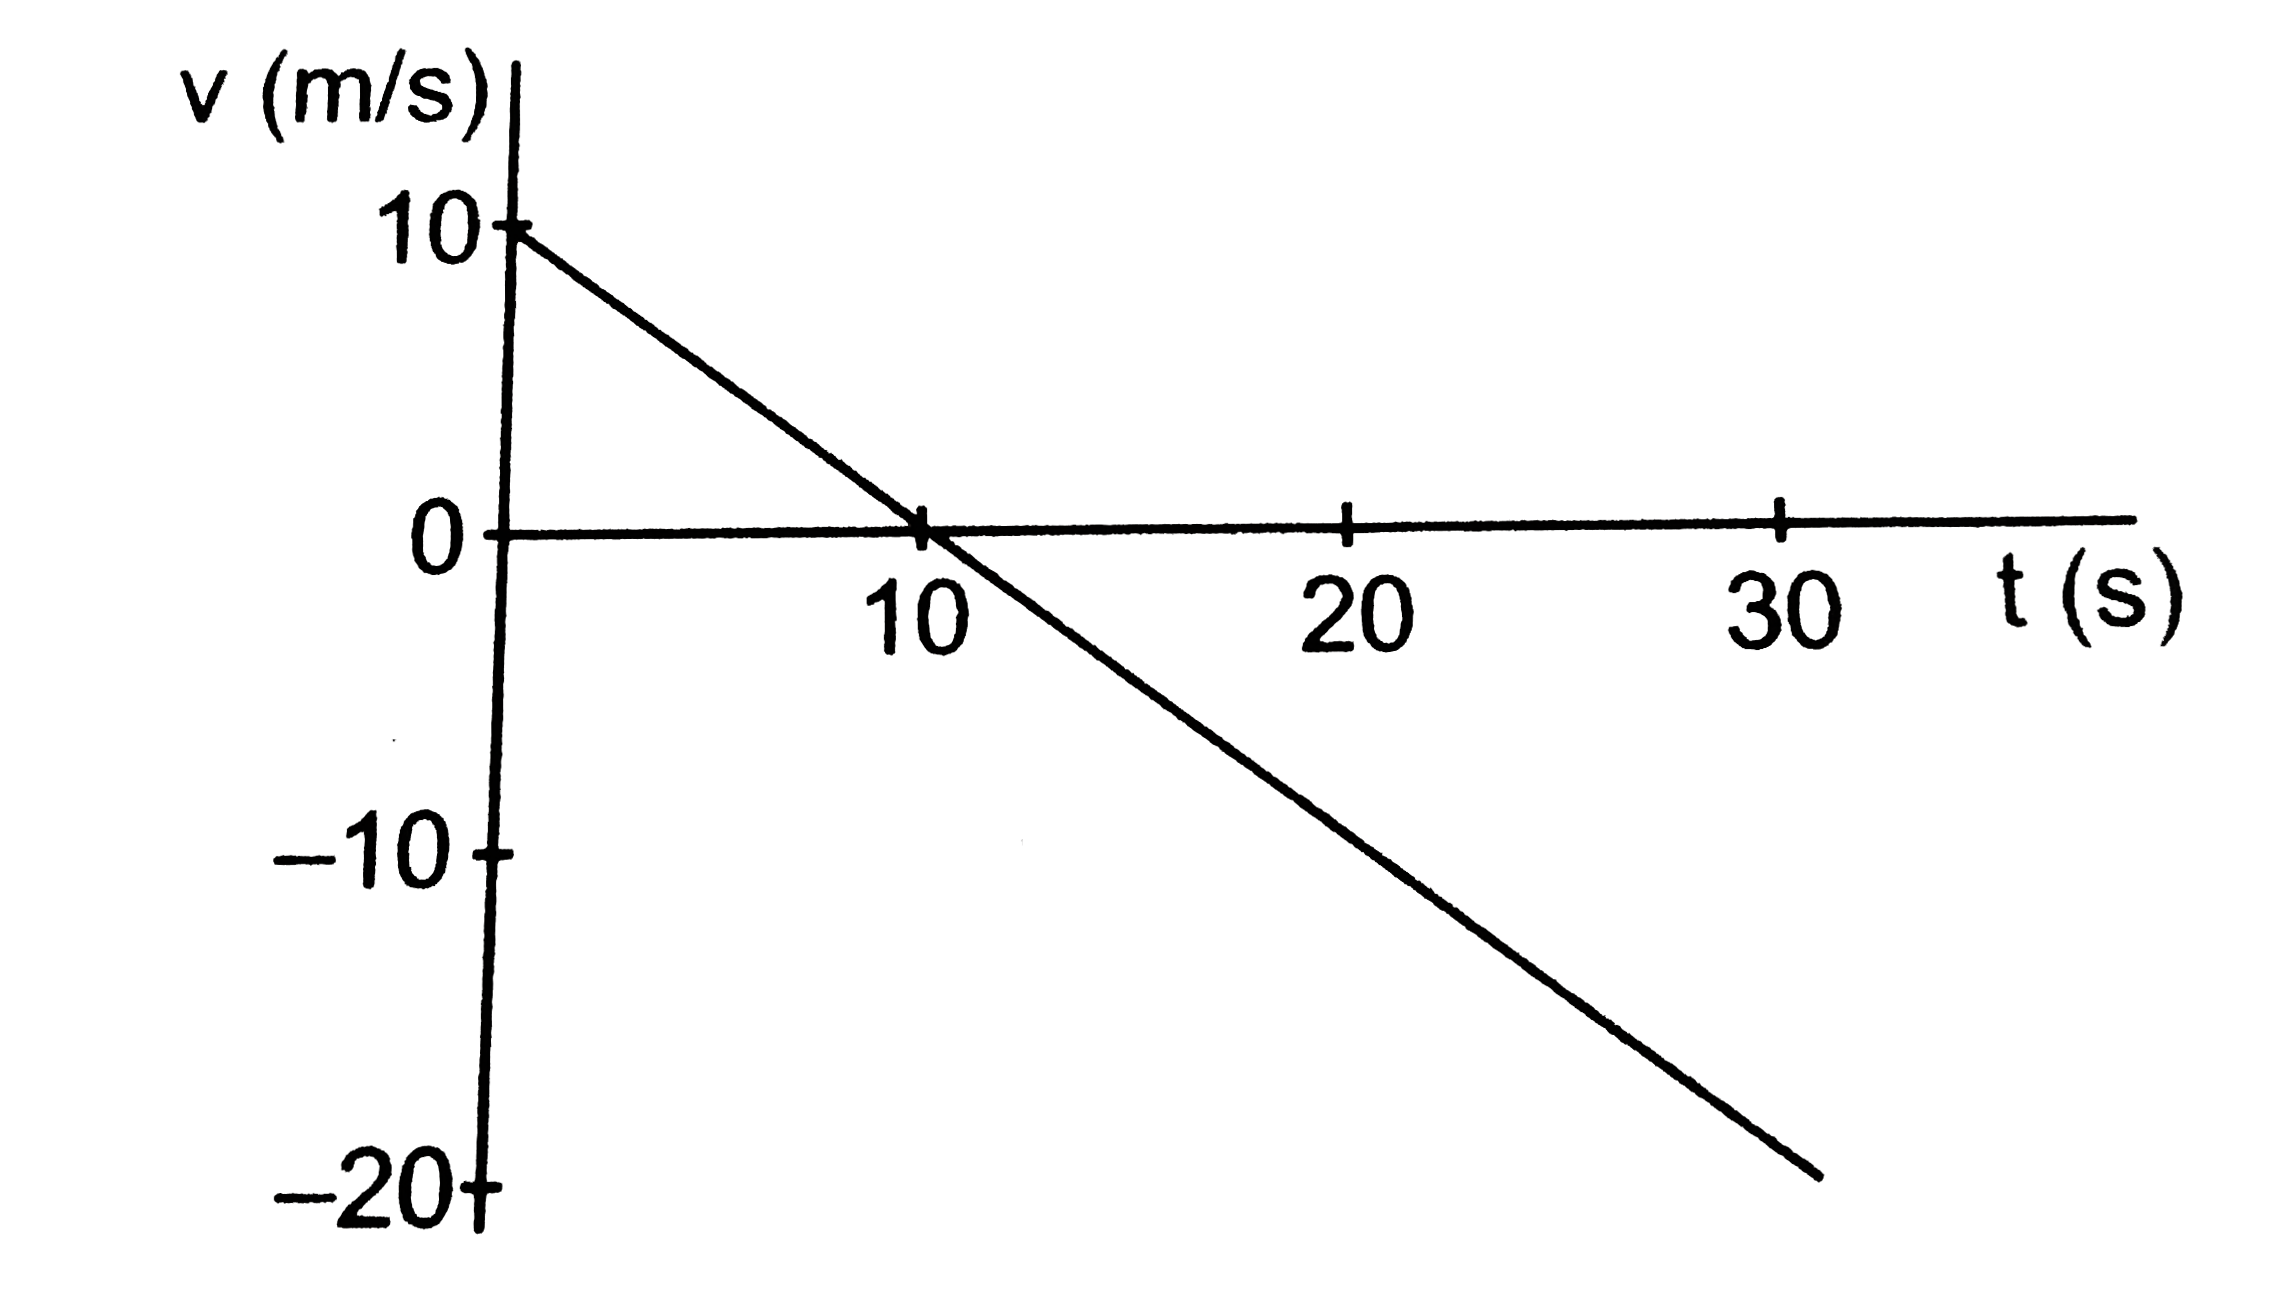
View SolutionThe velocity time plot for a particle moving on straight line is shown in the figure.

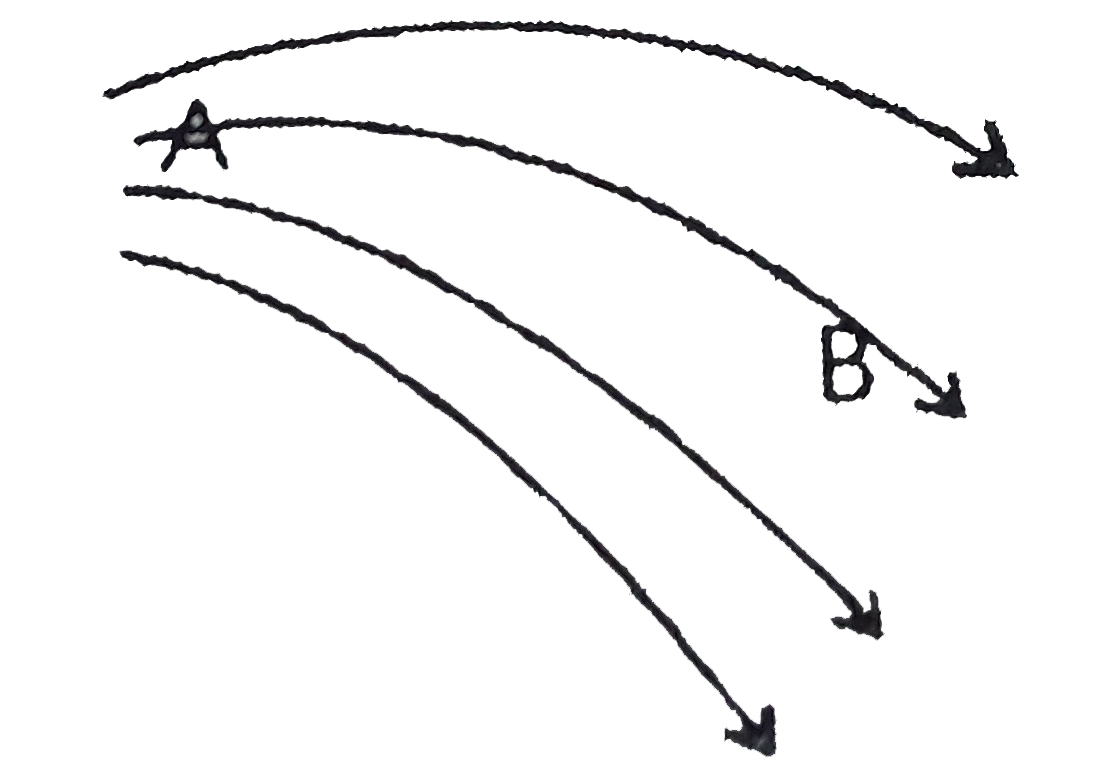
View SolutionSome electric lines of force are shown in figure. For points a and B
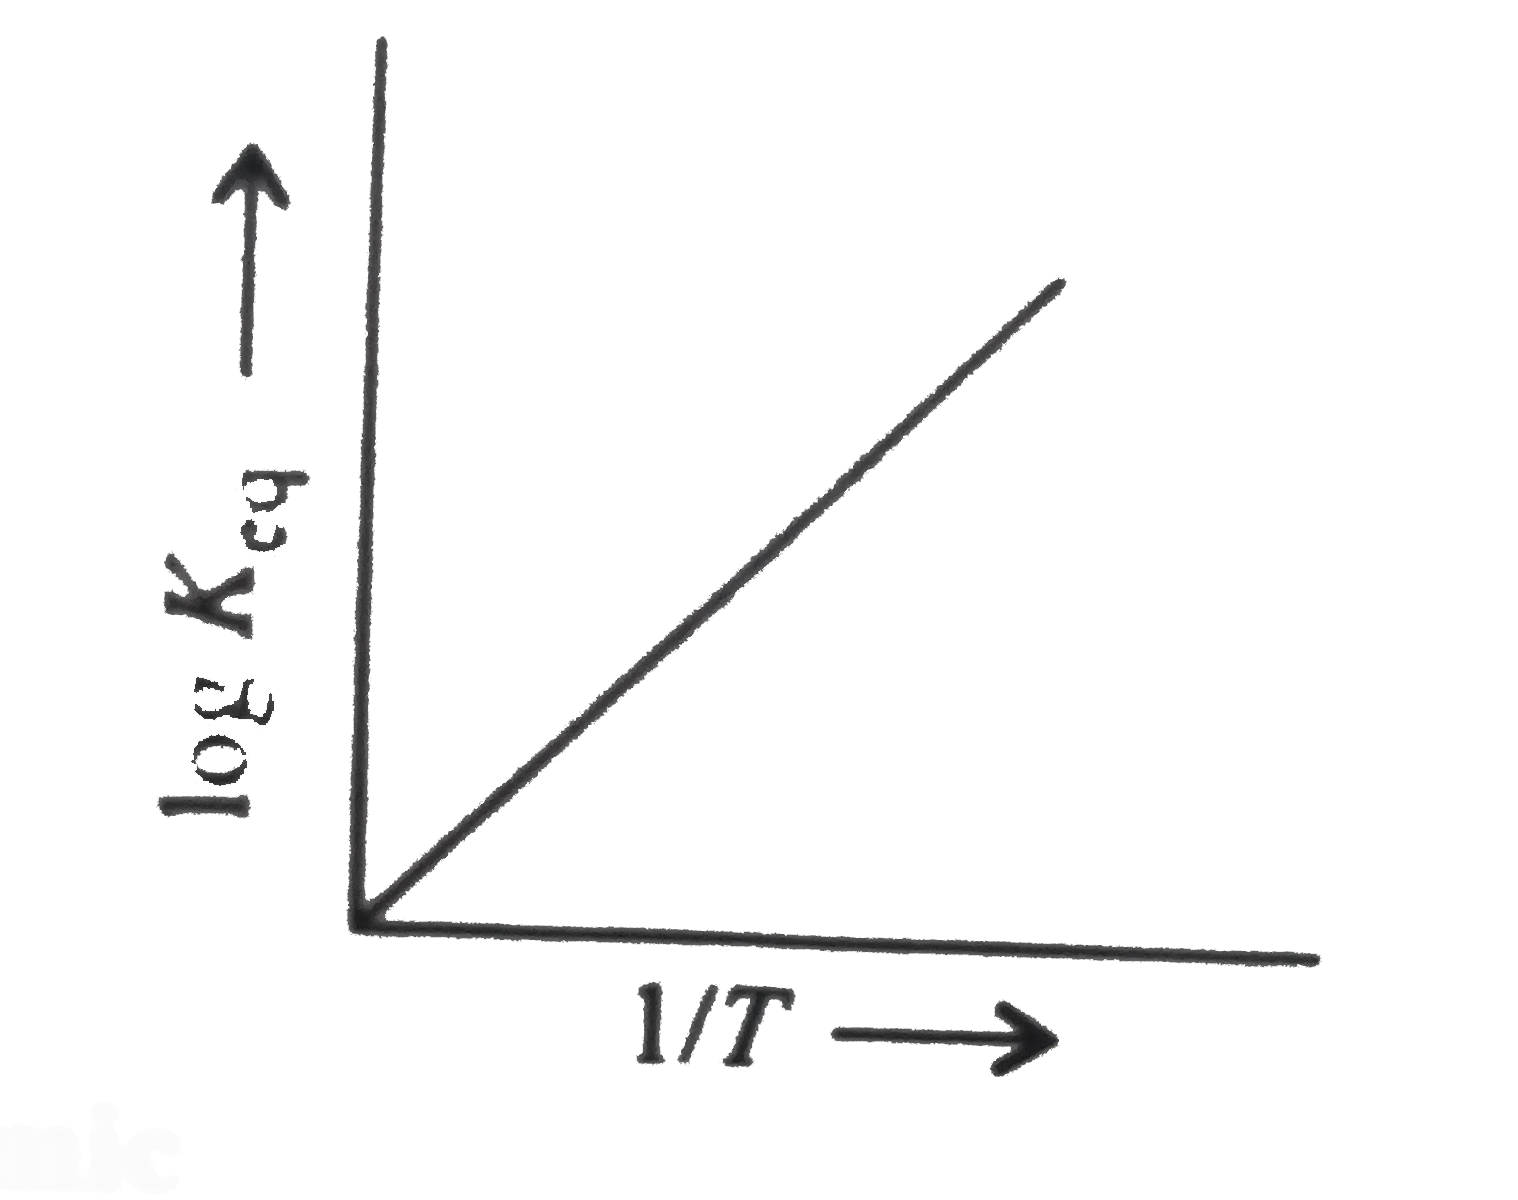
View SolutionA schematic plot of log Keq vs inverse of temperature for a reaction is shown in the figure. The reaction must be:
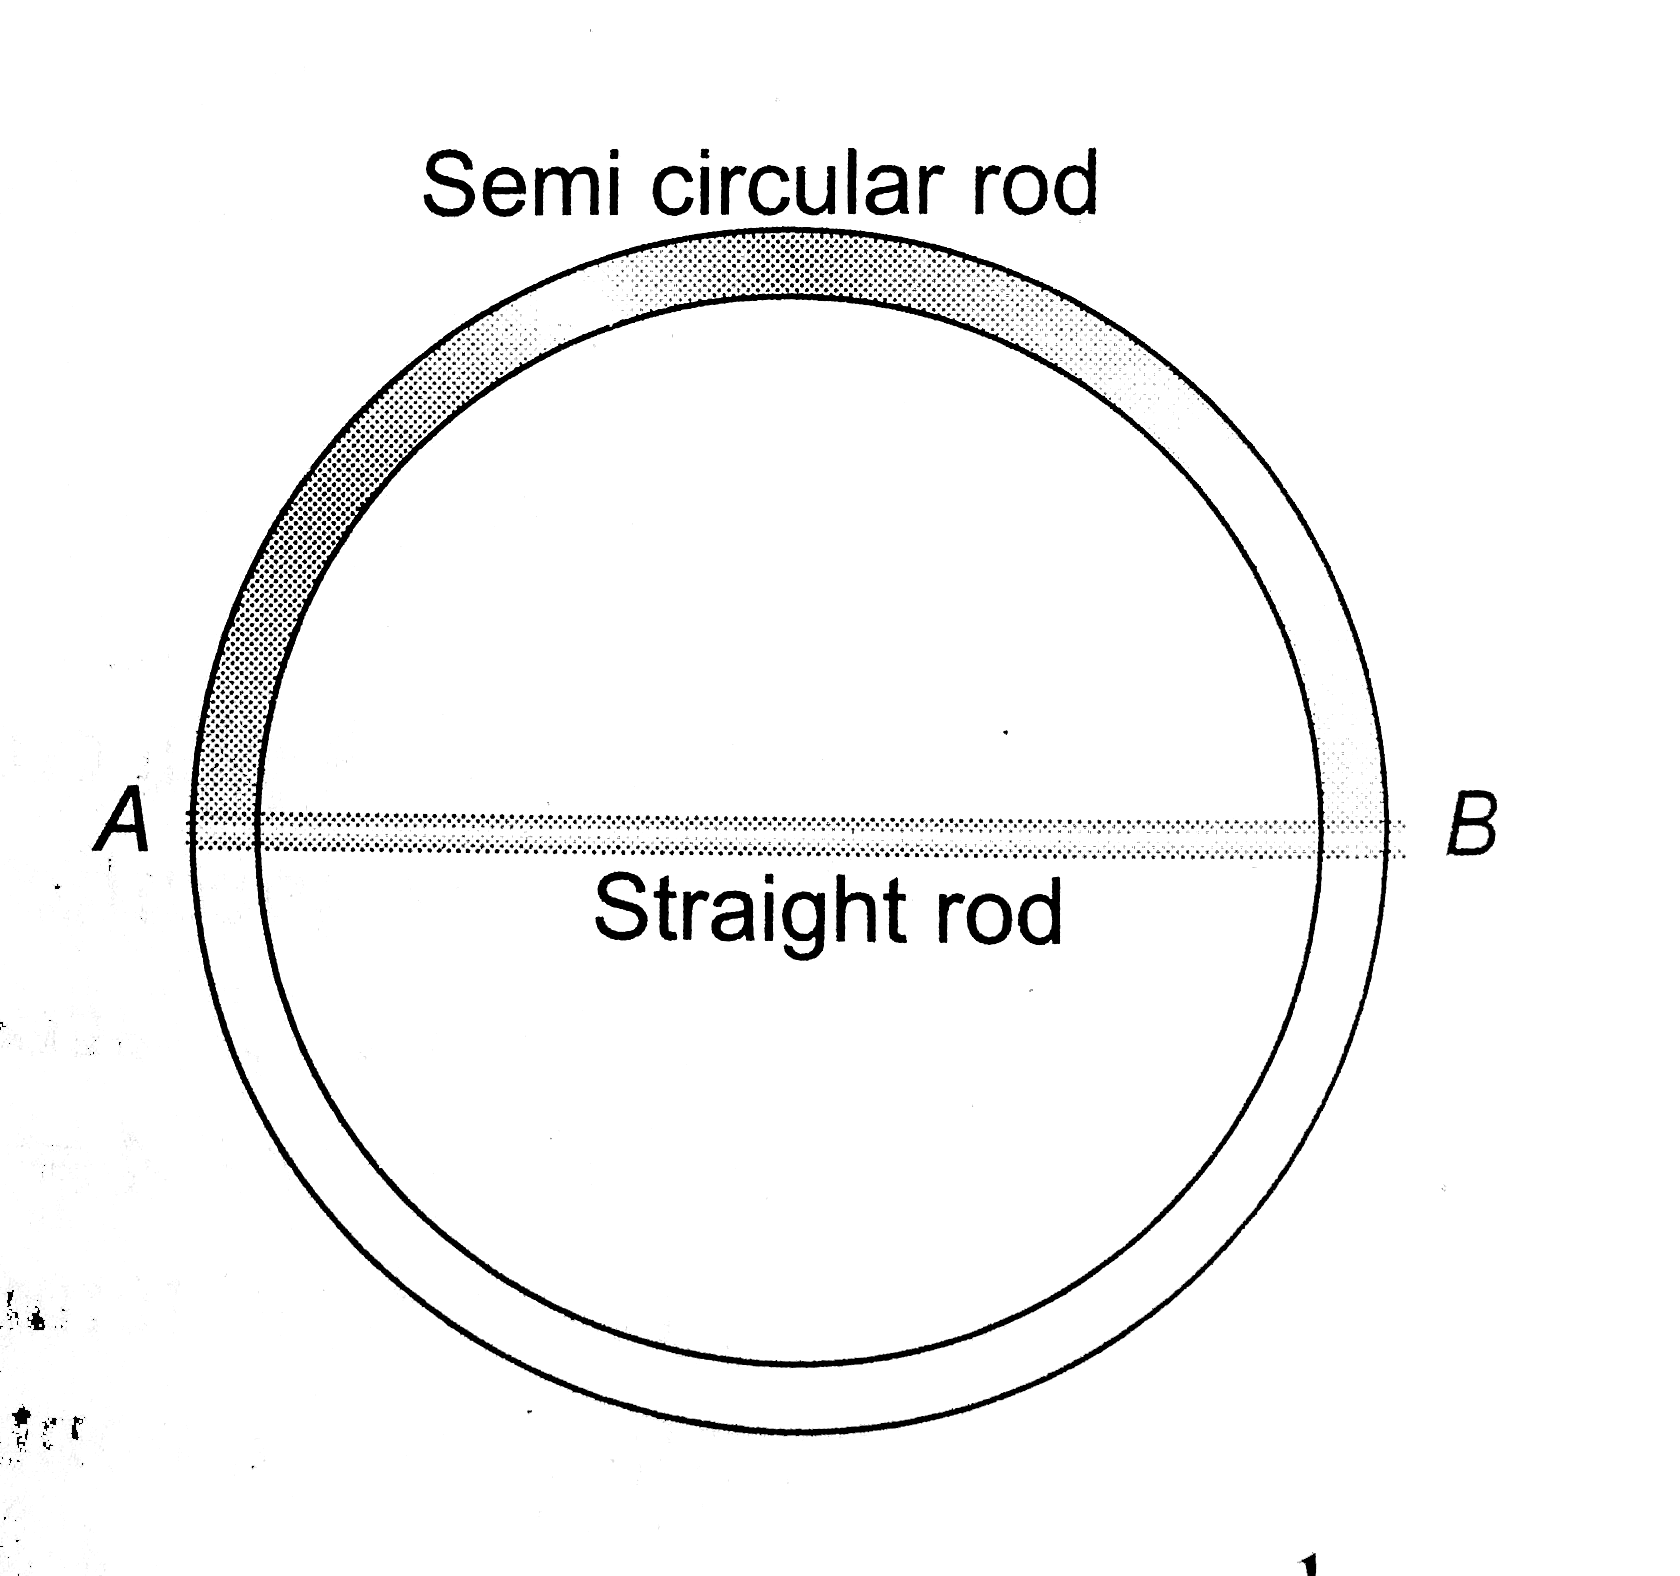
View SolutionTwo rods (one semi-circular and other straight) of same material and of same cross-sectional area are joined as shown in the figure. The point A and B are maintained at different temperature. Find the ratio of the heat transferred through a cross-section of a semi-circular rod to the heat transferred through a cross section of the straight rod in a given time.
View SolutionVapour pressure diagram of some liquids plotted against temperature are shown below
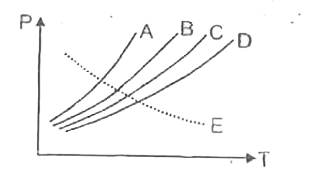
Most volatile liquid
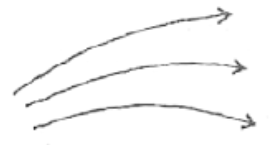
View SolutionIf electric linces of force in a region are represented as shown in the figure, then one can conclude that, electric field is
View SolutionThe variation of temperature of a material as heat is given to it at a constant rate is shown in the figure. The material is in solid state at the point O. The state of the material at the point P is…..
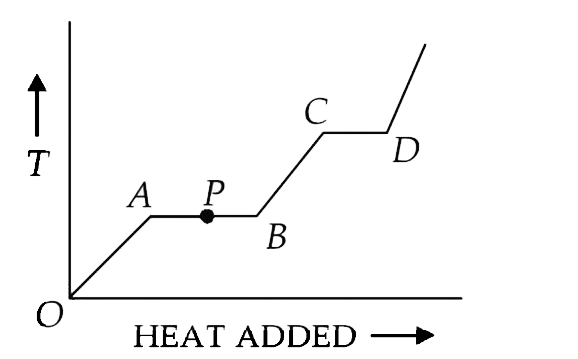
View SolutionThe variation of temperature of a material as heat is given to it at a constant rate is shown in the figure. The material is in solid state at the point O. The state of the material at the point P is…..

View Solution
