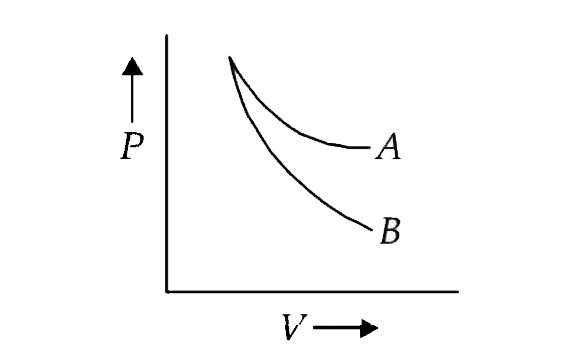
Show that the slope of p−V diagram is greater for an adiabatic process as compared to an isothermal process.
To show that the slope of the p−V diagram is greater for an adiabatic process compared to an isothermal process, we can follow these steps:
Step 1: Understand the equations for the processes
For any process in a gas, we can express the relationship between pressure (P) and volume (V) in terms of a constant. For an adiabatic process, the relationship is given by:
\( PV^{\gamma} = \text{constant} \)
where \(\gamma\) is the adiabatic exponent (ratio of specific heats).
For an isothermal process, the relationship is:
\( PV = \text{constant} \)
Step 2: Differentiate the equations
To find the slope of the p−V diagram, we need to differentiate both equations with respect to volume (V).
1. Adiabatic Process:
Taking the logarithm of the adiabatic equation:
\( \ln P + \gamma \ln V = \ln \text{constant} \)
Differentiating with respect to V:
\( \frac{1}{P} \frac{dP}{dV} + \gamma \frac{1}{V} = 0 \)
Rearranging gives:
\( \frac{dP}{dV} = -\frac{\gamma P}{V} \)
2. Isothermal Process:
Taking the logarithm of the isothermal equation:
\( \ln P + \ln V = \ln \text{constant} \)
Differentiating with respect to V:
\( \frac{1}{P} \frac{dP}{dV} + \frac{1}{V} = 0 \)
Rearranging gives:
\( \frac{dP}{dV} = -\frac{P}{V} \)
Step 3: Compare the slopes
Now we have the expressions for the slopes:
- For the adiabatic process:
\( \frac{dP}{dV} = -\frac{\gamma P}{V} \)
- For the isothermal process:
\( \frac{dP}{dV} = -\frac{P}{V} \)
Step 4: Analyze the magnitudes
In the expressions, we can see that:
- The magnitude of the slope for the adiabatic process is \(\left| \frac{dP}{dV} \right|_{adiabatic} = \frac{\gamma P}{V}\)
- The magnitude of the slope for the isothermal process is \(\left| \frac{dP}{dV} \right|_{isothermal} = \frac{P}{V}\)
Since \(\gamma > 1\) (for any gas), it follows that:
\( \left| \frac{dP}{dV} \right|_{adiabatic} > \left| \frac{dP}{dV} \right|_{isothermal} \)
Conclusion
Thus, we conclude that the slope of the p−V diagram is greater for an adiabatic process compared to an isothermal process.
---
For any process in a gas, we can express the relationship between pressure (P) and volume (V) in terms of a constant. For an adiabatic process, the relationship is given by:
\( PV^{\gamma} = \text{constant} \)
where \(\gamma\) is the adiabatic exponent (ratio of specific heats).
\( PV = \text{constant} \)
To find the slope of the p−V diagram, we need to differentiate both equations with respect to volume (V).
Taking the logarithm of the adiabatic equation:
\( \ln P + \gamma \ln V = \ln \text{constant} \)
Differentiating with respect to V:
\( \frac{1}{P} \frac{dP}{dV} + \gamma \frac{1}{V} = 0 \)
Rearranging gives:
\( \frac{dP}{dV} = -\frac{\gamma P}{V} \)
Taking the logarithm of the isothermal equation:
\( \ln P + \ln V = \ln \text{constant} \)
Differentiating with respect to V:
\( \frac{1}{P} \frac{dP}{dV} + \frac{1}{V} = 0 \)
Rearranging gives:
\( \frac{dP}{dV} = -\frac{P}{V} \)
Now we have the expressions for the slopes:
- For the adiabatic process:
\( \frac{dP}{dV} = -\frac{\gamma P}{V} \)
- For the isothermal process:
\( \frac{dP}{dV} = -\frac{P}{V} \)
In the expressions, we can see that:
- The magnitude of the slope for the adiabatic process is \(\left| \frac{dP}{dV} \right|_{adiabatic} = \frac{\gamma P}{V}\)
- The magnitude of the slope for the isothermal process is \(\left| \frac{dP}{dV} \right|_{isothermal} = \frac{P}{V}\)
\( \left| \frac{dP}{dV} \right|_{adiabatic} > \left| \frac{dP}{dV} \right|_{isothermal} \)
Thus, we conclude that the slope of the p−V diagram is greater for an adiabatic process compared to an isothermal process.
Topper's Solved these Questions
Similar Questions
In adiabatic process
View SolutionIn an isothermal process
View SolutionFor an isothermal process
View SolutionIn an adiabatic process
View SolutionIn an adiabatic process-
View SolutionIn a adiabatic process.
View SolutionWhat is the slope for an isothermal process ?
View SolutionIsothermal and adiabatic process are identical.
View SolutionThe curves A and B in the figure shown P-V graphs for an isothermal and an adiabatic process for an idea gas. The isothermal process is represented by the curve A.

View SolutionThe curves A and B in the figure shown P-V graphs for an isothermal and an adiabatic process for an idea gas. The isothermal process is represented by the curve A.

View Solution
