Show the shape of the distance-time graph for the motion in the following cases:
A car parked on a side road.
To show the shape of the distance-time graph for a car parked on a side road, we can follow these steps:
1. Understanding the Scenario:
- A car parked on a side road means that the car is stationary. It does not move from its position over time.
2. Identifying Variables:
- Distance (y-axis): This represents how far the car is from a reference point (e.g., the starting point).
- Time (x-axis): This represents the time elapsed since we started observing the car.
3. Analyzing Motion:
- Since the car is parked, the distance does not change as time progresses. This means that for every unit of time that passes, the distance remains constant.
4. Graph Representation:
- On the distance-time graph, the y-axis will show the distance (which remains constant) and the x-axis will show time (which keeps increasing).
- Since the distance does not change, the graph will be a horizontal line parallel to the x-axis.
5. Drawing the Graph:
- Start by marking a point on the y-axis to represent the distance of the parked car from the reference point.
- Draw a horizontal line across the graph at this distance level, extending it as time increases on the x-axis.
Final Graph:
- The graph will look like a straight horizontal line, indicating that as time increases, the distance remains the same.
- A car parked on a side road means that the car is stationary. It does not move from its position over time.
- Distance (y-axis): This represents how far the car is from a reference point (e.g., the starting point).
- Time (x-axis): This represents the time elapsed since we started observing the car.
- Since the car is parked, the distance does not change as time progresses. This means that for every unit of time that passes, the distance remains constant.
- On the distance-time graph, the y-axis will show the distance (which remains constant) and the x-axis will show time (which keeps increasing).
- Since the distance does not change, the graph will be a horizontal line parallel to the x-axis.
- Start by marking a point on the y-axis to represent the distance of the parked car from the reference point.
- Draw a horizontal line across the graph at this distance level, extending it as time increases on the x-axis.
- The graph will look like a straight horizontal line, indicating that as time increases, the distance remains the same.
Topper's Solved these Questions
Similar Questions
Knowledge Check
The graph of distance -time graph for uniform motion for an object is
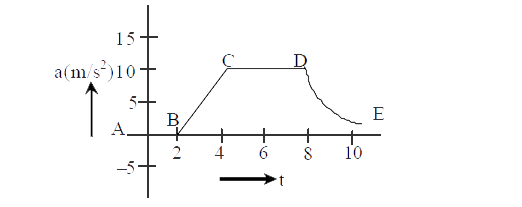
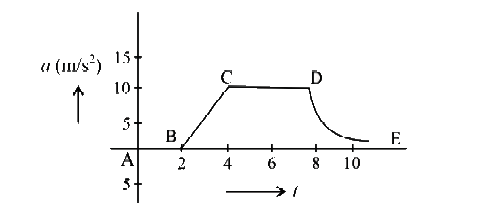
Astraight lineBcurved lineCfirst straight line then curved lineDNone of theseThe uniform motion in the following acceleration-time graph is-
 AABBBCCCDDDE
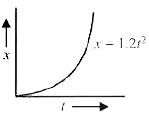
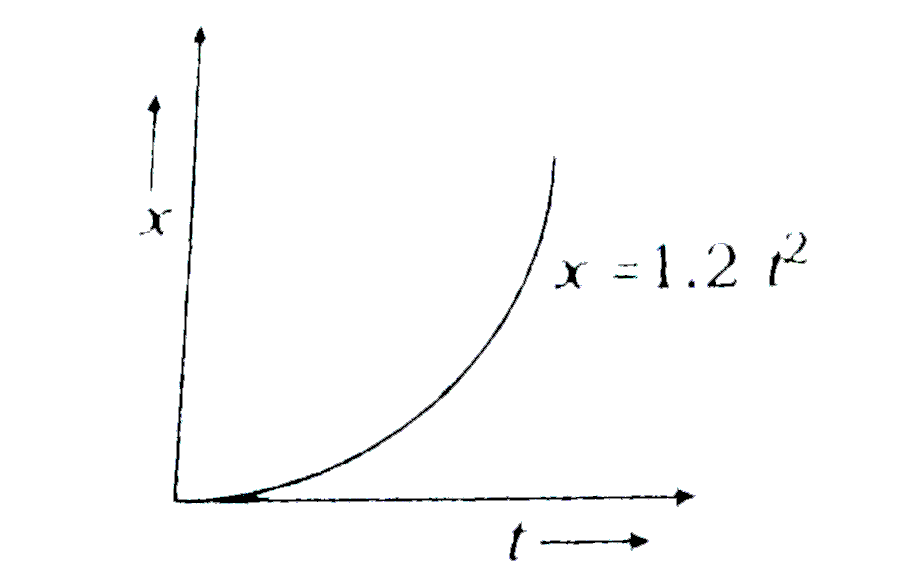
Given figure shows the distance-time graph of the motion of a car. It follows from the,| graph that the car is
 Aat restBin uniform motionCin non-uniform accclerationDunifommly accelerated.
The distance-time graph of the motion of an object moving with a contant speed is a straight line.
View SolutionThe uniform motion in the following acceleration-time graph is

View SolutionA car parked on road draw the shape of distance-time graph for it.
View SolutionThe distance-time graph of the motion of an object moving with a contant speed is a straight line.
View SolutionFigure given shows the distance - time graph of the motion of a car. It follows from the graph that the car is

View Solution
