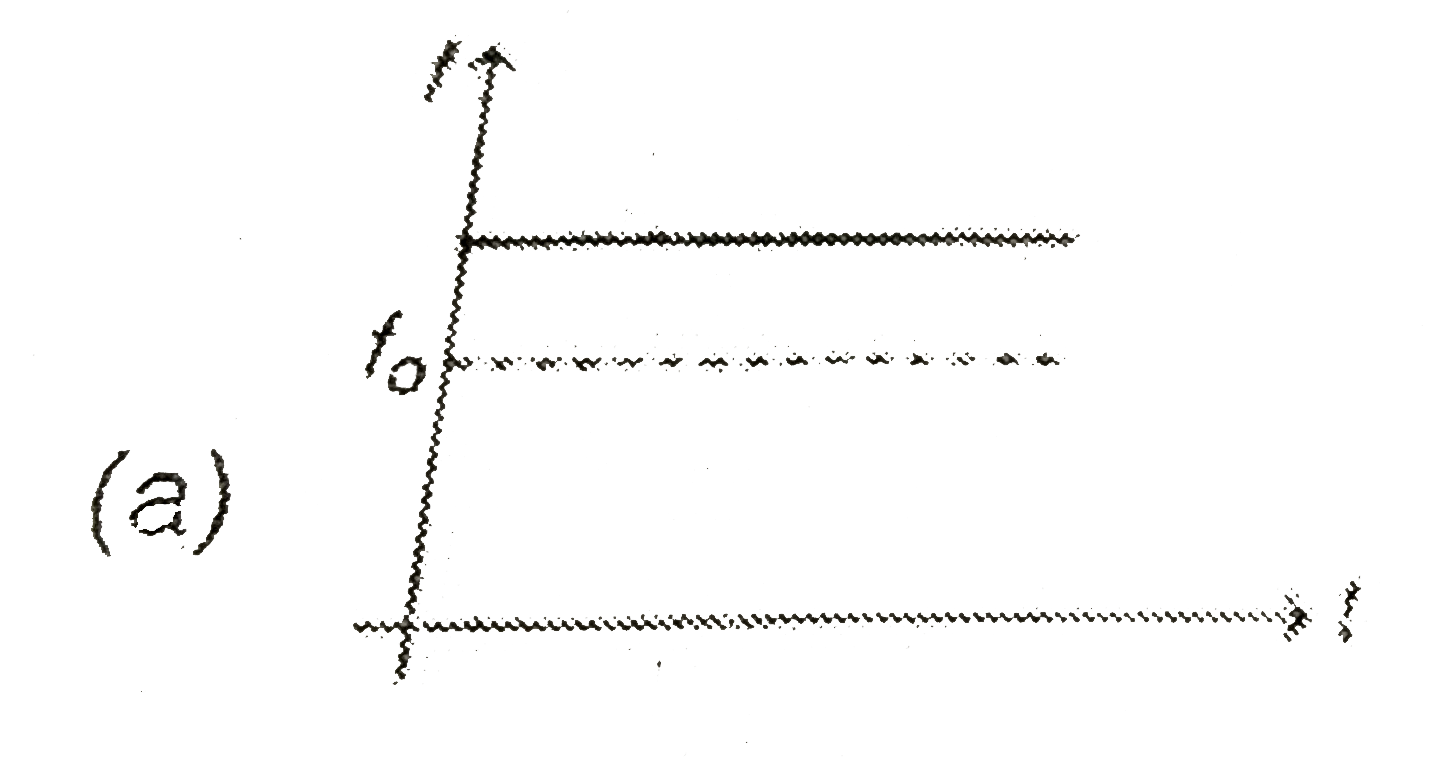
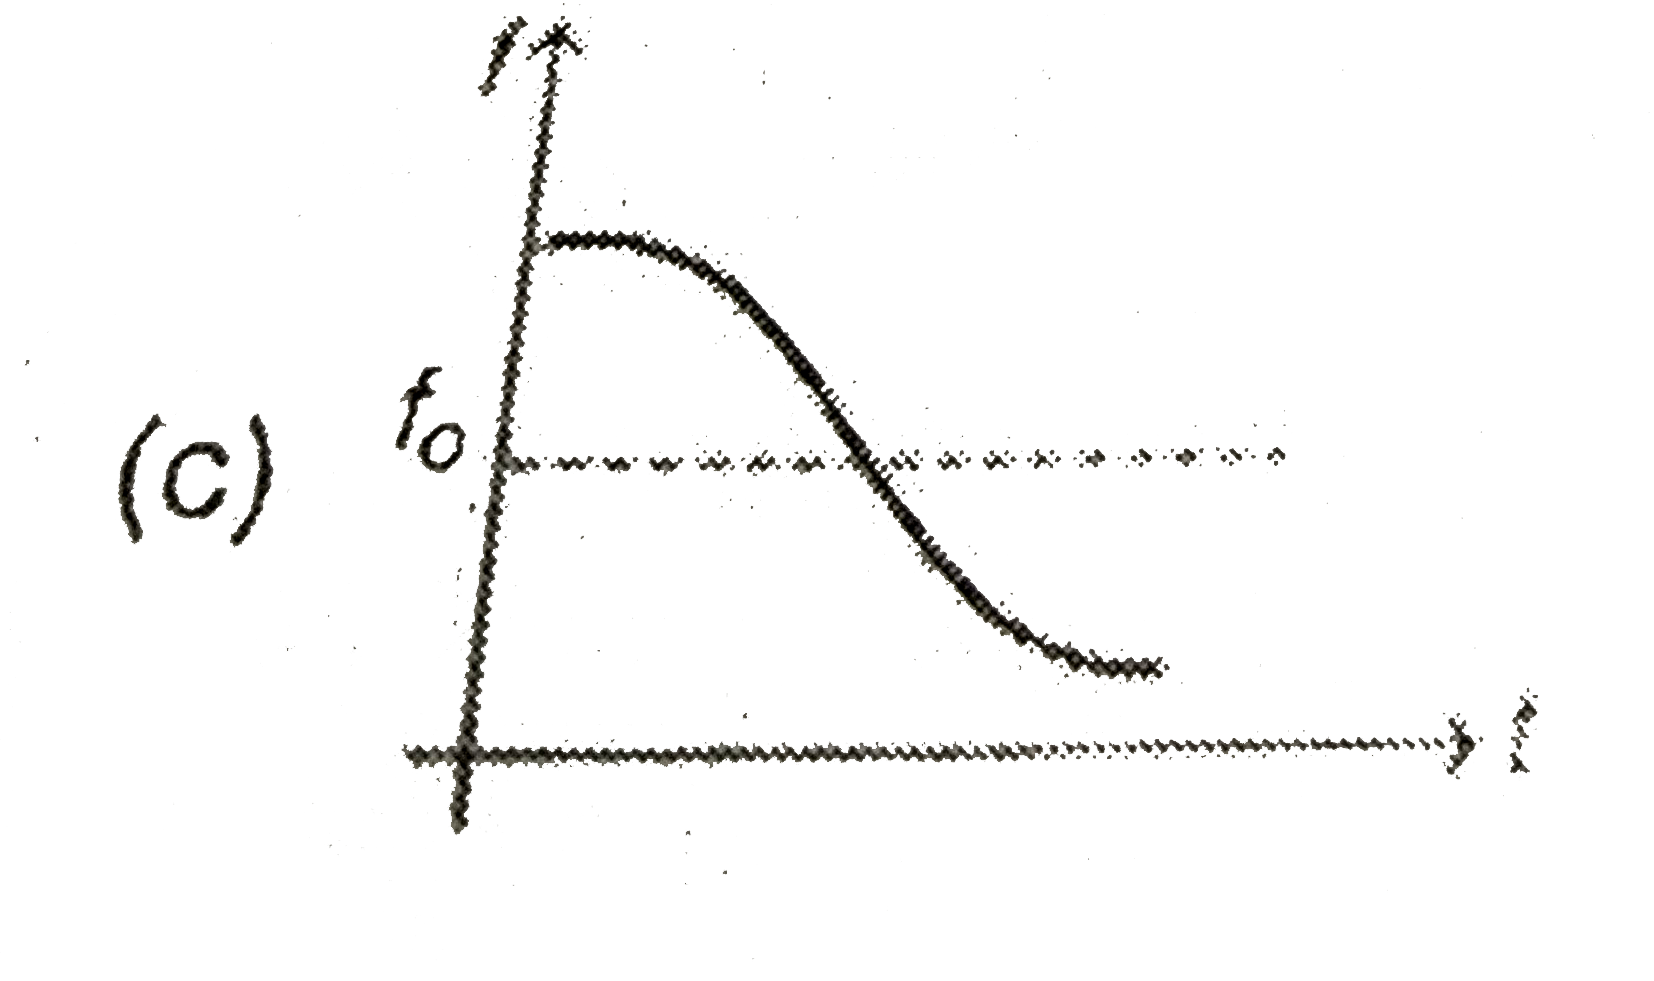
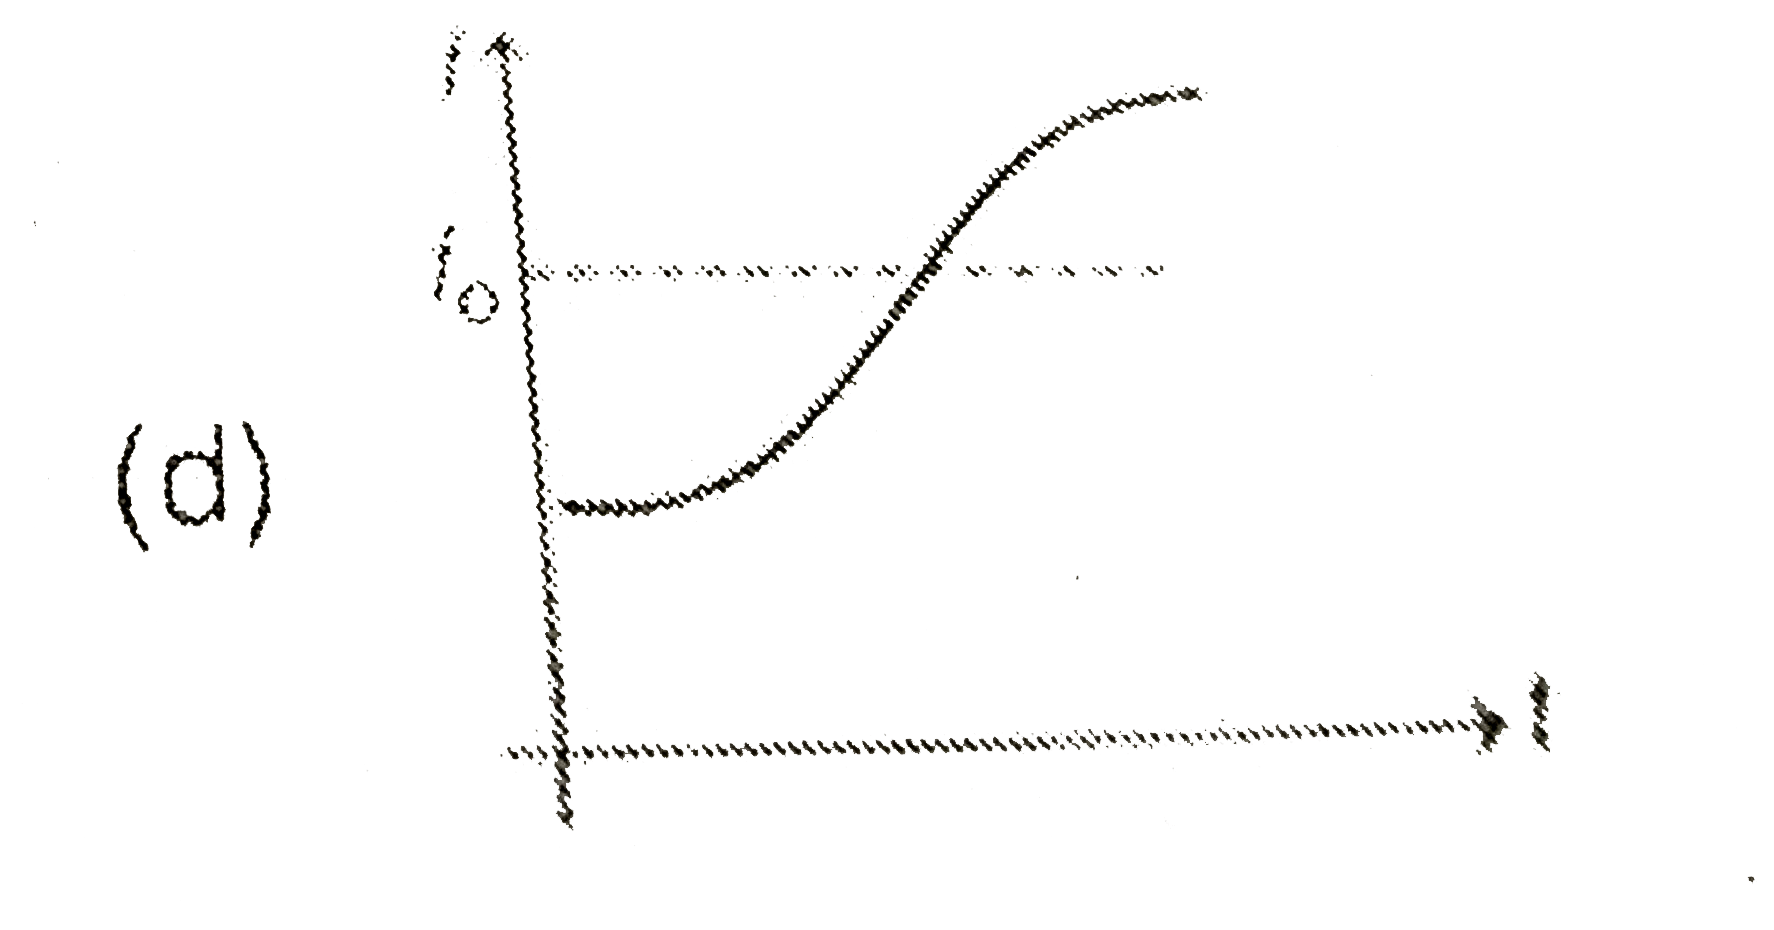
source and observer both start moving simultaneously from origion one along y - axis with speed of source = 2 (speed of observer ). The graph between the apparent frequency observed by observer (f) and time (t) would be

The correct Answer is:B
To solve the problem step by step, we need to analyze the situation where both the source and the observer are moving away from each other, and we need to determine the relationship between the apparent frequency observed by the observer and time.
Step 1: Define the Variables
Let:
- v0 = speed of the observer
- vs=2v0 = speed of the source (twice the speed of the observer)
- v = speed of sound
Step 2: Determine the Direction of Motion
- The observer is moving along the y-axis.
- The source is moving along the x-axis.
- Since both are moving away from each other, we need to consider their velocities in the direction of the line joining them.
Step 3: Calculate the Components of Velocity
- The component of the observer's velocity in the direction of the line joining them can be expressed as:
v′o=v0cos(β)
- The component of the source's velocity in the direction of the line joining them can be expressed as:
v′s=vscos(α)=2v0cos(α)
Step 4: Use the Doppler Effect Formula
The apparent frequency (f′) can be calculated using the Doppler effect formula:
f′=fv−v′ov+v′s
Substituting the values:
f′=fv−v0√5v+4v0√5
Step 5: Analyze the Frequency Change
Since vs=2v0, we can substitute this into the formula:
f′=fv−v0√5v+4v0√5
This shows that f′ is dependent on v0 and v, but the original frequency f remains constant.
Step 6: Determine the Relationship Over Time
- As both the source and observer are moving away from each other, the apparent frequency f′ will be less than the original frequency f.
- There is no time dependence in the expression for f′ since it does not change with time.
Step 7: Graphical Representation
- Since f′<f and there is no time dependence, the graph of apparent frequency f′ against time t will be a horizontal line below the original frequency f.
Conclusion
The graph between the apparent frequency observed by the observer and time t would be a horizontal line indicating that the apparent frequency remains constant but is less than the original frequency.
Let:
- v0 = speed of the observer
- vs=2v0 = speed of the source (twice the speed of the observer)
- v = speed of sound
- The observer is moving along the y-axis.
- The source is moving along the x-axis.
- Since both are moving away from each other, we need to consider their velocities in the direction of the line joining them.
- The component of the observer's velocity in the direction of the line joining them can be expressed as:
v′o=v0cos(β)
- The component of the source's velocity in the direction of the line joining them can be expressed as:
v′s=vscos(α)=2v0cos(α)
The apparent frequency (f′) can be calculated using the Doppler effect formula:
f′=fv−v′ov+v′s
Substituting the values:
f′=fv−v0√5v+4v0√5
Since vs=2v0, we can substitute this into the formula:
f′=fv−v0√5v+4v0√5
This shows that f′ is dependent on v0 and v, but the original frequency f remains constant.
- As both the source and observer are moving away from each other, the apparent frequency f′ will be less than the original frequency f.
- There is no time dependence in the expression for f′ since it does not change with time.
- Since f′<f and there is no time dependence, the graph of apparent frequency f′ against time t will be a horizontal line below the original frequency f.
The graph between the apparent frequency observed by the observer and time t would be a horizontal line indicating that the apparent frequency remains constant but is less than the original frequency.
Topper's Solved these Questions
- BOOK - DC PANDEY ENGLISHCHAPTER - WAVE MOTIONEXERCISE - More Than One Option is Correct23videos
WAVE MOTION
- BOOK - DC PANDEY ENGLISHCHAPTER - WAVE MOTIONEXERCISE - Comprehion Type Questions20videos
WAVE MOTION
- BOOK - DC PANDEY ENGLISHCHAPTER - WAVE MOTIONEXERCISE - JEE MAINS50videos
WAVE MOTION
- BOOK - DC PANDEY ENGLISHCHAPTER - VECTORSEXERCISE - Medical enrances gallery9videos
VECTORS
- BOOK - DC PANDEY ENGLISHCHAPTER - WORK, ENERGY & POWEREXERCISE - Level 2 Comprehension Based2videos
WORK, ENERGY & POWER
Similar Questions
Source and observer start moving simulatneously along x and y-axis respectively. The speed of source is twice the speed of observer V0. If the ratio of observer frequency to the frequency of the source is 0.75, find the velocity of sound.
View SolutionSource and observer start moving simulatneously along x and y-axis respectively. The speed of source is twice the speed of observer V0. If the ratio of observer frequency to the frequency of the source is 0.75, find the velocity of sound.
View Solution
Knowledge Check
- Question 1 - Select One
An observer moves towards a stationary source of sound. The percentage change in the apparent frequency is
AzeroB0.05C0.1D0.2 - Question 2 - Select One
At what speed should a source of sound move so that observer finds the apparent frequency equal to half of the original frequency ?
Av2B2vCv/4Dv - Question 3 - Select One
A sound source is moving towards a stationary observer with 1/10 of the speed of sound. The ratio of apparent to real frequency is
A109B(109)2C(1110)2D1110
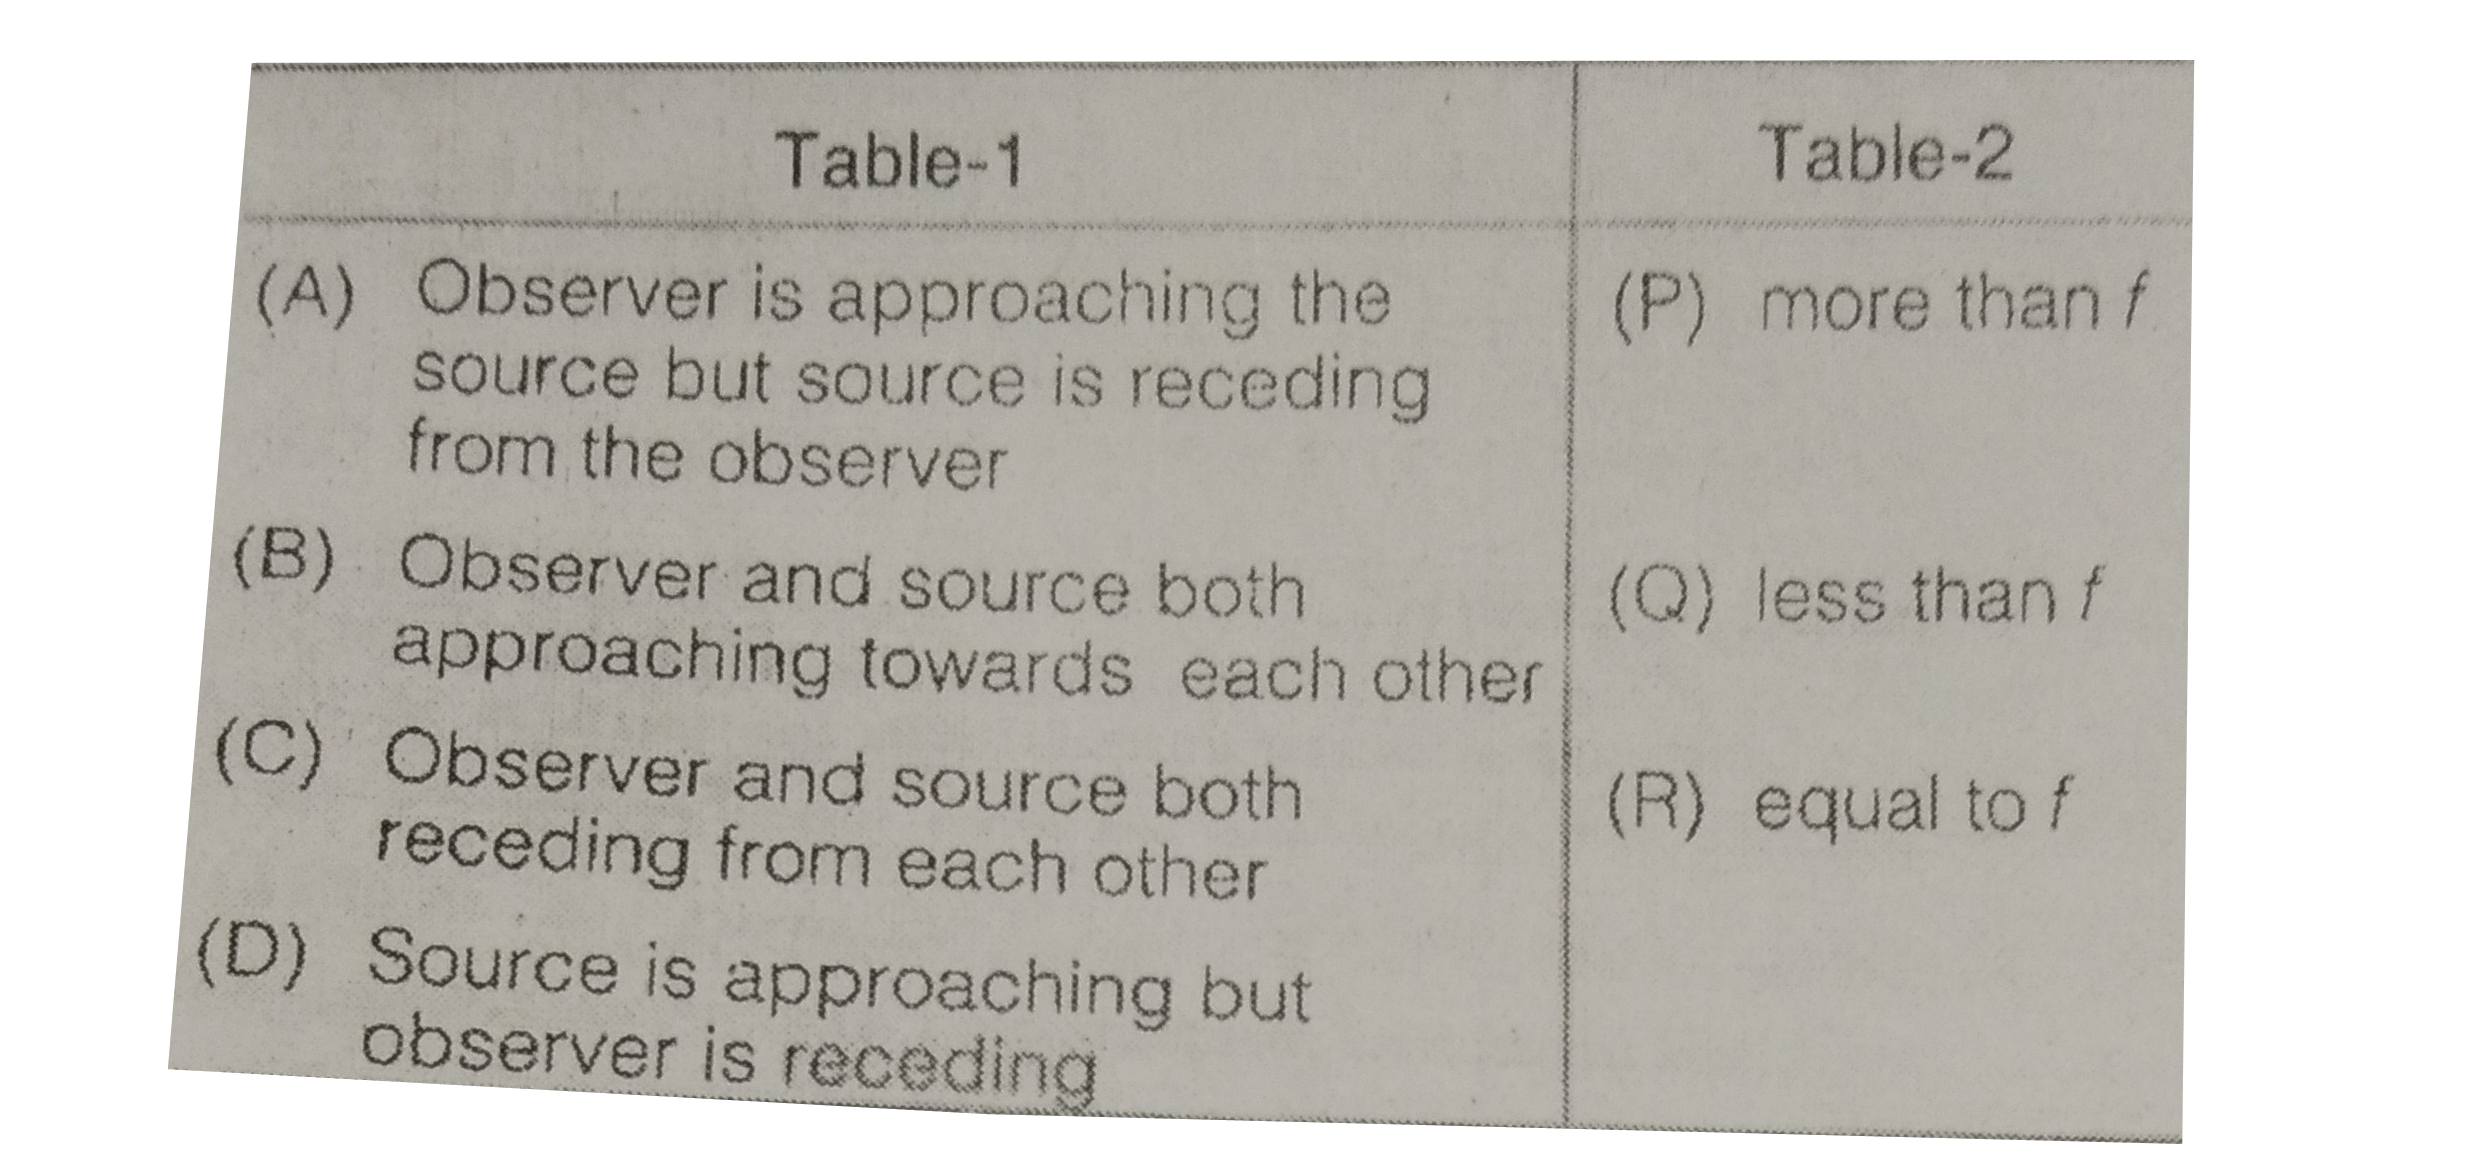
A sound source has frequency f. Source and observer both have same speed.For the apparent frequency observed by observer match the following.
 View Solution
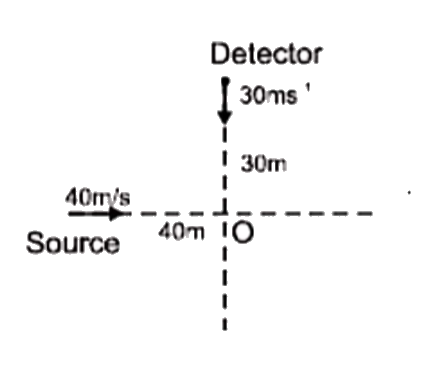
A source and detector both start moving simultaneously from the position shown in the figure, one along x-axis and the other along y-axis with speeds 40 ms−1 and 30 ms−1 respectively. If n is the frequency of the source then the graph between the apparent frequency n' observed by detector and time t would be [assume that source and detector do not collide]
 View Solution
An observer starts moving with unifrom acceleration a towards a stationary sound soure of frequency fo. As the observer approaches the source ,the apparent frequency f heard by the observer varies with time t as
View SolutionA source is approaching towards an observer with constant speed along the line joining them. After crossing the observer, source recedes from observer with same speed. Let f is apparent frequency heard by observer. Then, 1) f will keep on increasing during approaching 2) f will keep on decreasing during receding 3) f will remain constant during approaching 4) f will remain constant during receding
View Solution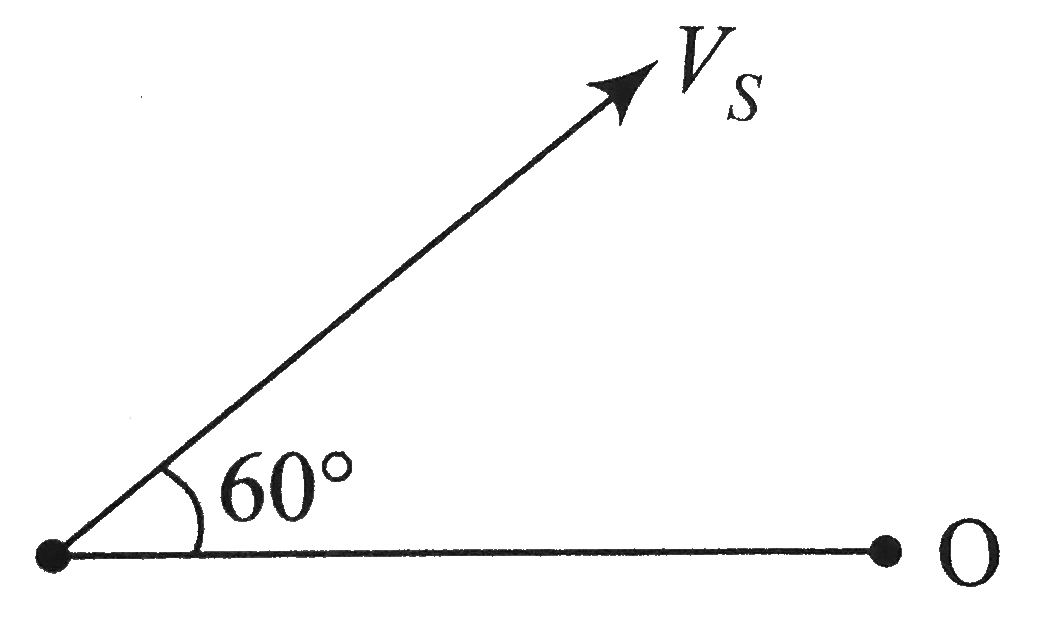
A source of sound S emitting waves of frequency 100Hz and an observer O are located at some distance from each other. The source is moving with a speed of 19.4ms−1 at an angle of 60∘ with the source observer line as shown in the figure. The observer is at rest. The apparent frequency observed by the observer (velocity of sound in air 330ms−1) isView Solution

