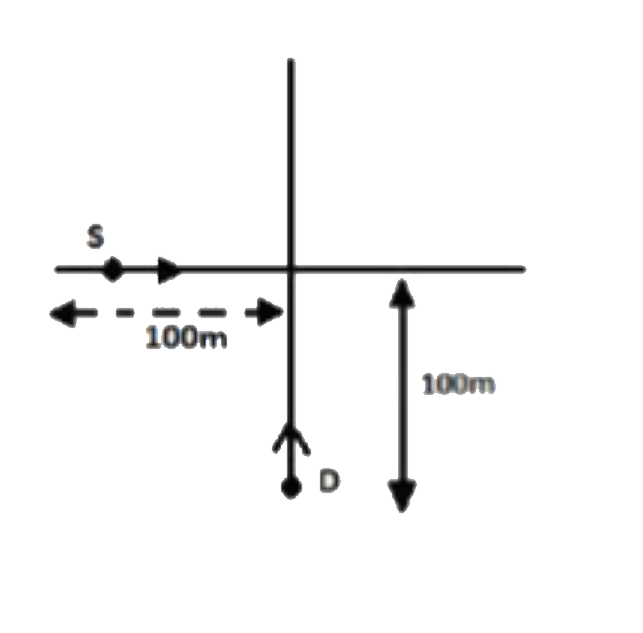
A source and detector both start moving simultaneously from the position shown in the figure, one along x-axis and the other along y-axis with speeds 40 and 30 respectively. If n is the frequency of the source then the graph between the apparent frequency n' observed by detector and time t would be [assume that source and detector do not collide]
![A source and detector both start moving simultaneously from the position shown in the figure, one along x-axis and the other along y-axis with speeds 40 ms^(-1) and 30 ms^(-1) respectively. If n is the frequency of the source then the graph between the apparent frequency n' observed by detector and time t would be [assume that source and detector do not collide]](https://d10lpgp6xz60nq.cloudfront.net/physics_images/NTA_JEE_MOK_TST_15_E01_017_Q01.png)
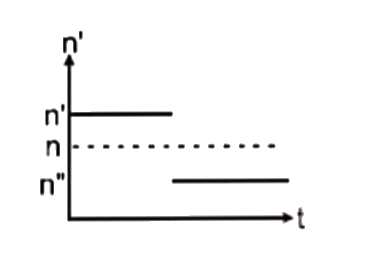
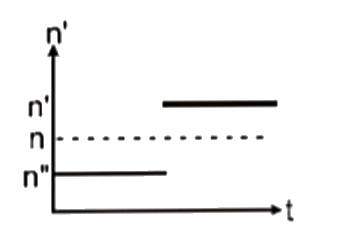
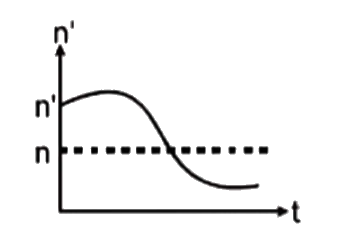
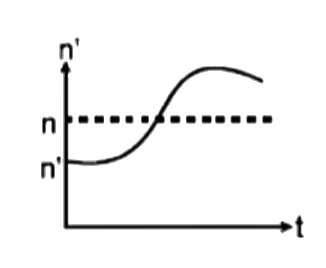
The correct Answer is:A
Step by step video & image solution for A source and detector both start moving simultaneously from the position shown in the figure, one along x-axis and the other along y-axis with speeds 40 ms^(-1) and 30 ms^(-1) respectively. If n is the frequency of the source then the graph between the apparent frequency n' observed by detector and time t would be [assume that source and detector do not collide] by Physics experts to help you in doubts & scoring excellent marks in Class 12 exams.
Updated on:21/07/2023Similar Questions
source and observer both start moving simultaneously from origion one along y - axis with speed of source = 2 (speed of observer ). The graph between the apparent frequency observed by observer (f) and time (t) would be
View SolutionSource and observer start moving simulatneously along x and y-axis respectively. The speed of source is twice the speed of observer V0. If the ratio of observer frequency to the frequency of the source is 0.75, find the velocity of sound.
View SolutionSource and observer start moving simulatneously along x and y-axis respectively. The speed of source is twice the speed of observer V0. If the ratio of observer frequency to the frequency of the source is 0.75, find the velocity of sound.
View SolutionThe figure shows the location of a source and detector at time t = 0. The source and detector are moving with velocities vs=5ˆims−1andvD=10ˆjms−1 respectively . The frequency of signals received by the detector at the moment when the source cros the origin is (the frequency of the source is 100 Hz . Velocity bof sound 330ms−1 .)
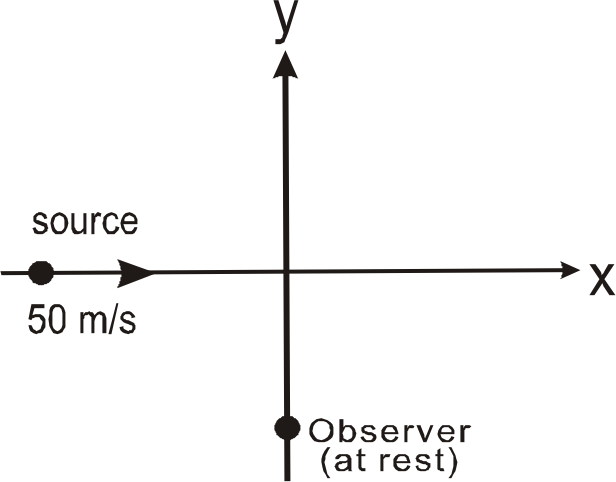
View SolutionA sound source moving with speed 50 m/s along x-axis and observer at rest on y-axis.If the frequency observed by observer when source crosses the origin is 96 Hz, then the original frequency of source is :(speed of sound is given medium is 200 m/s)
View SolutionOn the same path, the source and observer are moving such a way that the distance between these two increases with the time. The speeds of source and observer are same and equal to 10ms−1 with respect to the ground while no wind in blowing. The apparent frequency received by observer is 1950Hz then the original frequency must be (the speed of sound in present medium is 340m/s
View SolutionA source of frequency f is moving towards the observer along the line SO with a constant velocity υs as shown in figure. Plot f' versus t graph . Where f' is the changed frequency observed by the observer.

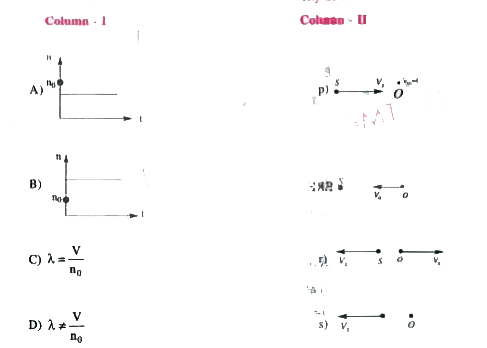
View SolutionThe following figures in the Column-II indicate the direction of motion of source and the observer match the corresponding graph in Column-I drawn between the apparent frequency. and time V0 is the velocity of observer Vs the velocity of source, and n0 the frequency of the source
View SolutionTwo cars A and B are moving away from each other in opposite directions. Both the cars are moving with a speed of 20ms−1 with respect to the ground. If an observer in car A detects a frequency 2000 Hz of the sound coming from car B, what is the natural frequency of the sound source in car B? (Speed of sound in air =340ms−1)
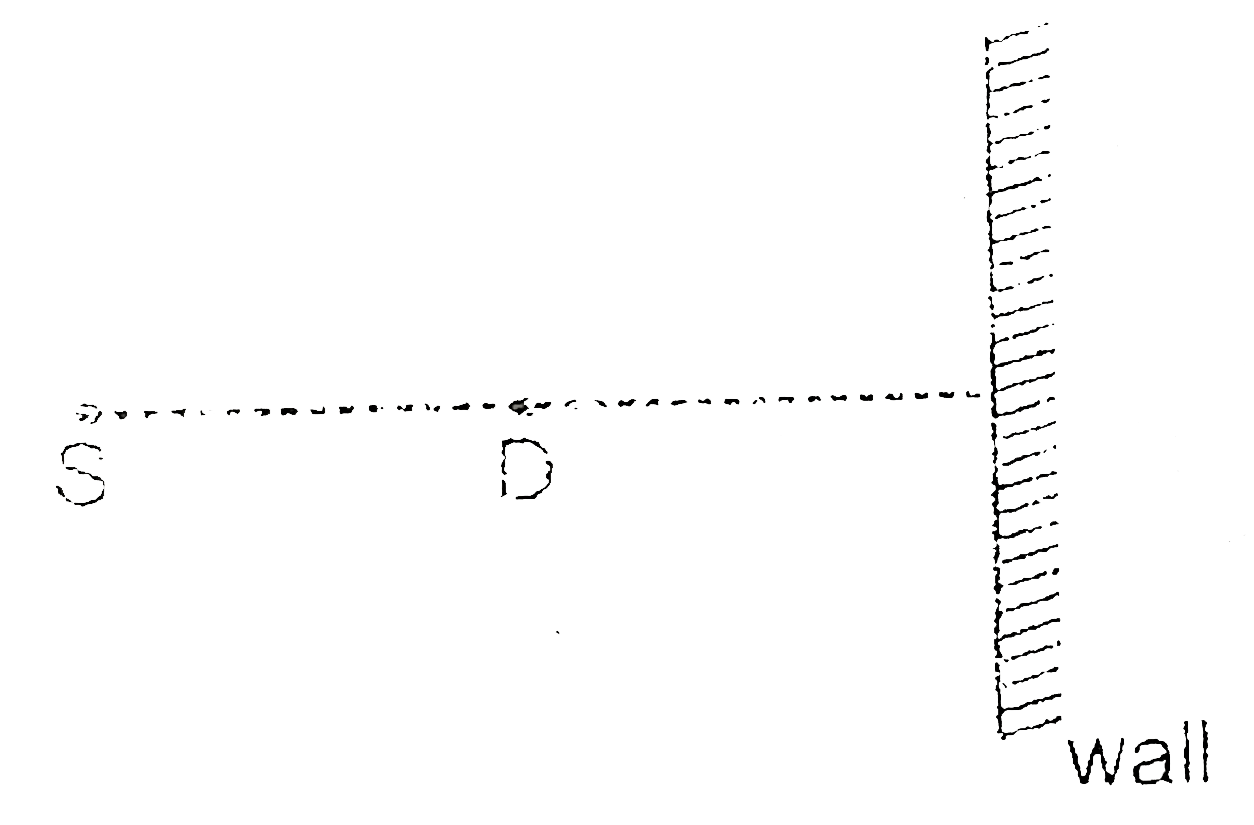
View SolutionA sound sources, detector and a movable wall are arranged as shown in figure. In this arrangement detectir us detacting the maximum intensity. If the speed of sound is 330m/s in air and frequency of source is 660Hz, then find the minimum distance by which the wall should be moved away from source, so that detector dtects minimmum intensity.
View Solution
