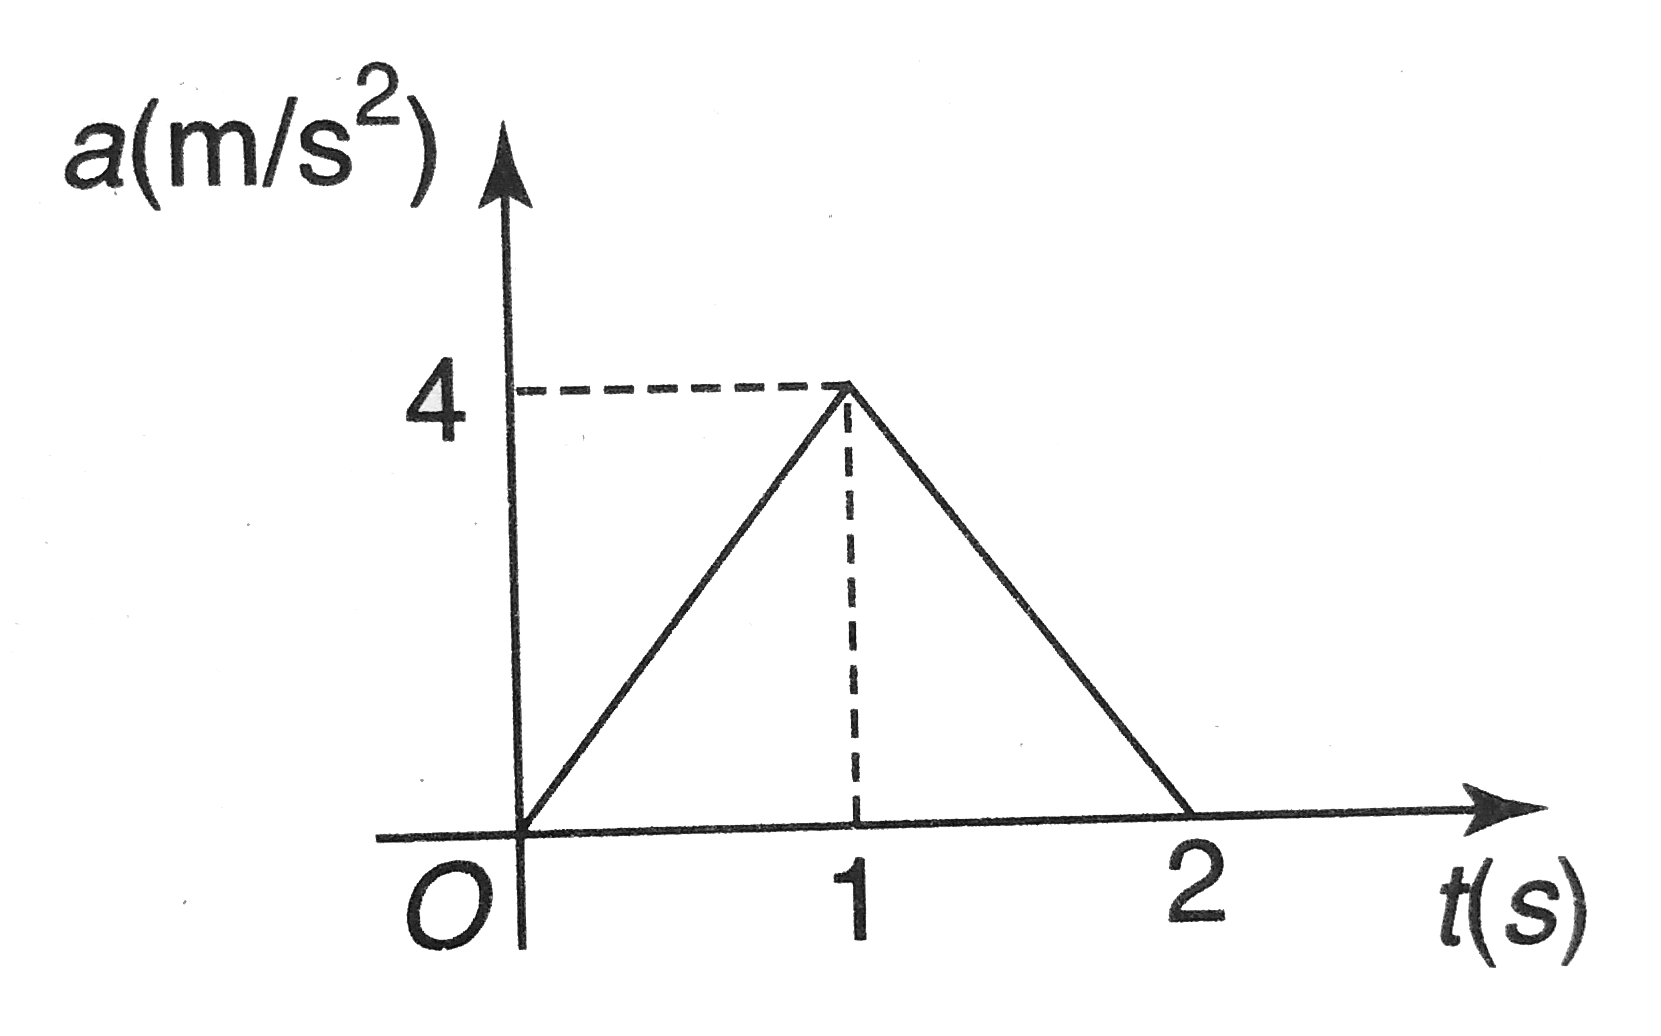
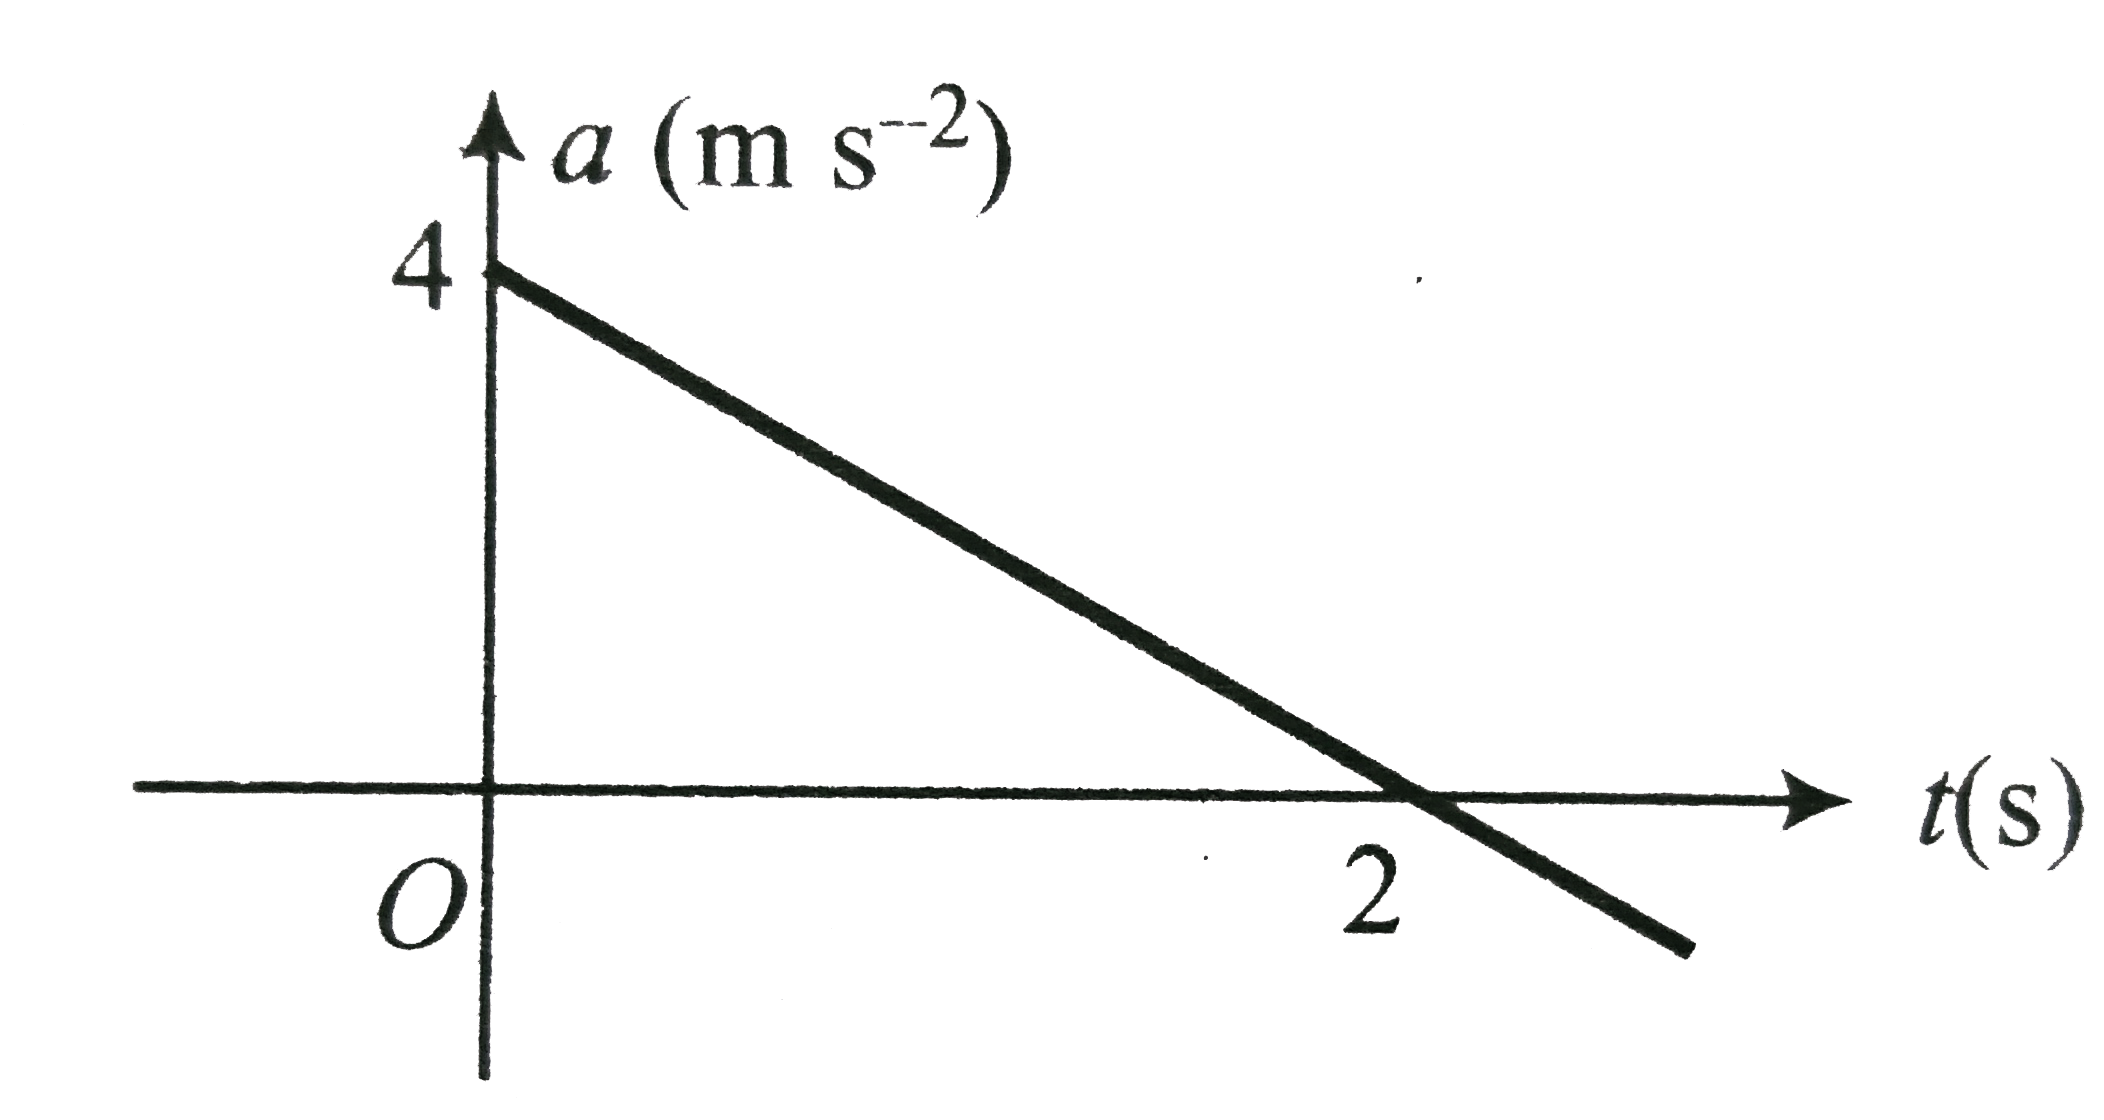
The acceleration-time graph of a particle moving in a straight line is as shown in figure. The velocity of the particle at time t=0 is 2m/s. The velocity after 2 seconds will be
6m/s
4m/s
2m/s
8m/s
The correct Answer is:A
Area under a−t graph gives the change in velocity
(dv=adt)
vf=vi=12×2×4=4m/s
vf=vi+4=2+4=6m/s.
Topper's Solved these Questions
- GENERAL KINEMATICS AND MOTION IN ONE DIMENSIONBook:A2ZChapter:GENERAL KINEMATICS AND MOTION IN ONE DIMENSIONExercise:Problem Based On Mixed Concepts
Explore 30 Videos
- GENERAL KINEMATICS AND MOTION IN ONE DIMENSIONBook:A2ZChapter:GENERAL KINEMATICS AND MOTION IN ONE DIMENSIONExercise:Assertion Reasoning
Explore 20 Videos
- GENERAL KINEMATICS AND MOTION IN ONE DIMENSIONBook:A2ZChapter:GENERAL KINEMATICS AND MOTION IN ONE DIMENSIONExercise:Relative Motion In One Dimension
Explore 20 Videos
- FLUID MECHANICSBook:A2ZChapter:FLUID MECHANICSExercise:Chapter Test
Explore 29 Videos
- GRAVITATIONBook:A2ZChapter:GRAVITATIONExercise:Chapter Test
Explore 29 Videos
Similar Questions
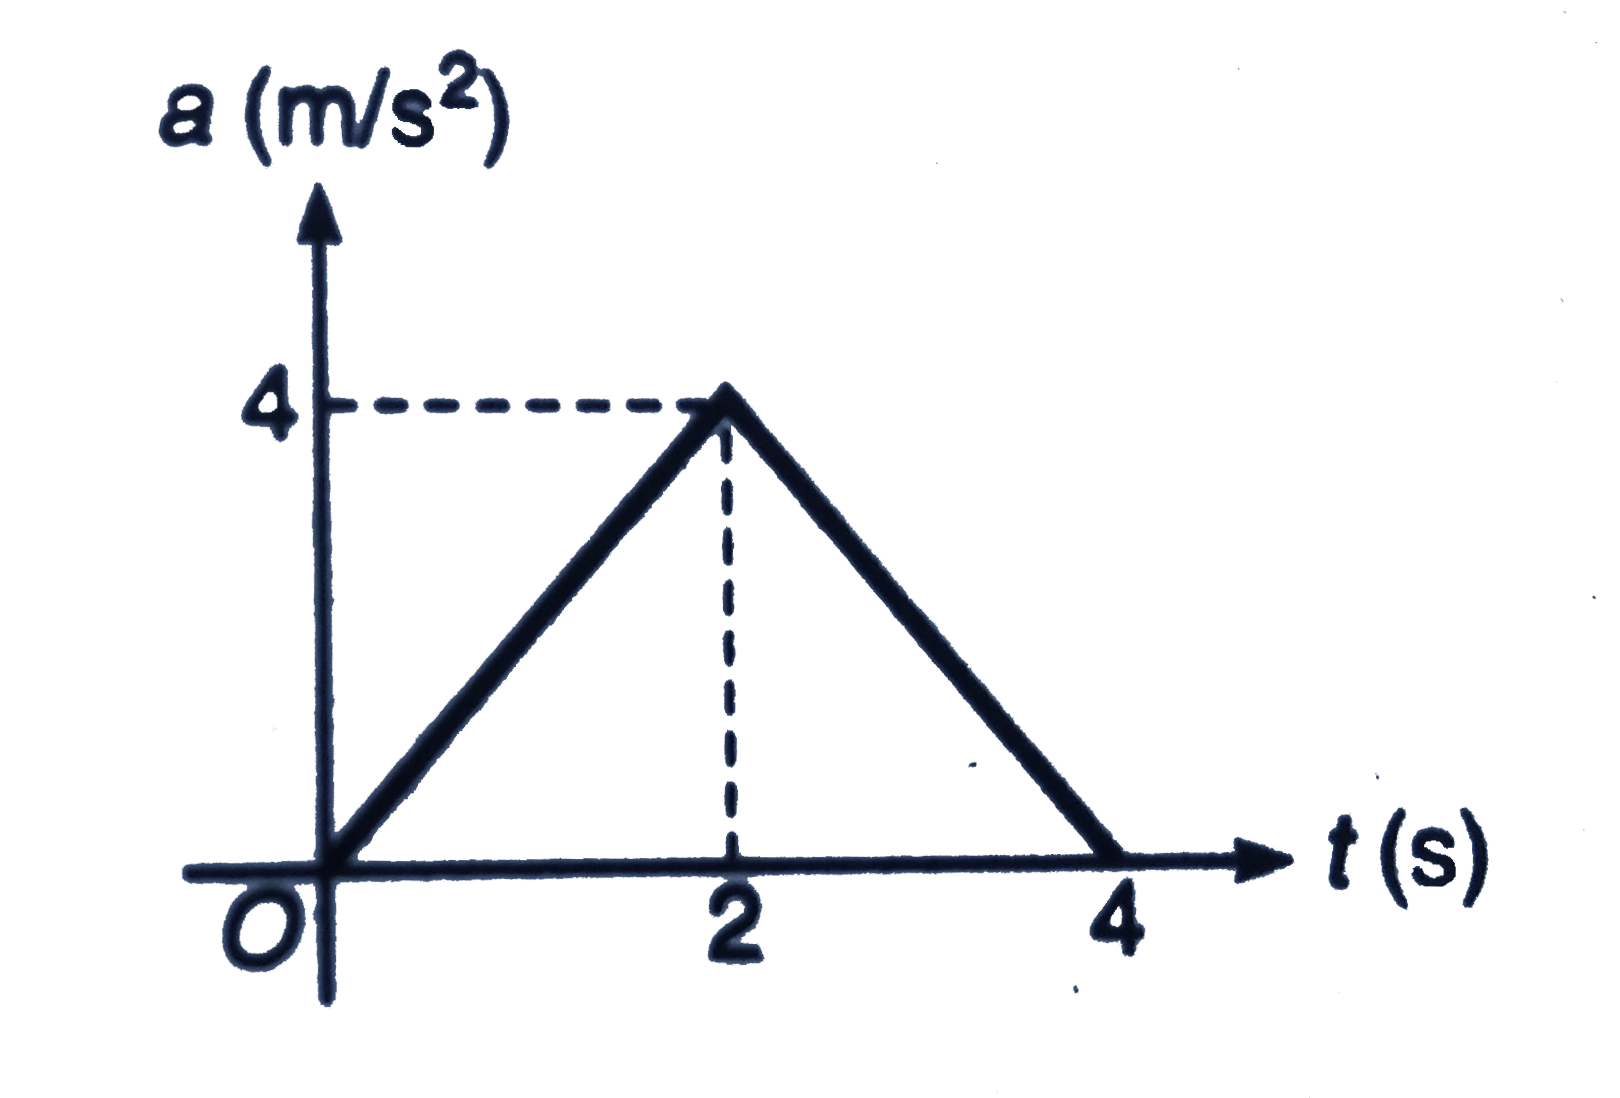
Accleration-time graph of a particle moving in a straight line is as shown in Fig. Velocity of particle at time t=0 is 2m/s. Find the velocity at the end of fourth second.
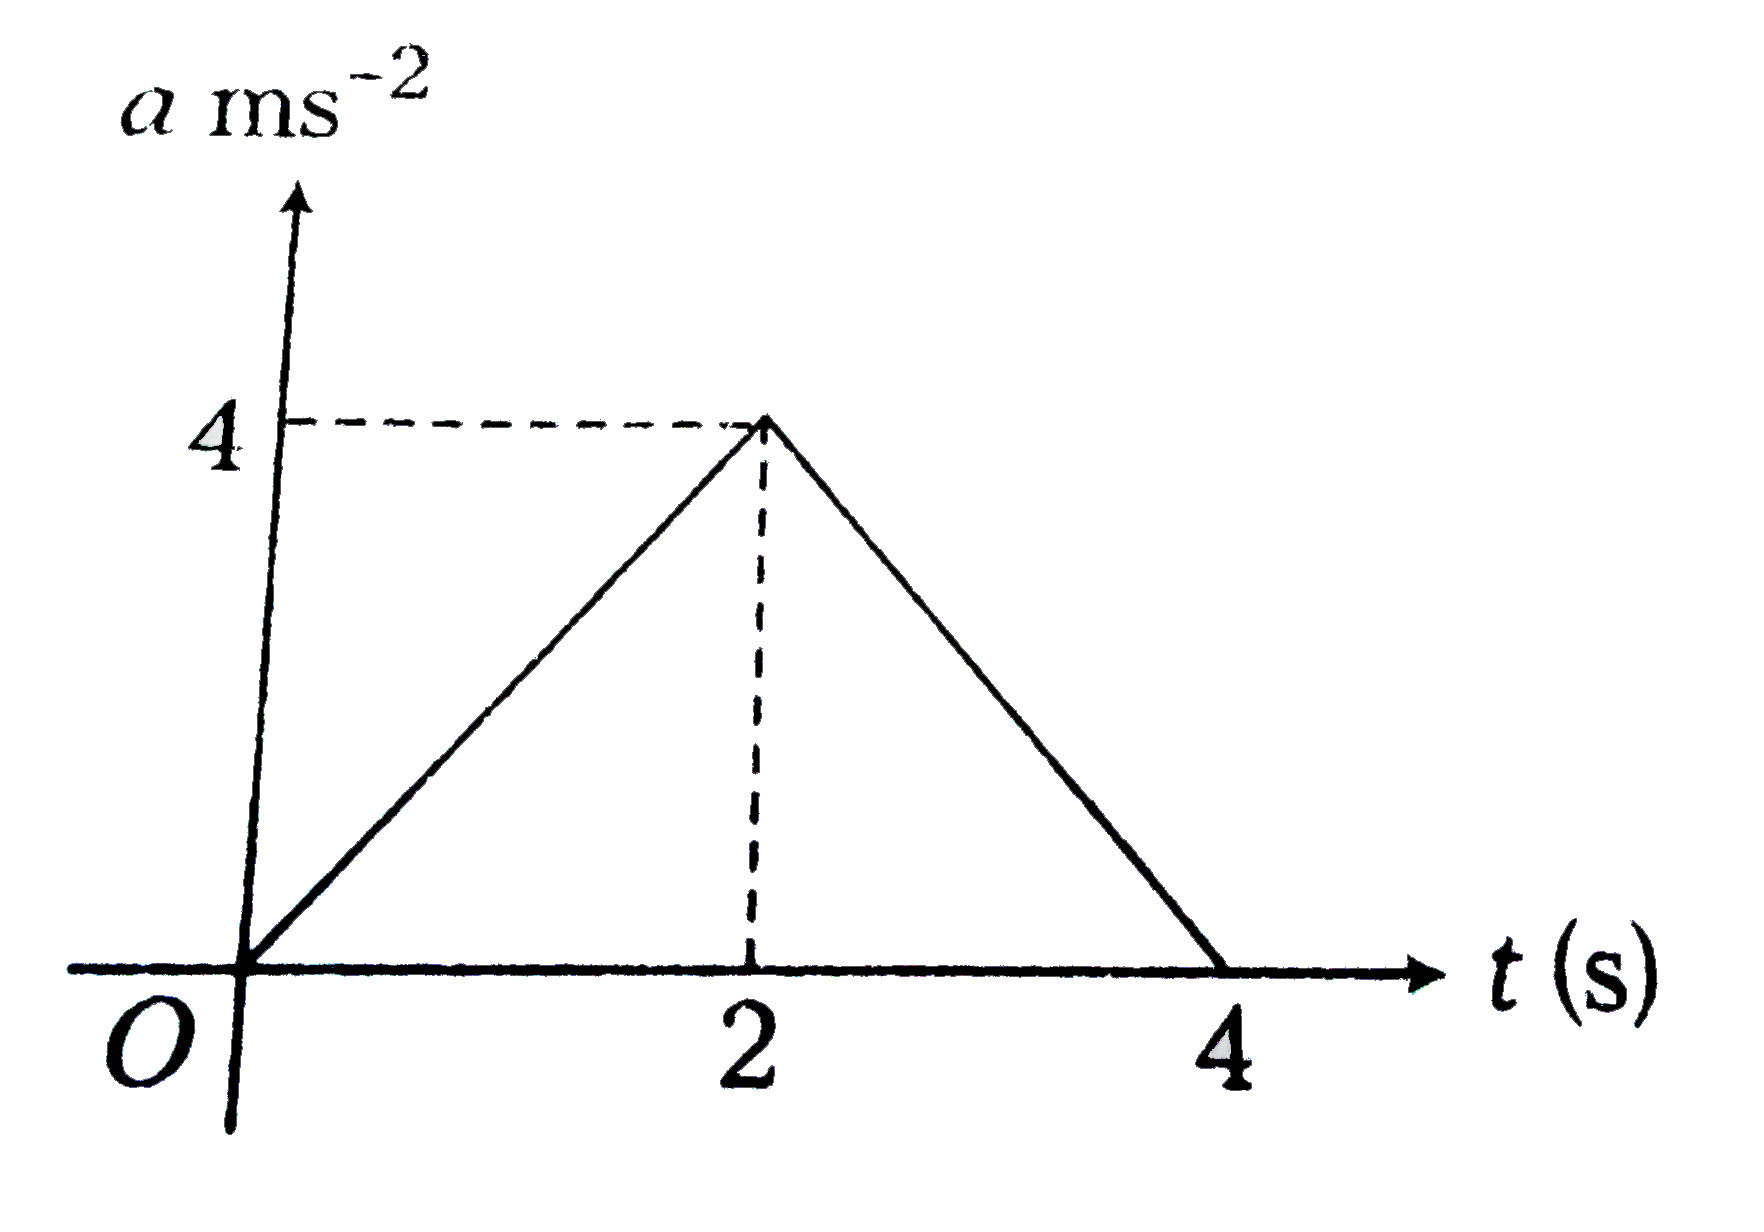
View SolutionAcceleration - time graph of a particle moving in a straight line is shown in figure. Velocity of particle at time t = 0 is 2ms−1. Find velocity at the end of fourth second.
View Solution
Knowledge Check
Displacement time graph of a particle moving in a straight line is a shown in figure.
 Ain region A acceleration is positiveBin region B acceleration is negativeCin region C acceleration is positiveDin region D acceleration is negative
Velocity displacement graph of a particle moving in a straight line is as shown in figure.
 Amagnitude of acceleration of particle is decreasingBmagnitude of acceleration of particlre is increasingCacceleration versus displacement graph straight lineDacceleration versus displacement graph is parabola
The velocity -time (v−t) graph of a particle moving in a straight line is shown in figure. The acceleration of the particle at t=9 is:
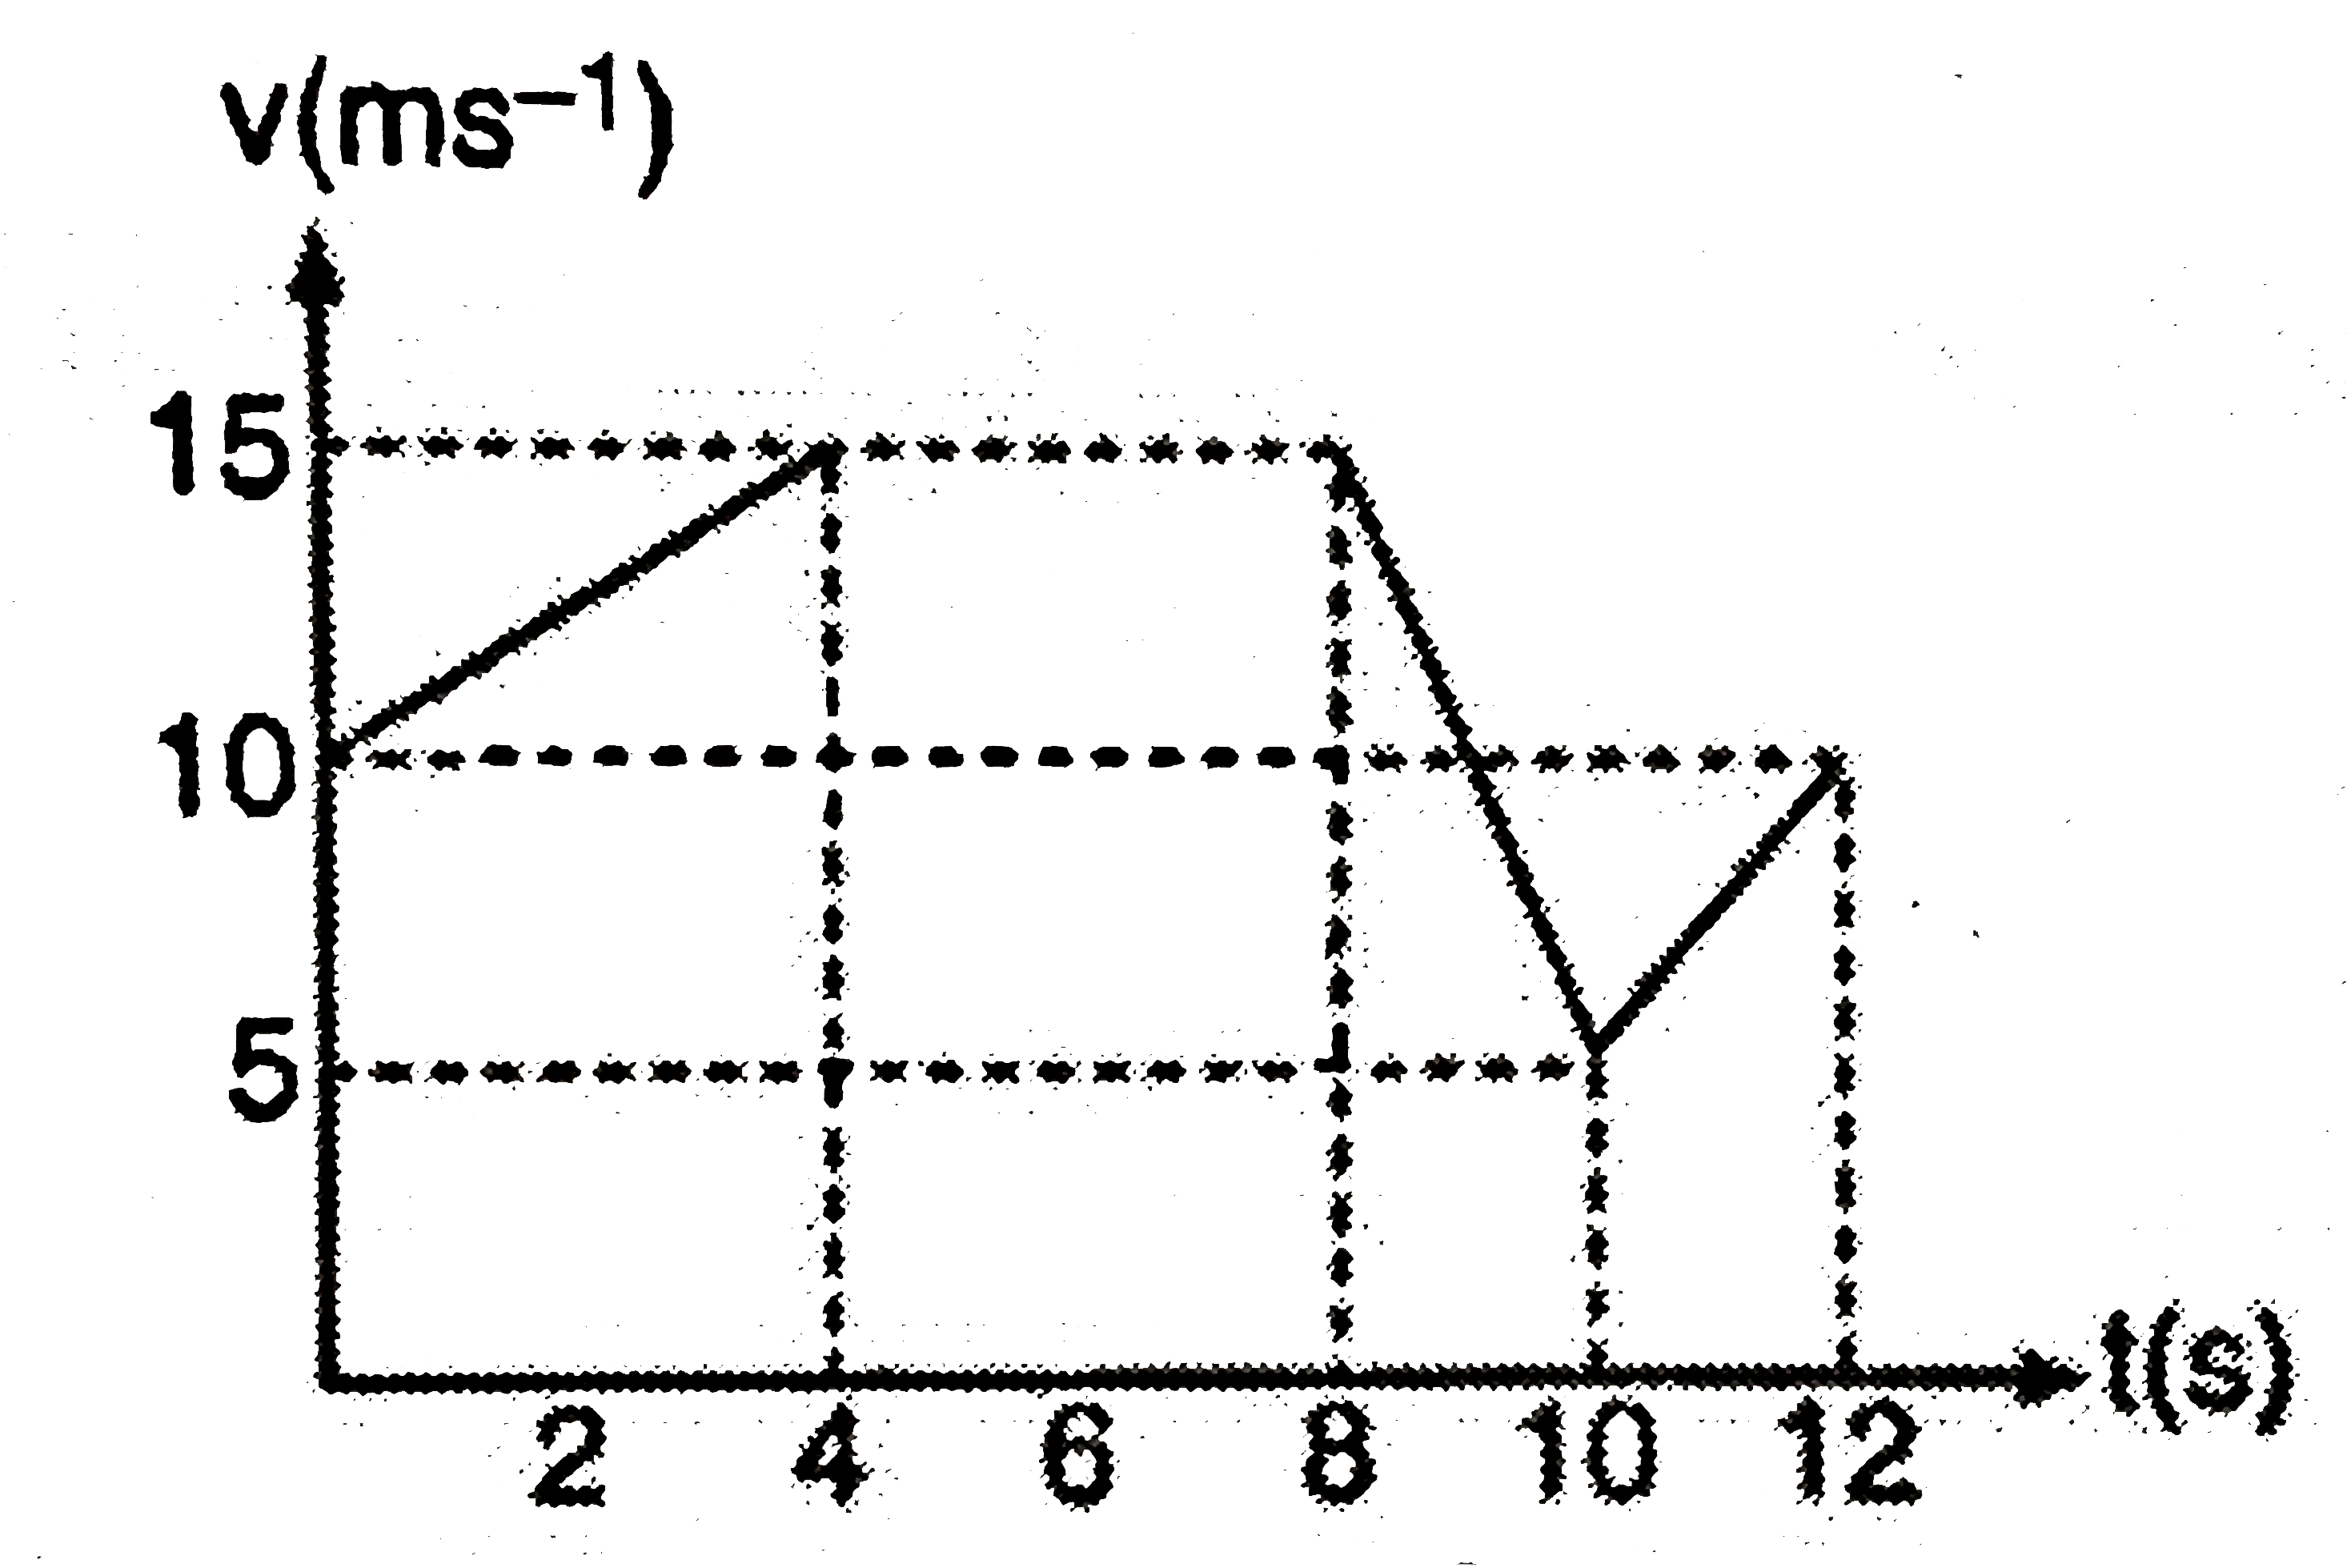 AzeroB5ms−2C−5ms2D−2ms−2
The velocity-time plot for a particle moving on a straight line is shown in the figure, then
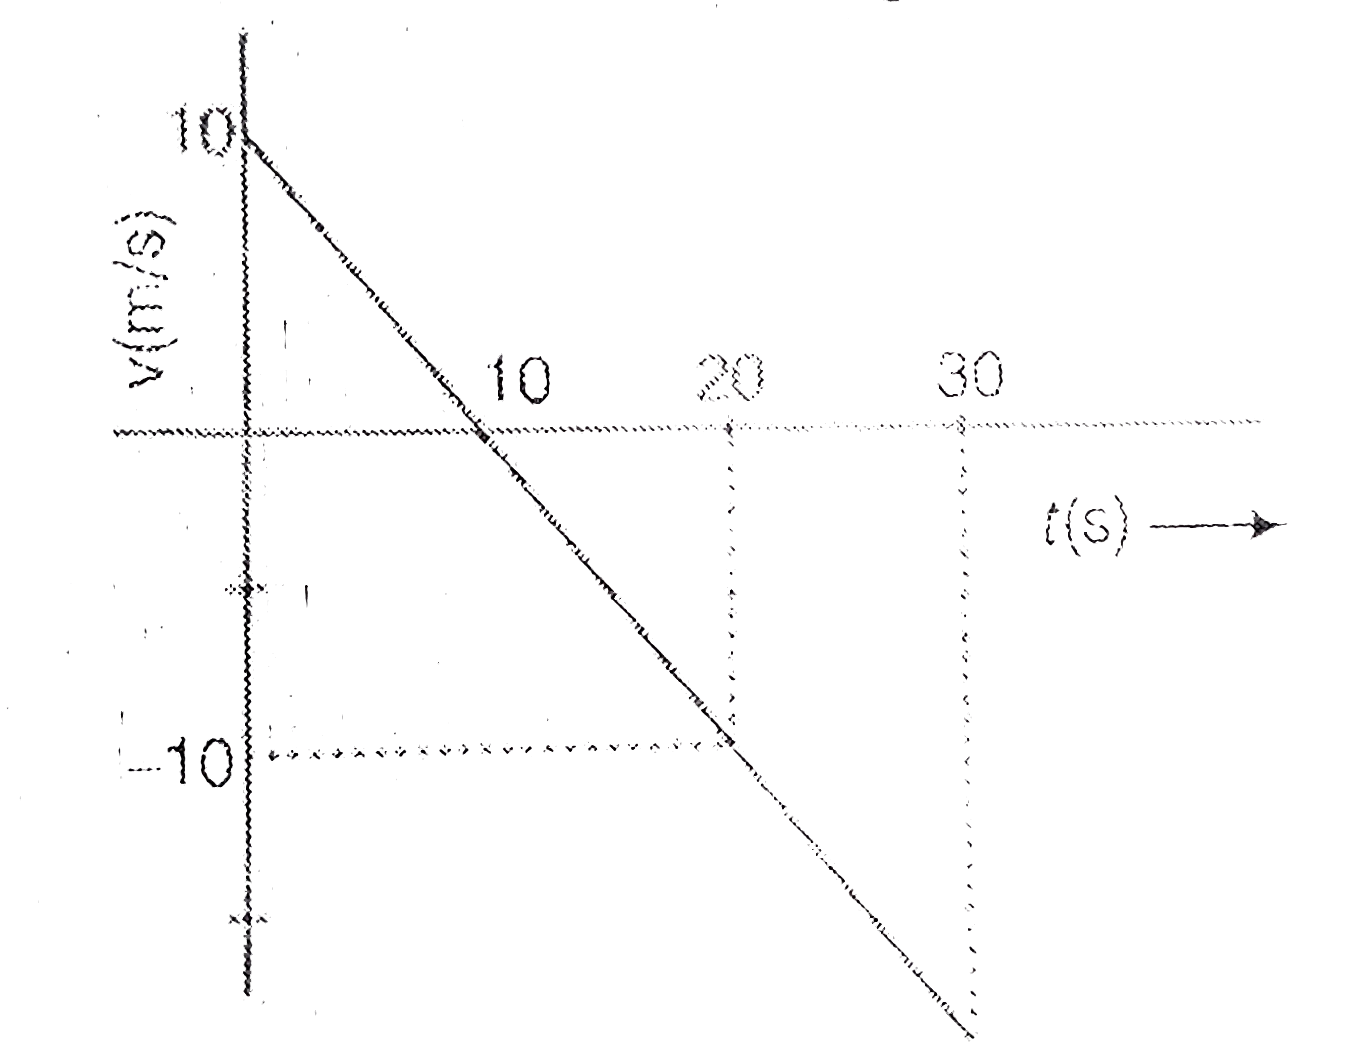
View SolutionThe velocity-time plot for a particle moving on a straight line is shown in figure.
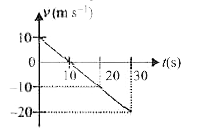
View SolutionThe acceleration versus time graph of a particle moving in a straight line is show in figure. The velocity-time graph of the particle would be
 .
.
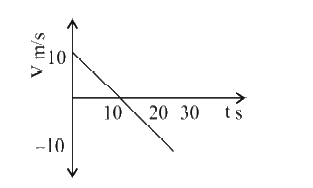
View SolutionThe velocity- time plot for a particle moving on a straight line is shown in the figure
View SolutionThe acceleration-time graph of a particle moving along a straight line is as shown in figure. At what time the particle acquires its initial velocity ?

View Solution
