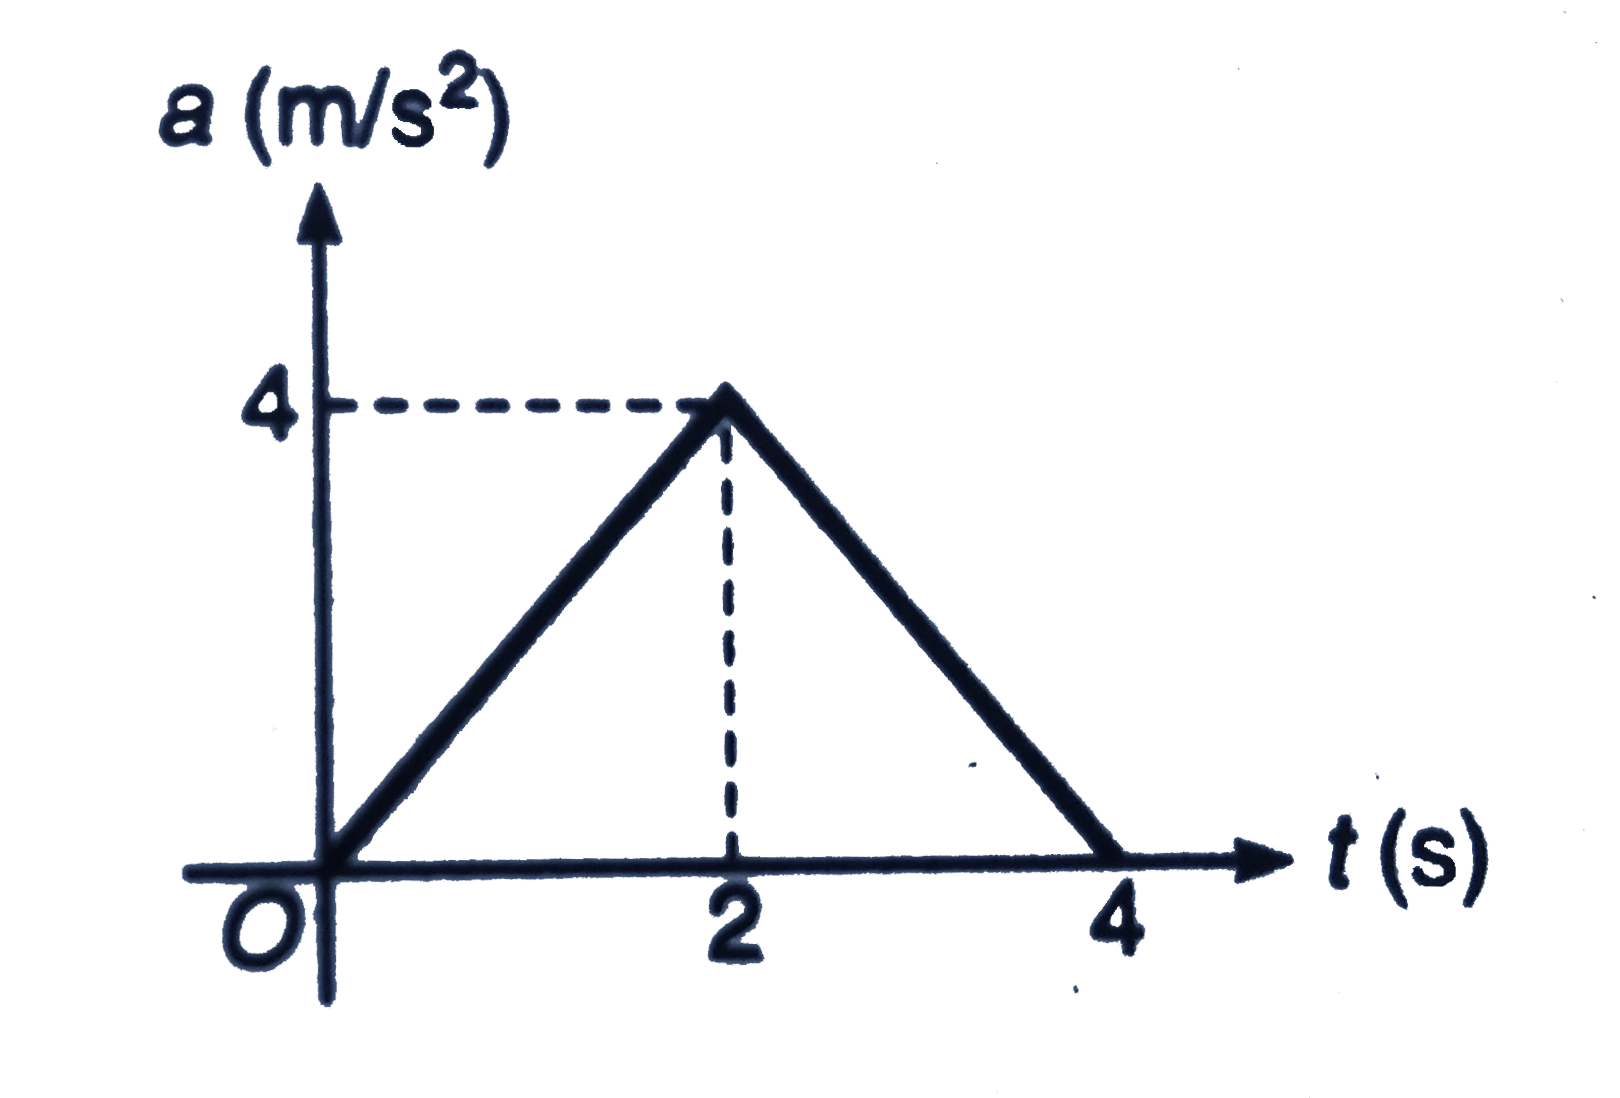
Acceleration - time graph of a particle moving in a straight line is shown in figure. Velocity of particle at time t = 0 is 2ms−1. Find velocity at the end of fourth second.
Video Solution
Text Solution
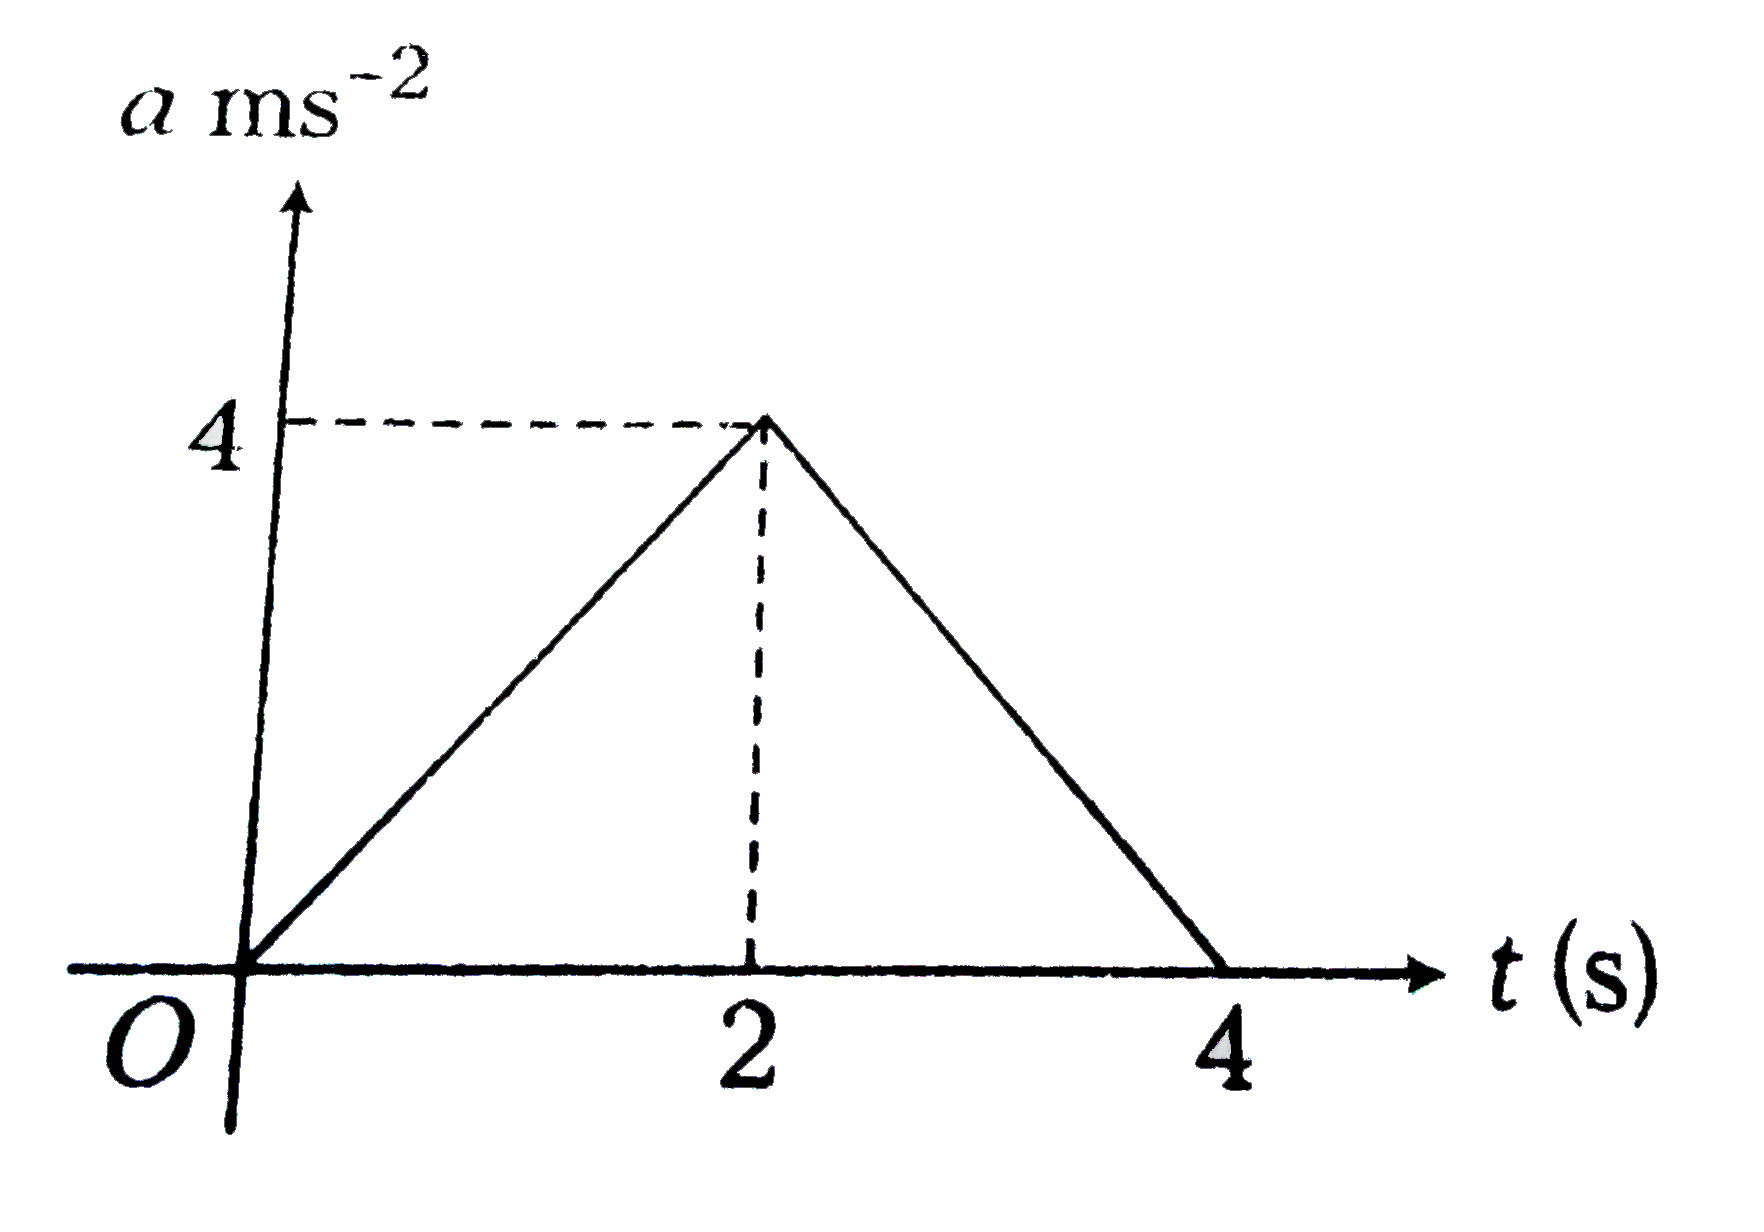
According to acceleration time - graph, dv = s dt
or change in elocity = area under a - t graph
Hence, vf−vi=12(4)(4)=8ms−1
∴vf=vi+8=(2+8)ms−1=10ms−1
|
Topper's Solved these Questions
- MOTION IN A PLANEBOOK - DC PANDEYCHAPTER - MOTION IN A PLANEEXERCISE - Check point 3.1
10 Videos
- MOTION IN A PLANEBOOK - DC PANDEYCHAPTER - MOTION IN A PLANEEXERCISE - Check point 3.2
10 Videos
- MOTIONBOOK - DC PANDEYCHAPTER - MOTIONEXERCISE - Medical entrances gallery
19 Videos
- PROJECTILE MOTIONBOOK - DC PANDEYCHAPTER - PROJECTILE MOTIONEXERCISE - Level - 2 Subjective
10 Videos
Similar Questions
Knowledge Check
Displacement time graph of a particle moving in a straight line is a shown in figure.
 Ain region A acceleration is positiveBin region B acceleration is negativeCin region C acceleration is positiveDin region D acceleration is negative
The acceleration-time graph of a particle moving in a straight line is as shown in figure. The velocity of the particle at time t=0 is 2m/s. The velocity after 2 seconds will be
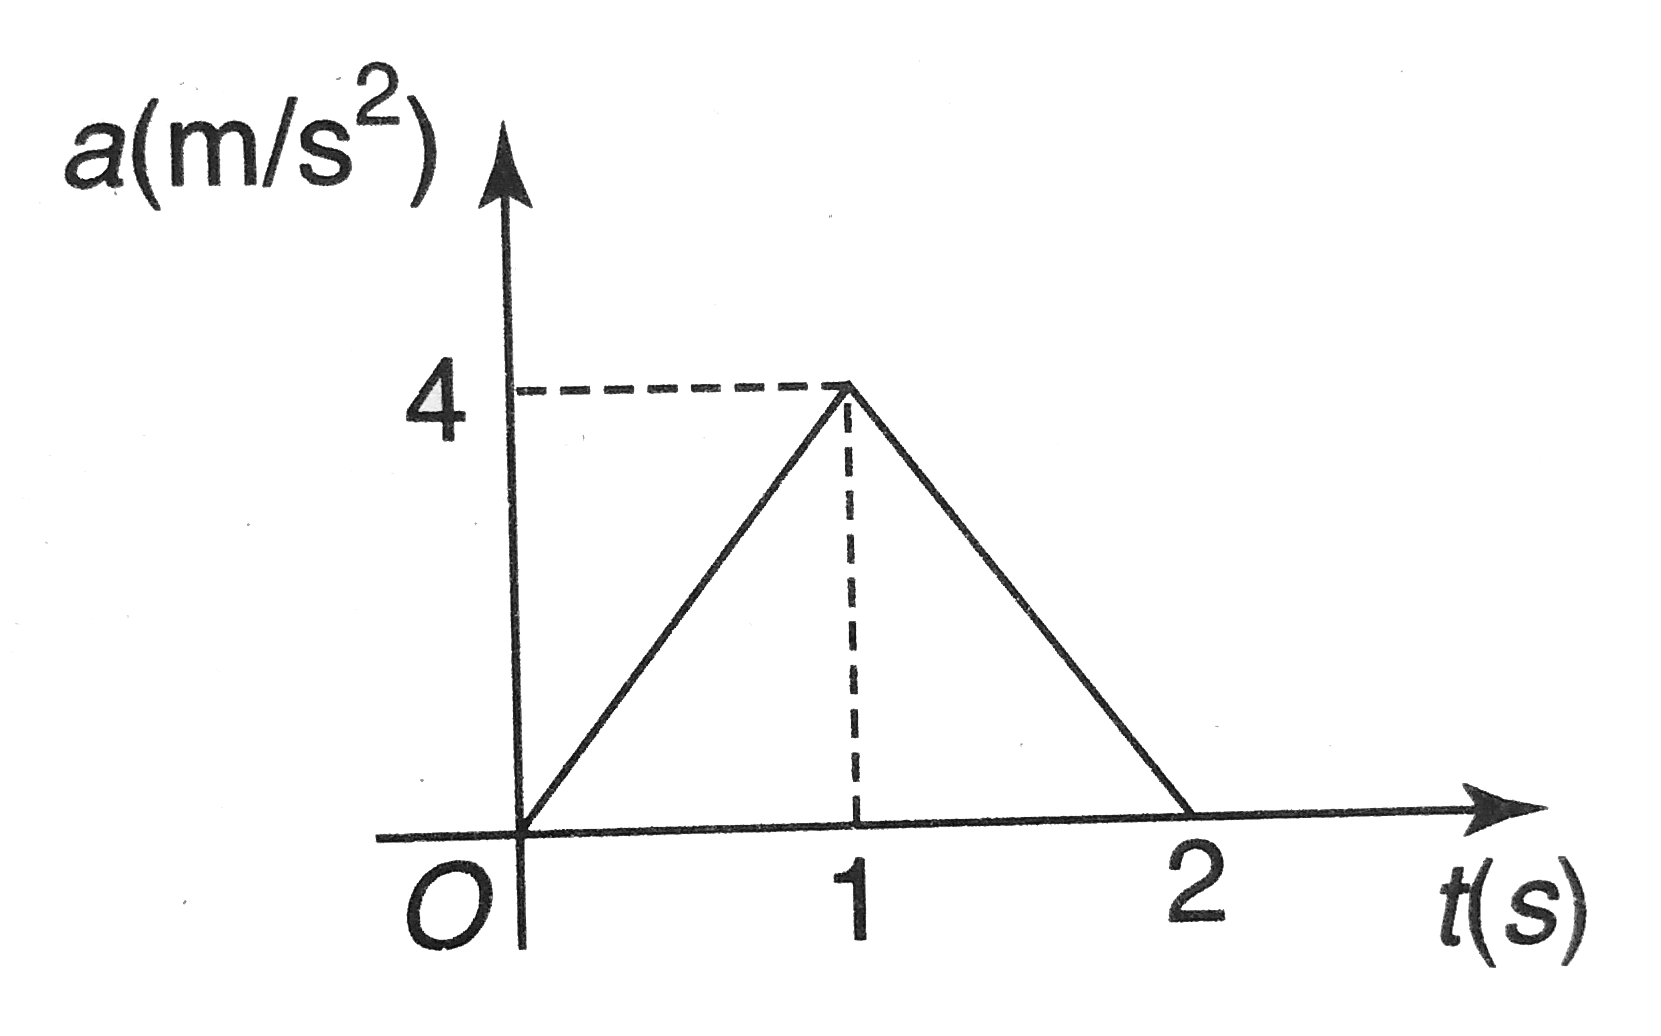 A6m/sB4m/sC2m/sD8m/s
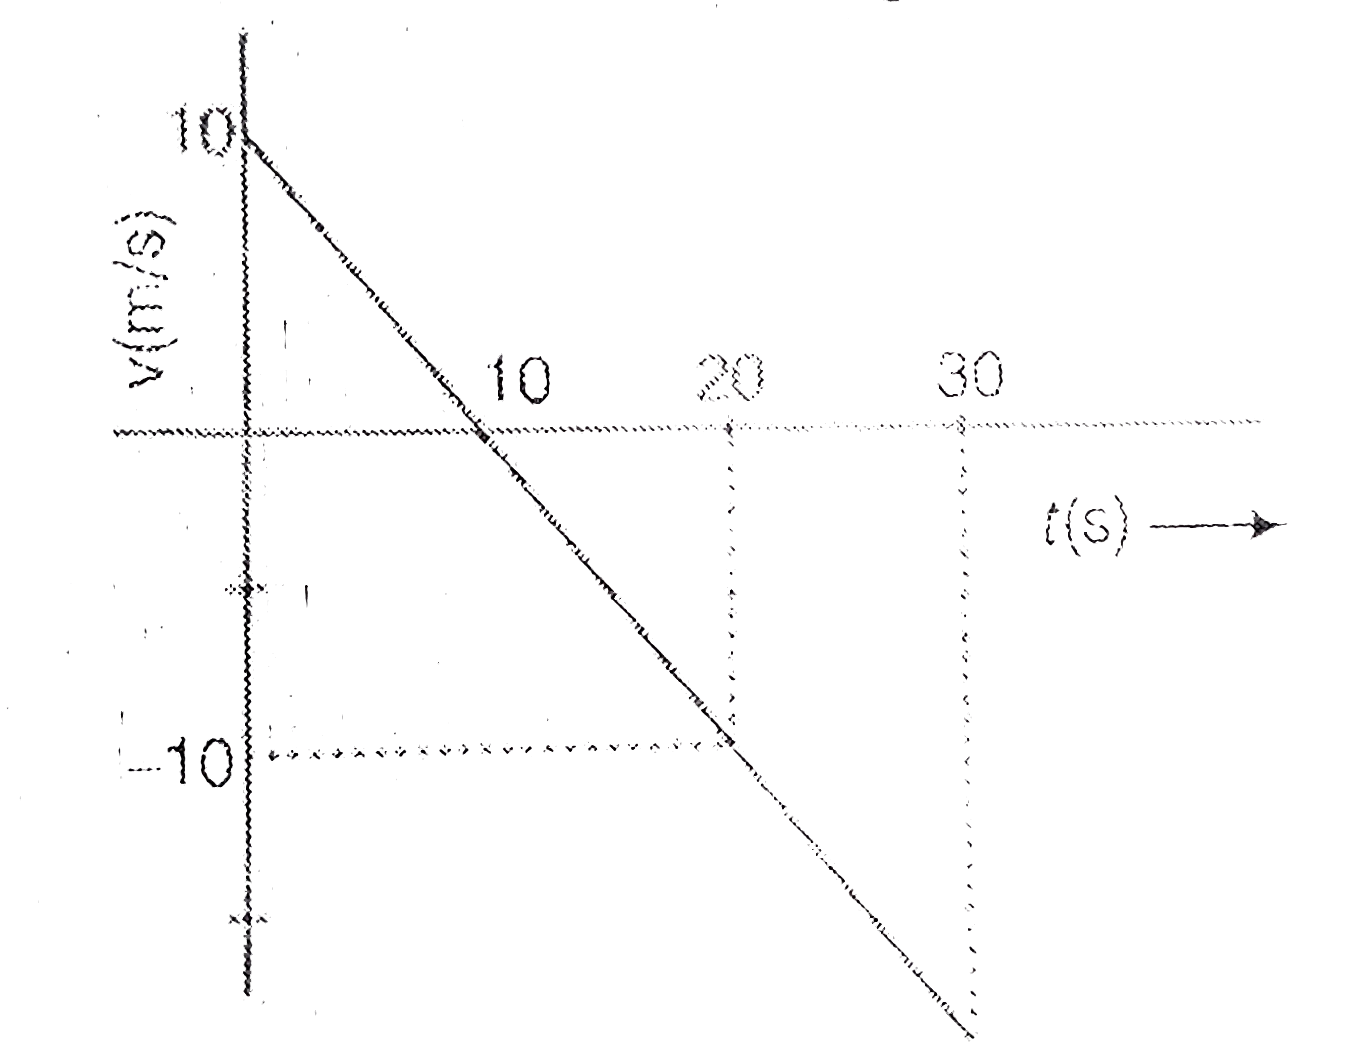
The velocity-time plot for a particle moving on a straight line is shown in figure.
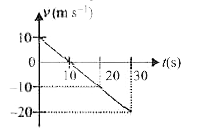 AThe particle has a constant acceleration.BThe particle has never tumed around.CThe particle has zero displacement.DThe average speed in the interval 0 to 10 s is the same as the average speed in the interval 10s to 20 s.
Velocity displacement graph of a particle moving in a straight line is as shown in figure.

View SolutionThe velocity-time graph of a body moving in a straight line is shown in the figure.
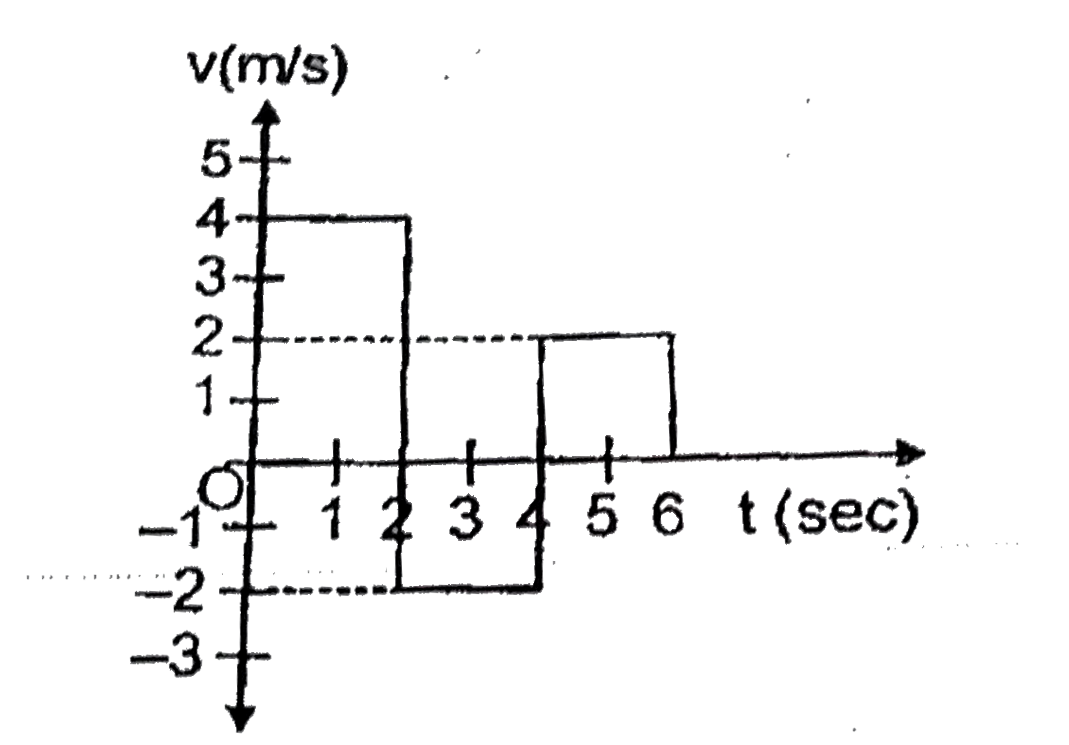
View SolutionThe velocity time plot for a particle moving on straight line is shown in the figure.

View SolutionThe velocity- time plot for a particle moving on a straight line is shown in the figure
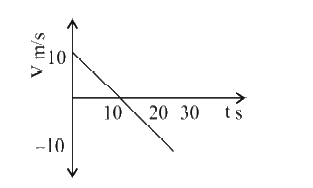
View SolutionThe acceleration-time graph of a particle moving along a straight line is as shown in figure. At what time the particle acquires its initial velocity ?

View Solution

