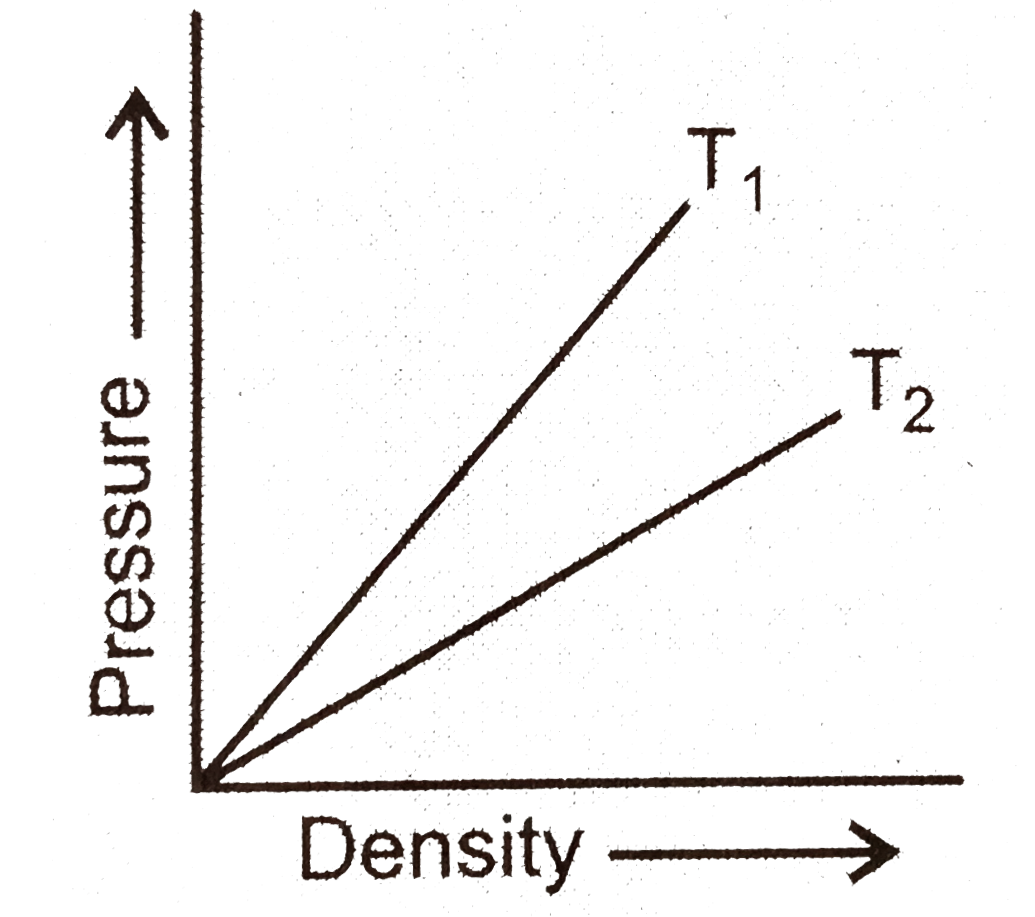
The adjoining fgure shows graph of pressure and volume of a gas at two temperatures T1 and T2 Which one the following is correct 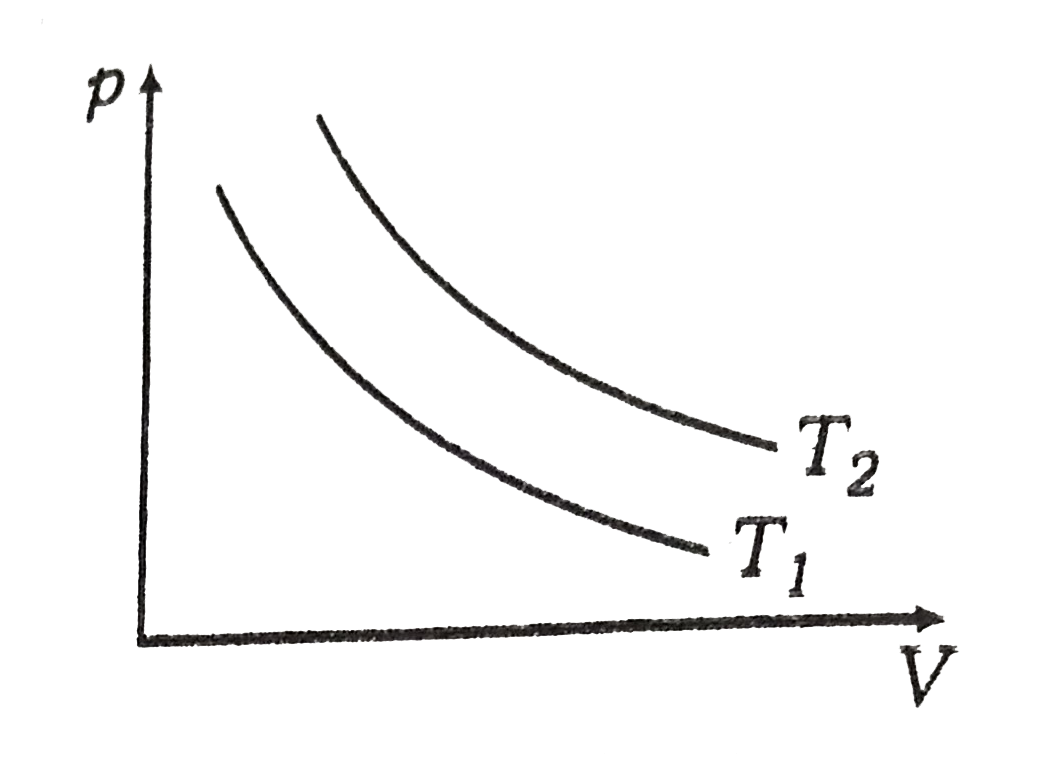
T1>T2
T1=T2
T1<T2
Nothing can be said about temperatures
The correct Answer is:C
For a given pressure, volume will be more if temperatuer is more (Charle's law) 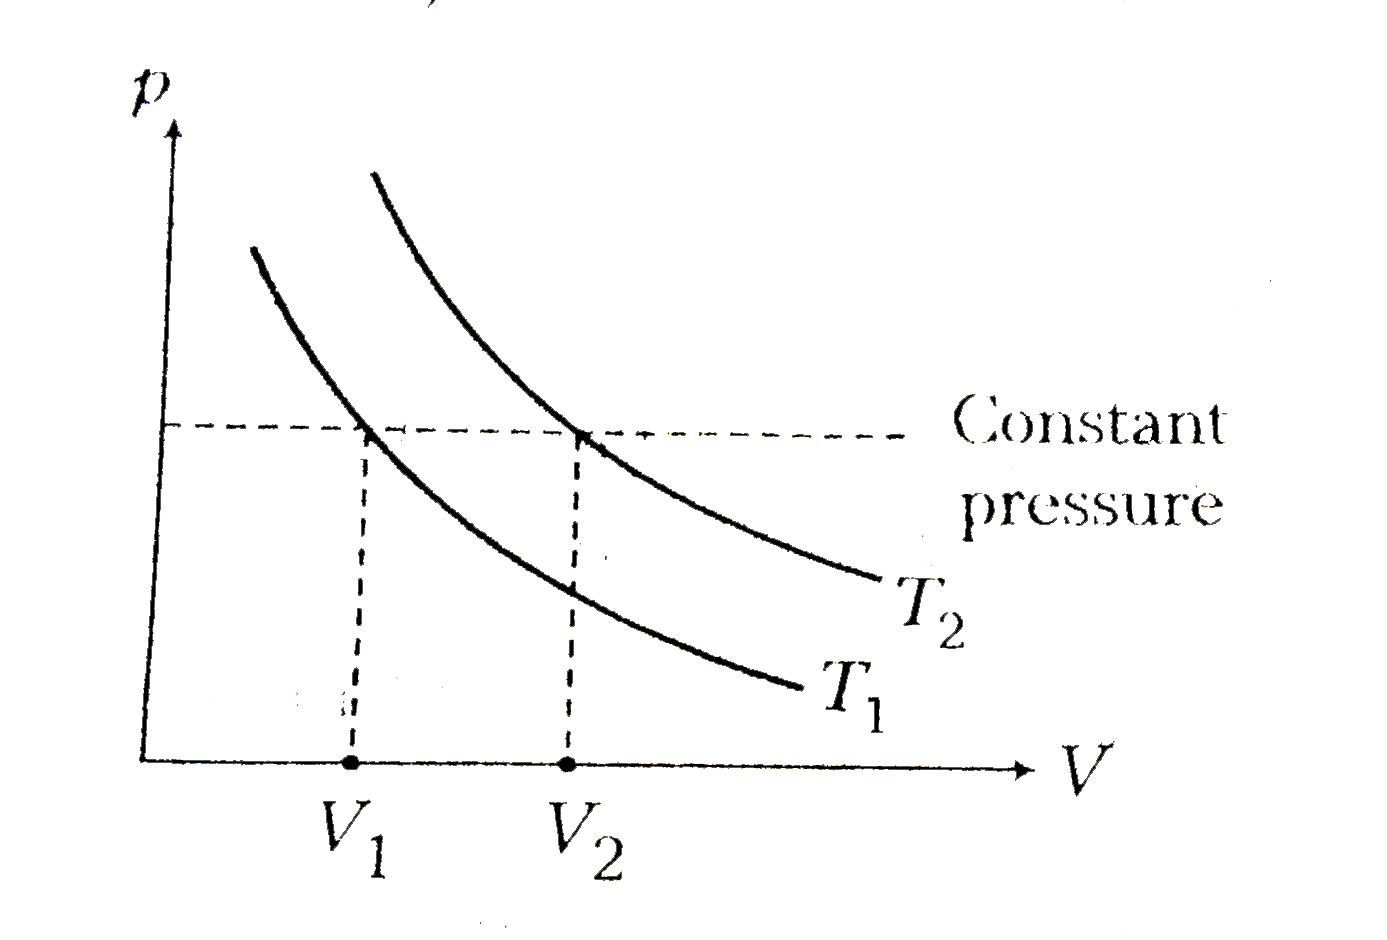
From the graph, it is clear that V2>V1⇒T2>T1
Topper's Solved these Questions
- THERMOMETRY THERMAL EXPANSION AND KINETIC THEORY OF GASESBOOK - DC PANDEY ENGLISHCHAPTER - THERMOMETRY THERMAL EXPANSION AND KINETIC THEORY OF GASESEXERCISE - A Tacking it together
55 Videos
- THERMOMETRY THERMAL EXPANSION AND KINETIC THEORY OF GASESBOOK - DC PANDEY ENGLISHCHAPTER - THERMOMETRY THERMAL EXPANSION AND KINETIC THEORY OF GASESEXERCISE - B medical entrance special format questions
14 Videos
- THERMOMETRY THERMAL EXPANSION AND KINETIC THEORY OF GASESBOOK - DC PANDEY ENGLISHCHAPTER - THERMOMETRY THERMAL EXPANSION AND KINETIC THEORY OF GASESEXERCISE - Check point 14.3
20 Videos
- SUPERPOSITION OF WAVESBOOK - DC PANDEY ENGLISHCHAPTER - SUPERPOSITION OF WAVESEXERCISE - Level 2 Subjective
8 Videos
- THERMOMETRY,THERMAL EXPANSION & KINETIC THEORY OF GASESBOOK - DC PANDEY ENGLISHCHAPTER - THERMOMETRY,THERMAL EXPANSION & KINETIC THEORY OF GASESEXERCISE - Level 2 Subjective
9 Videos
Similar Questions
Knowledge Check
The voltage V and current I v graphs for a conductor at two different temperatures T1andT2 are shown in the figure. The relation between T1andT2 is
 AT1>T2BT1<T2CT1=T2DT1=1T2
The isothermal diagram of a gas at three different temperatures T1,T2andT3, is show in the given figure .Then
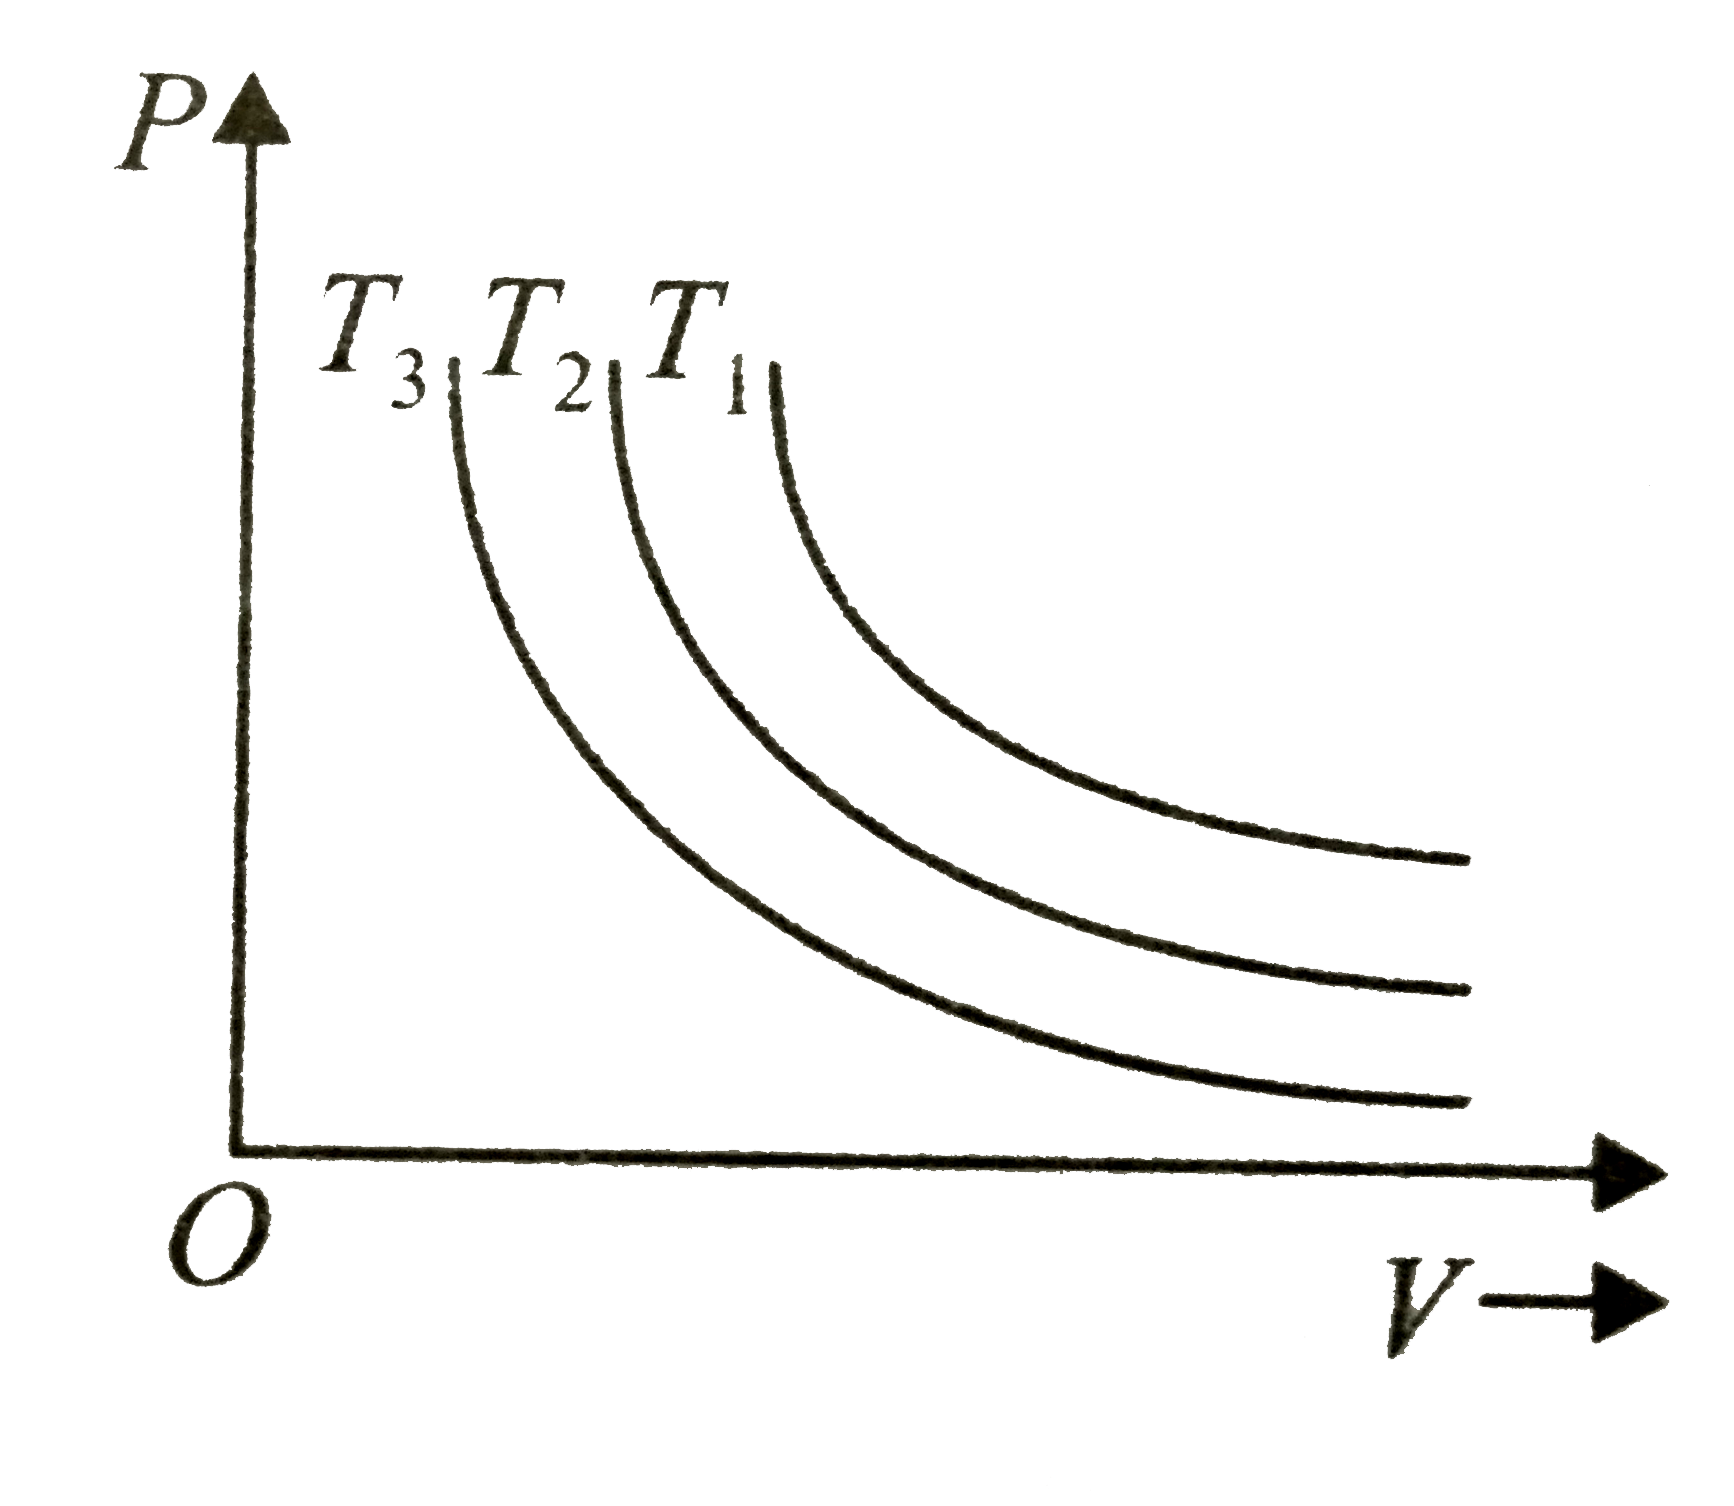 Aa.T1<T2<TBb. T1<T2>T3Cc.T1>T2>T3Dd.T1>T2<T3
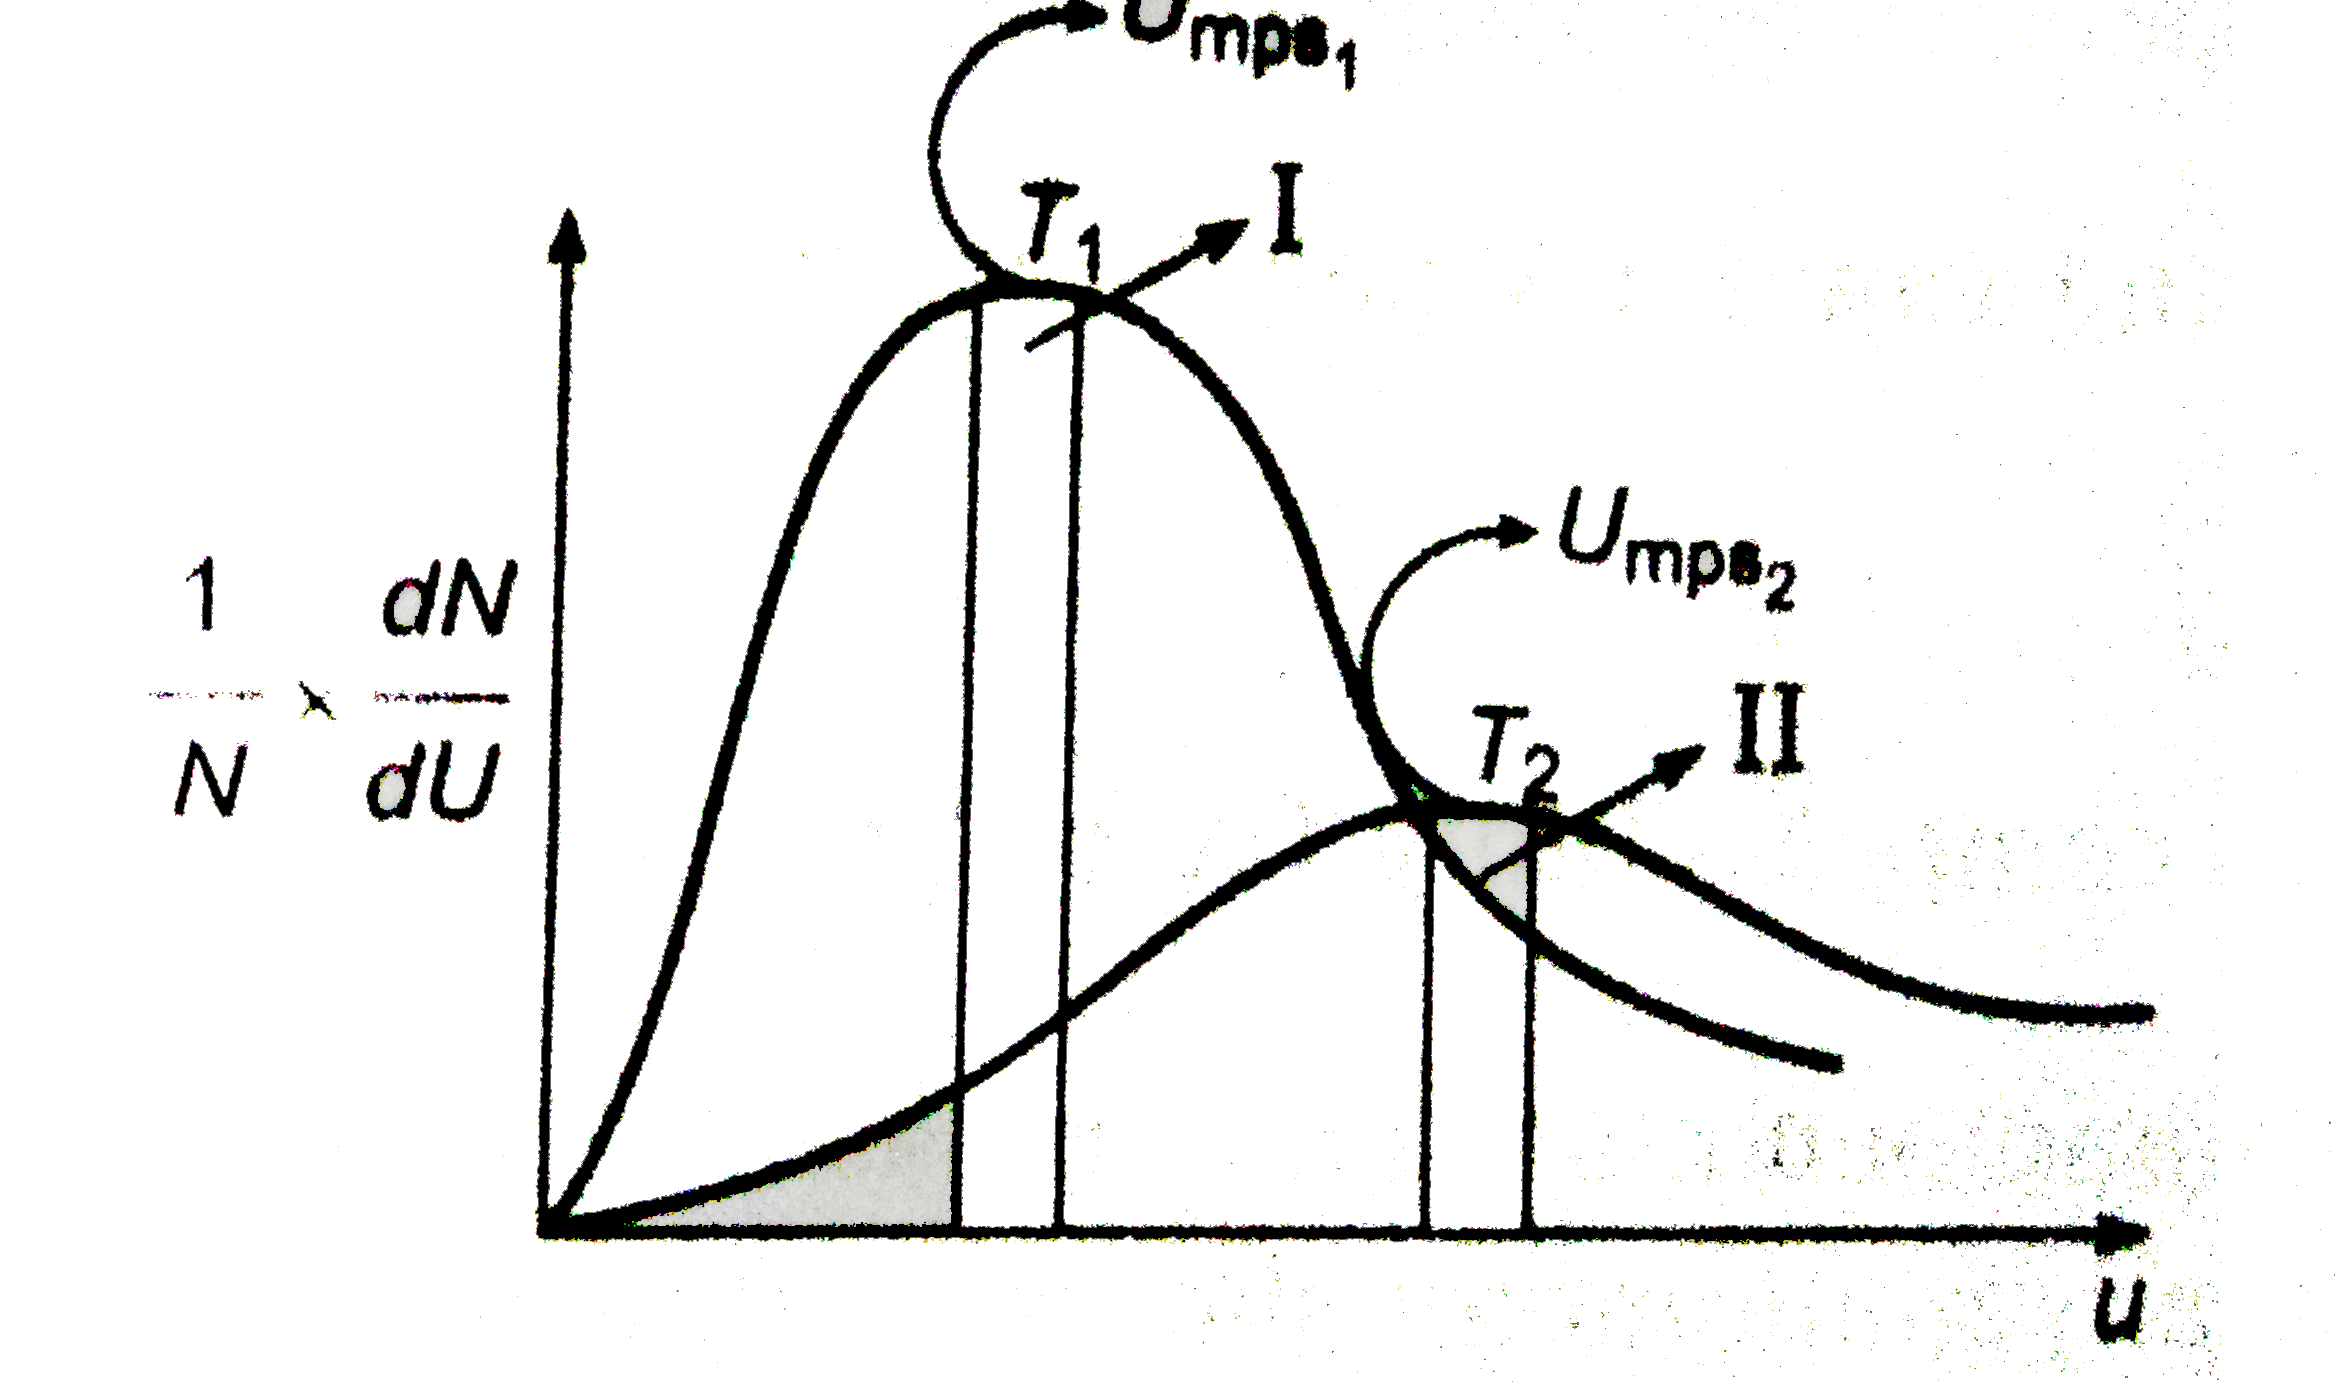
Following represents the Maxwell distribution curve for an ideal gas at two temperature T1 and T2 . Which of the following option(s) is/are true?
View SolutionShown below are the black body radiation curves at temperature T1 and T2(T2>T1). Which of the following plots is correct?
View SolutionA student performed an experiment to measure - pressure and volume of a gas at constant temperature and noted the following:

Calculate the value of x and y. Which law was used in the calculations ? Draw graphs to show:
volume plotted against pressure.
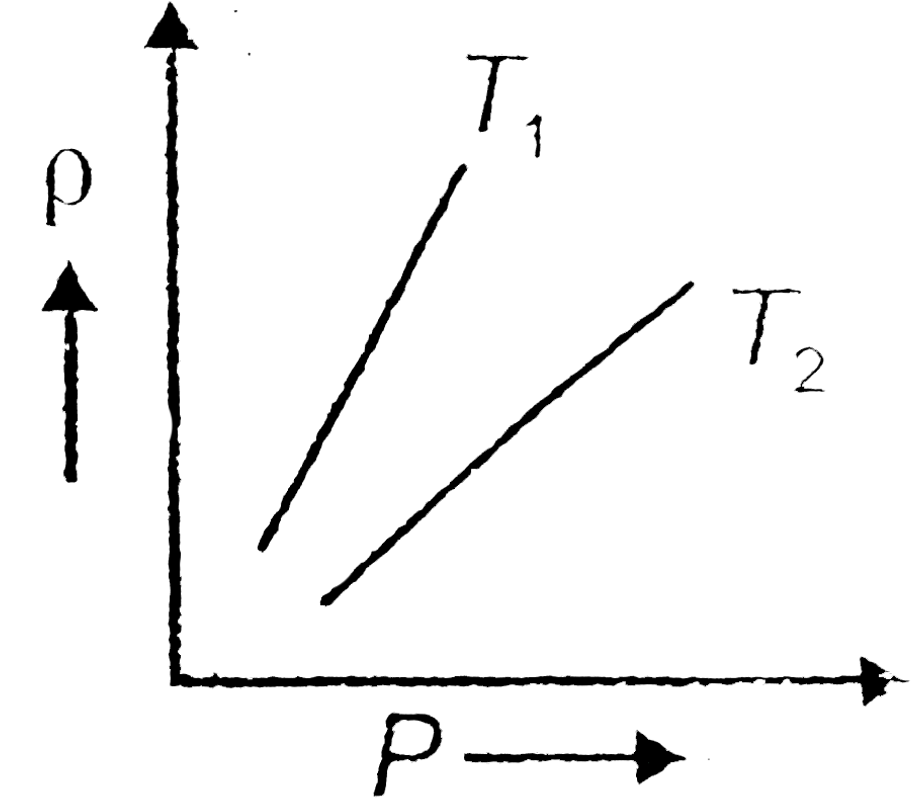
View SolutionThe density (ρ) versus pressure (P) graphs of a given mass of an ideal gas is shown at two temperatures T1andT2. Then relation between T1andT2 may be
View SolutionV vs T curves at different pressures P1 and P2 for an ideal gas are shown below:
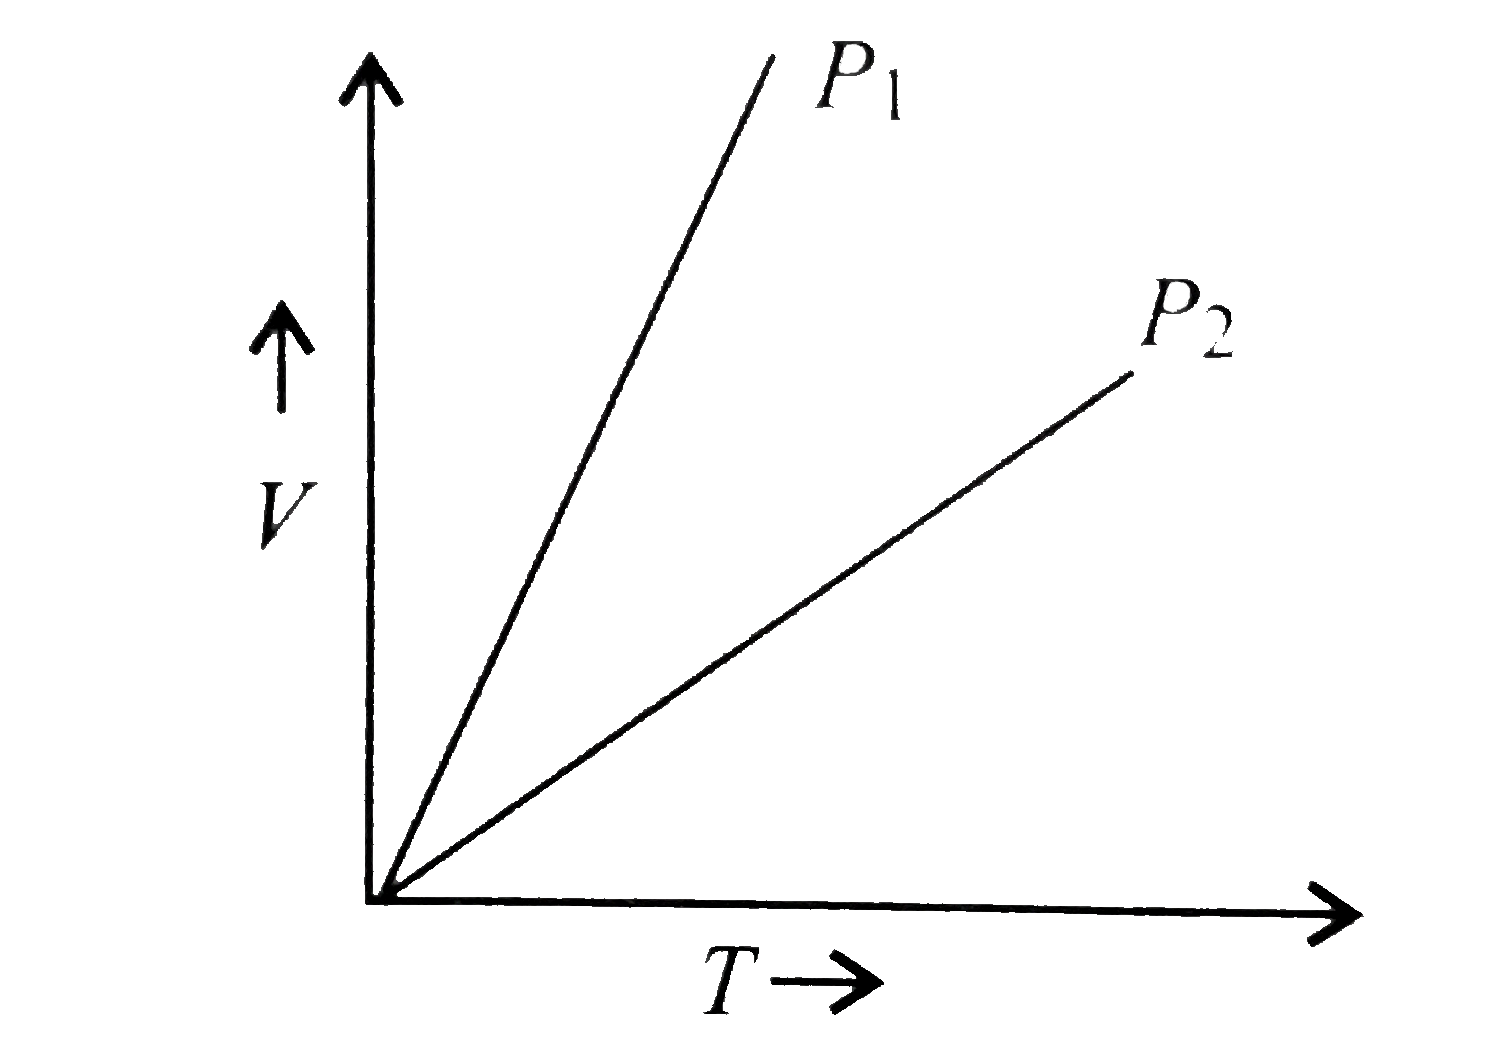
Which one of the following is correct?
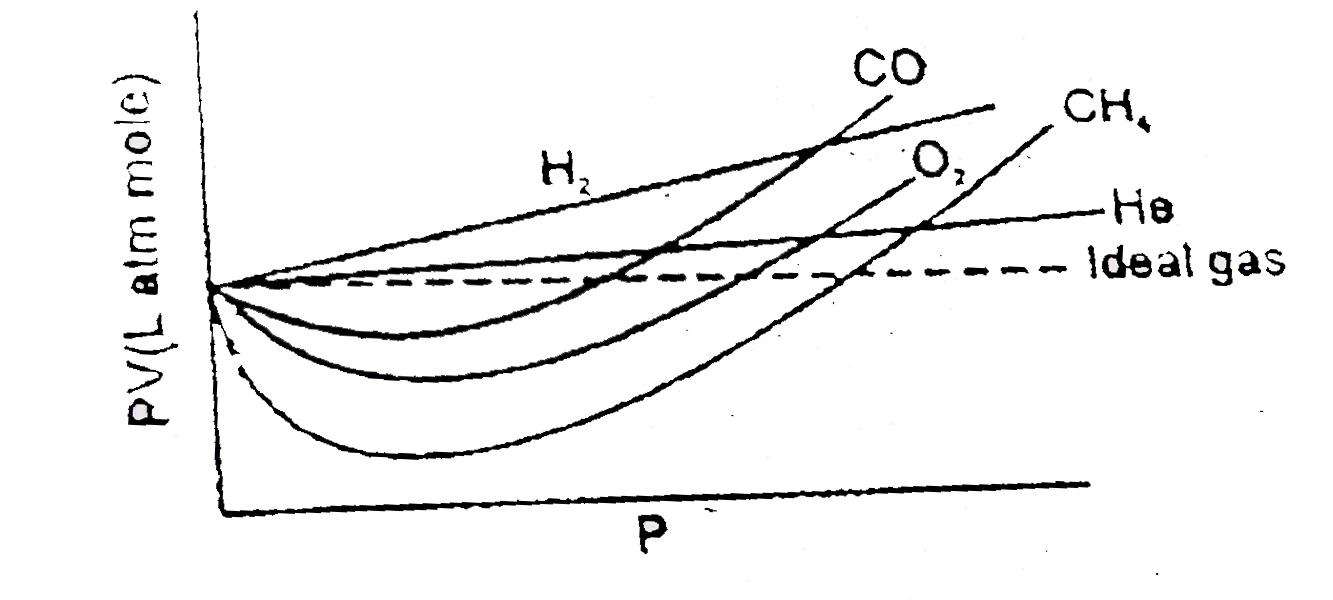
View SolutionThe curve of pressure volume (PV) against pressure (P) of the gas at a particular temperature is as shown, according to the graph which of the following is/are incorrect (in low pressure region):
View Solution

 .
.