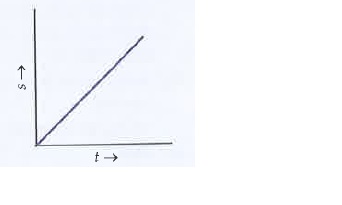
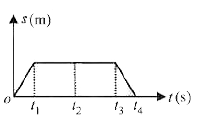
The displacement-time graph of a body is shown in.
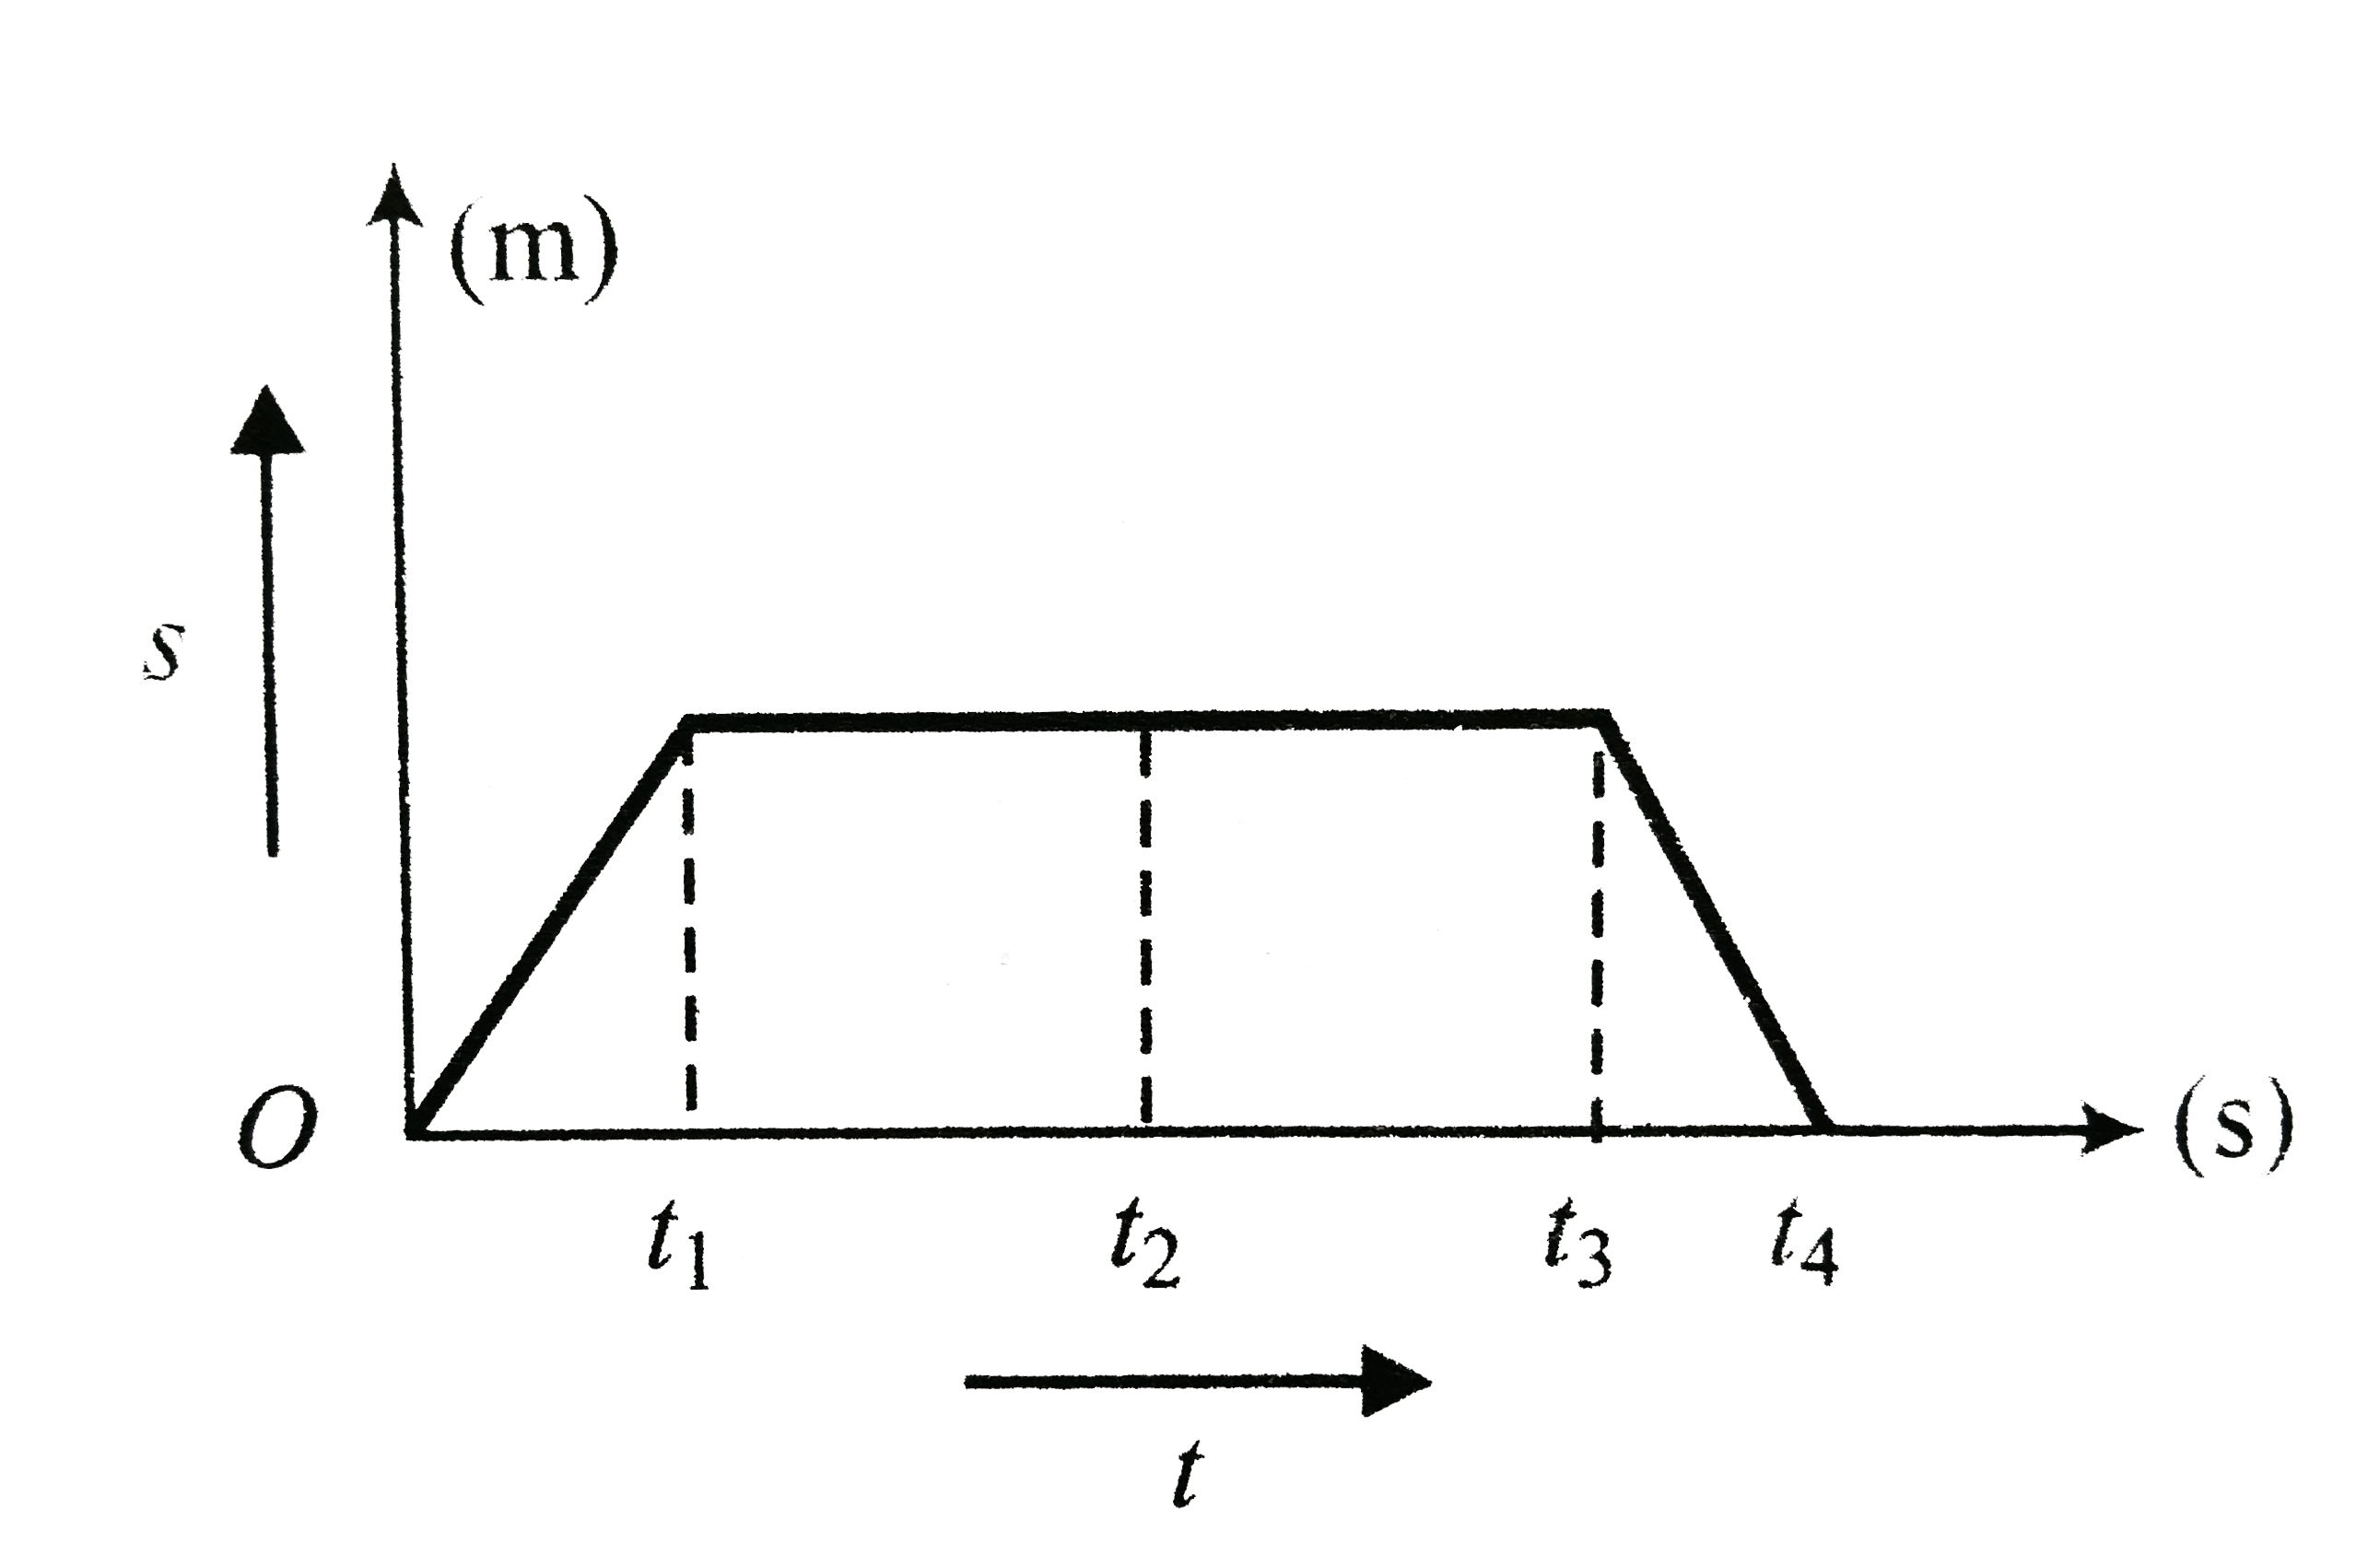 .
.
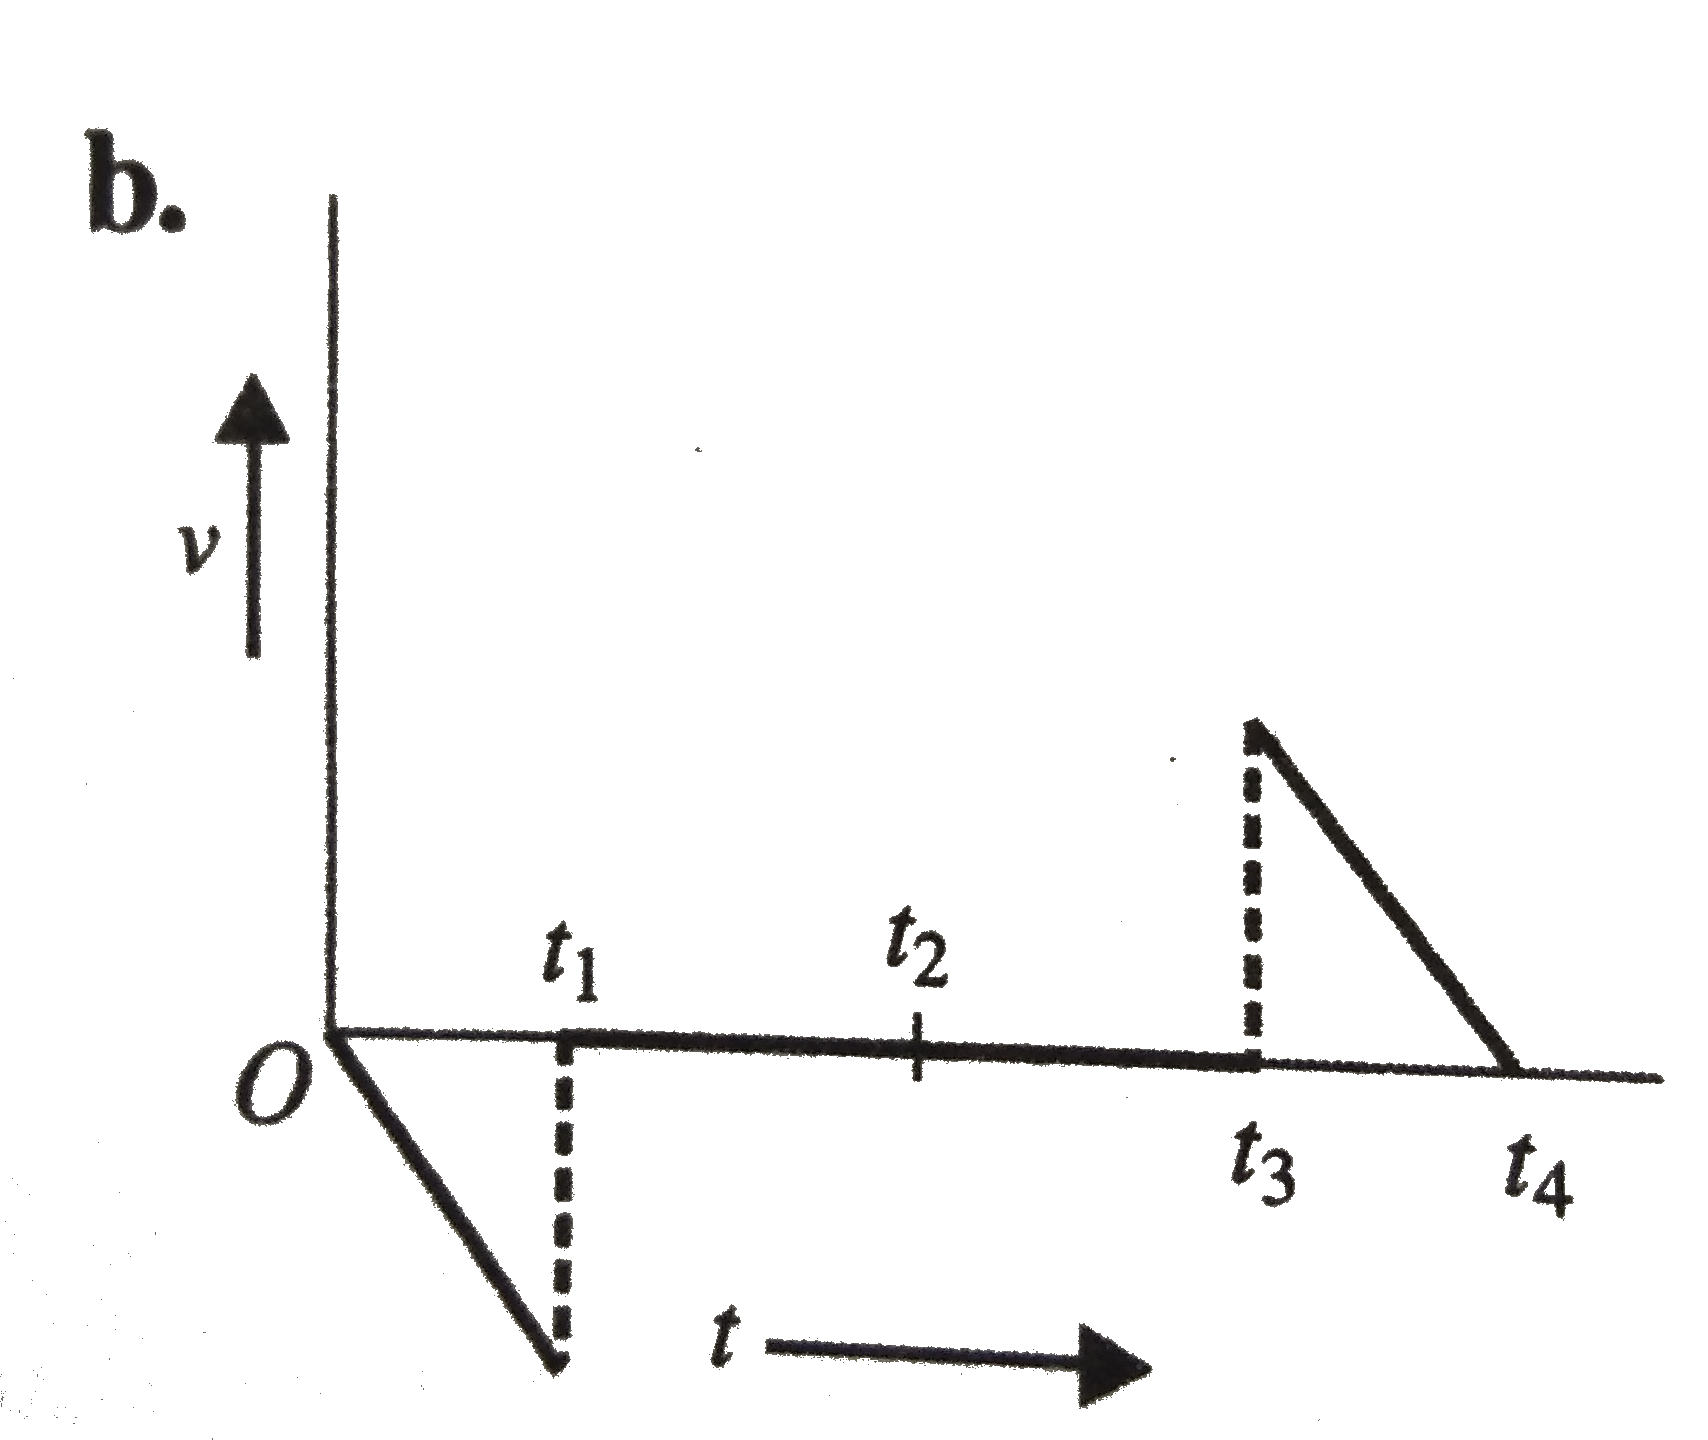
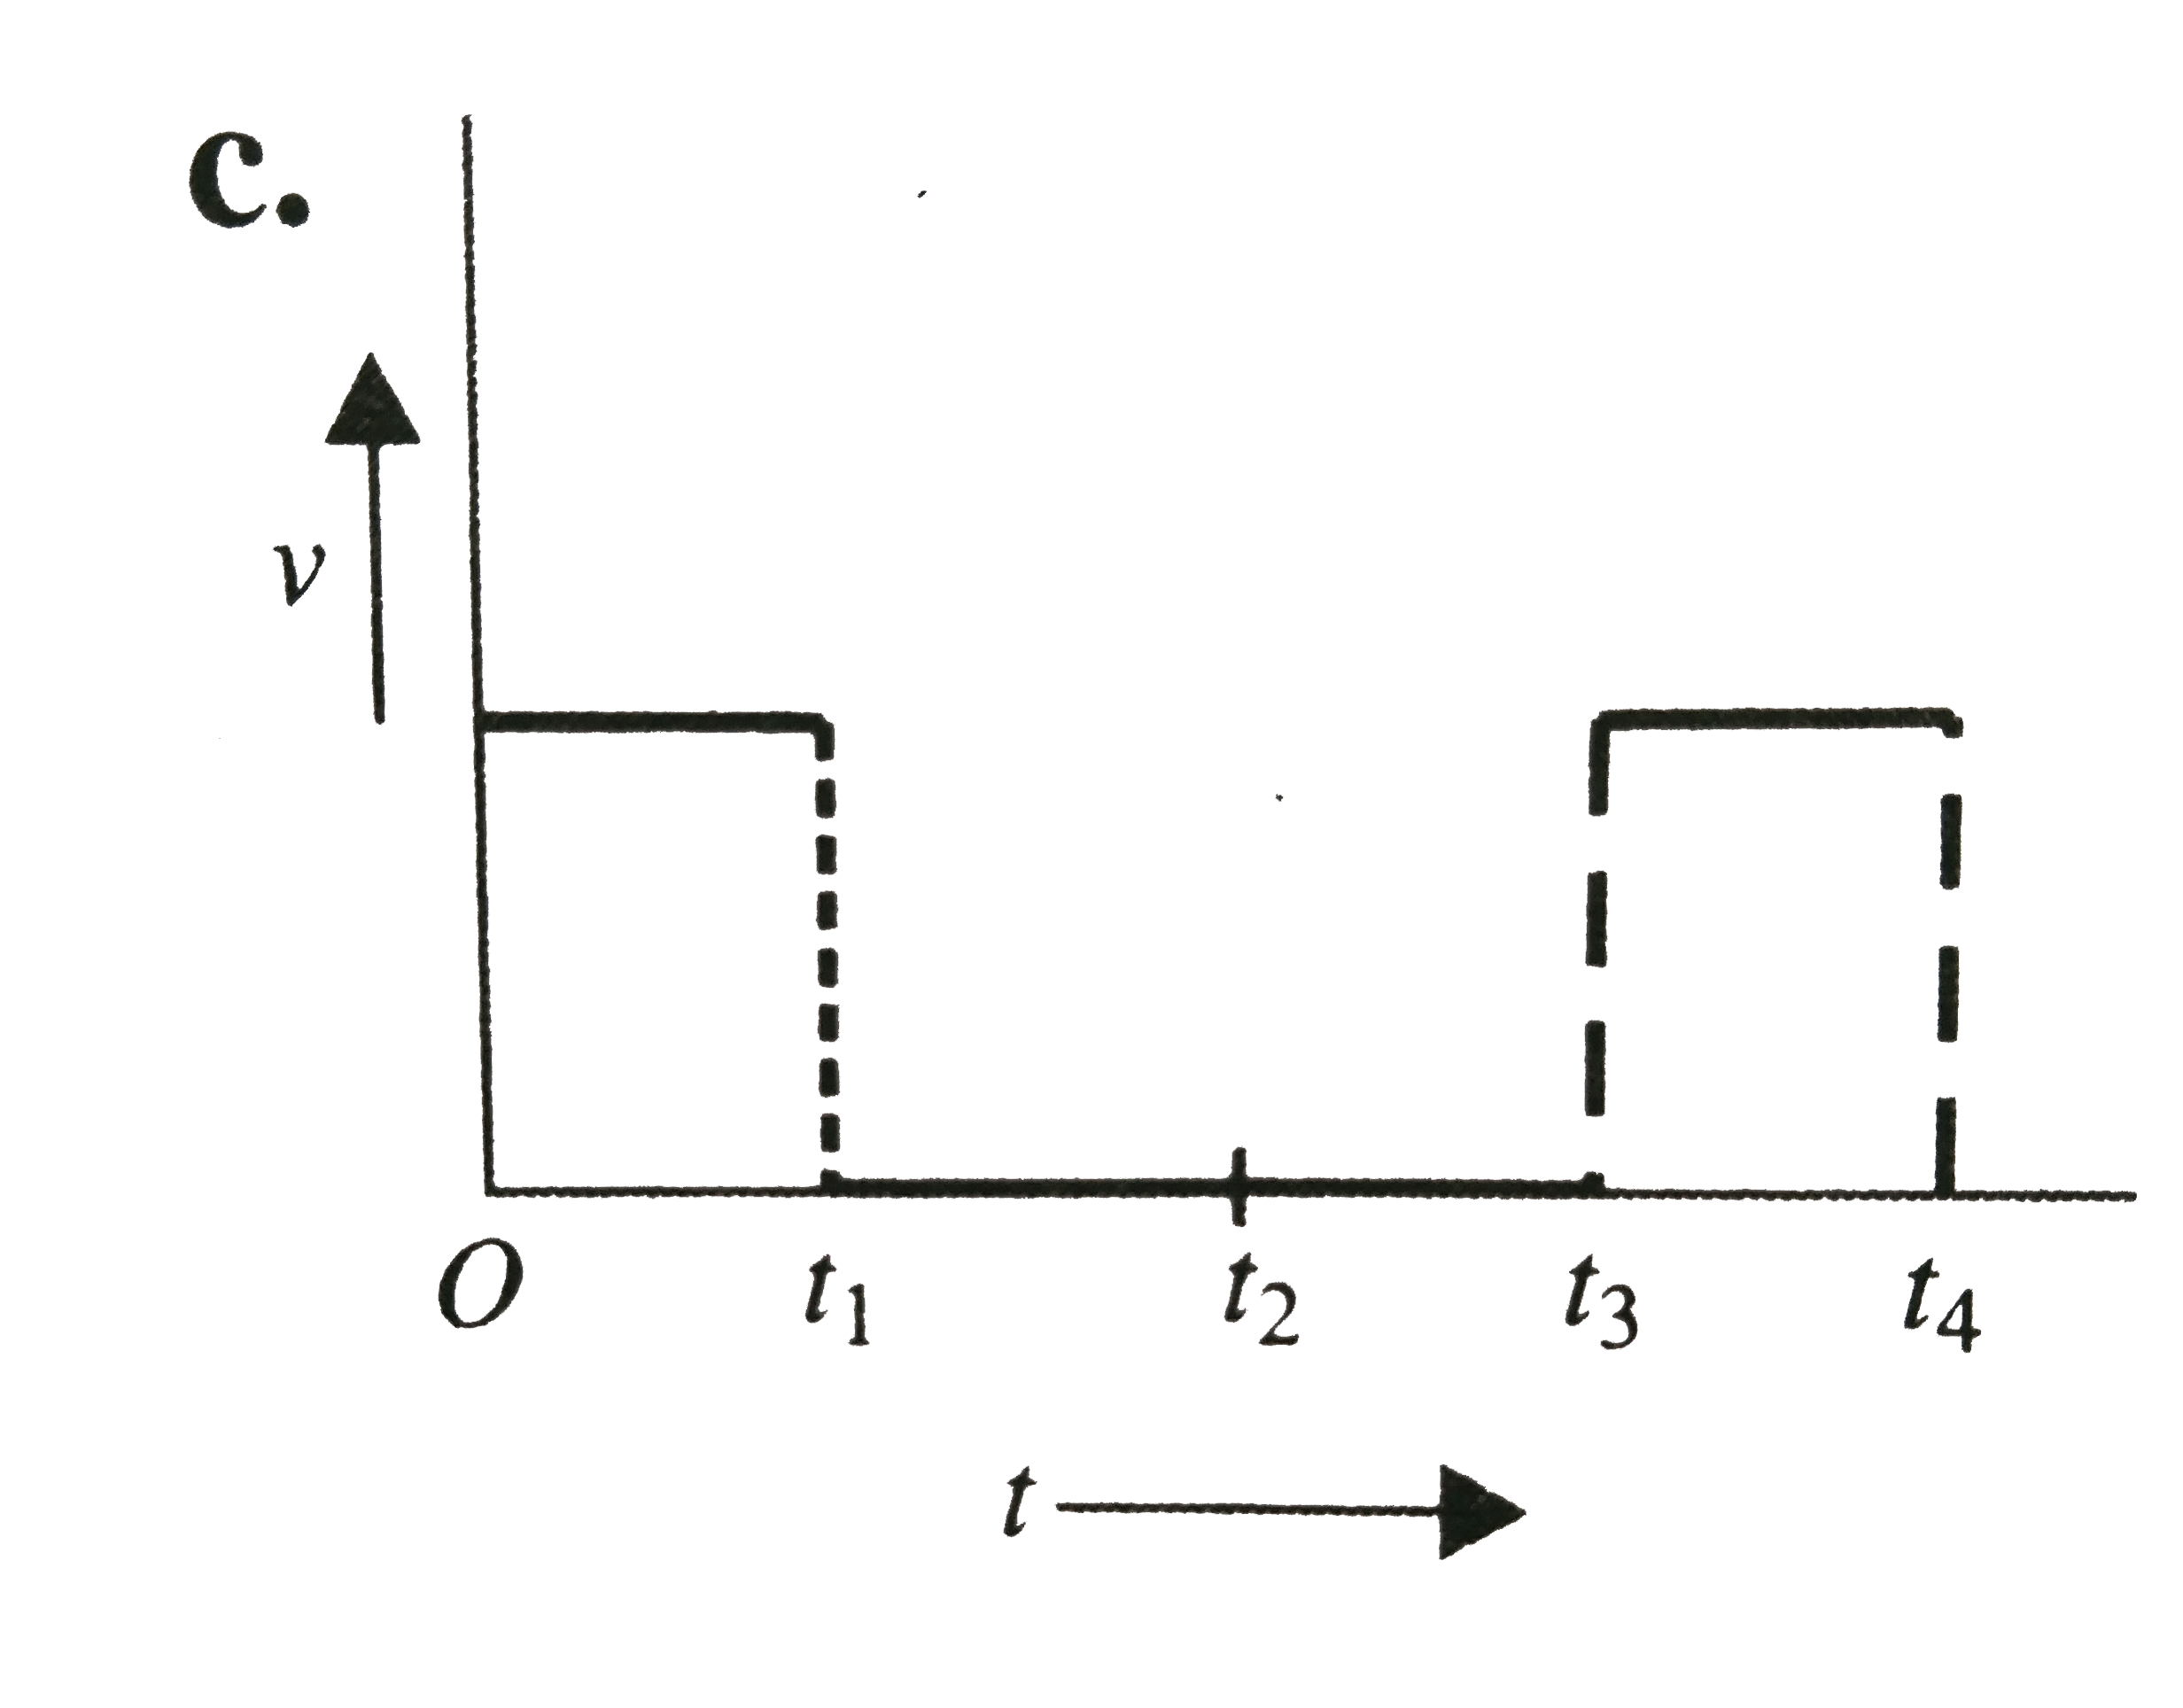
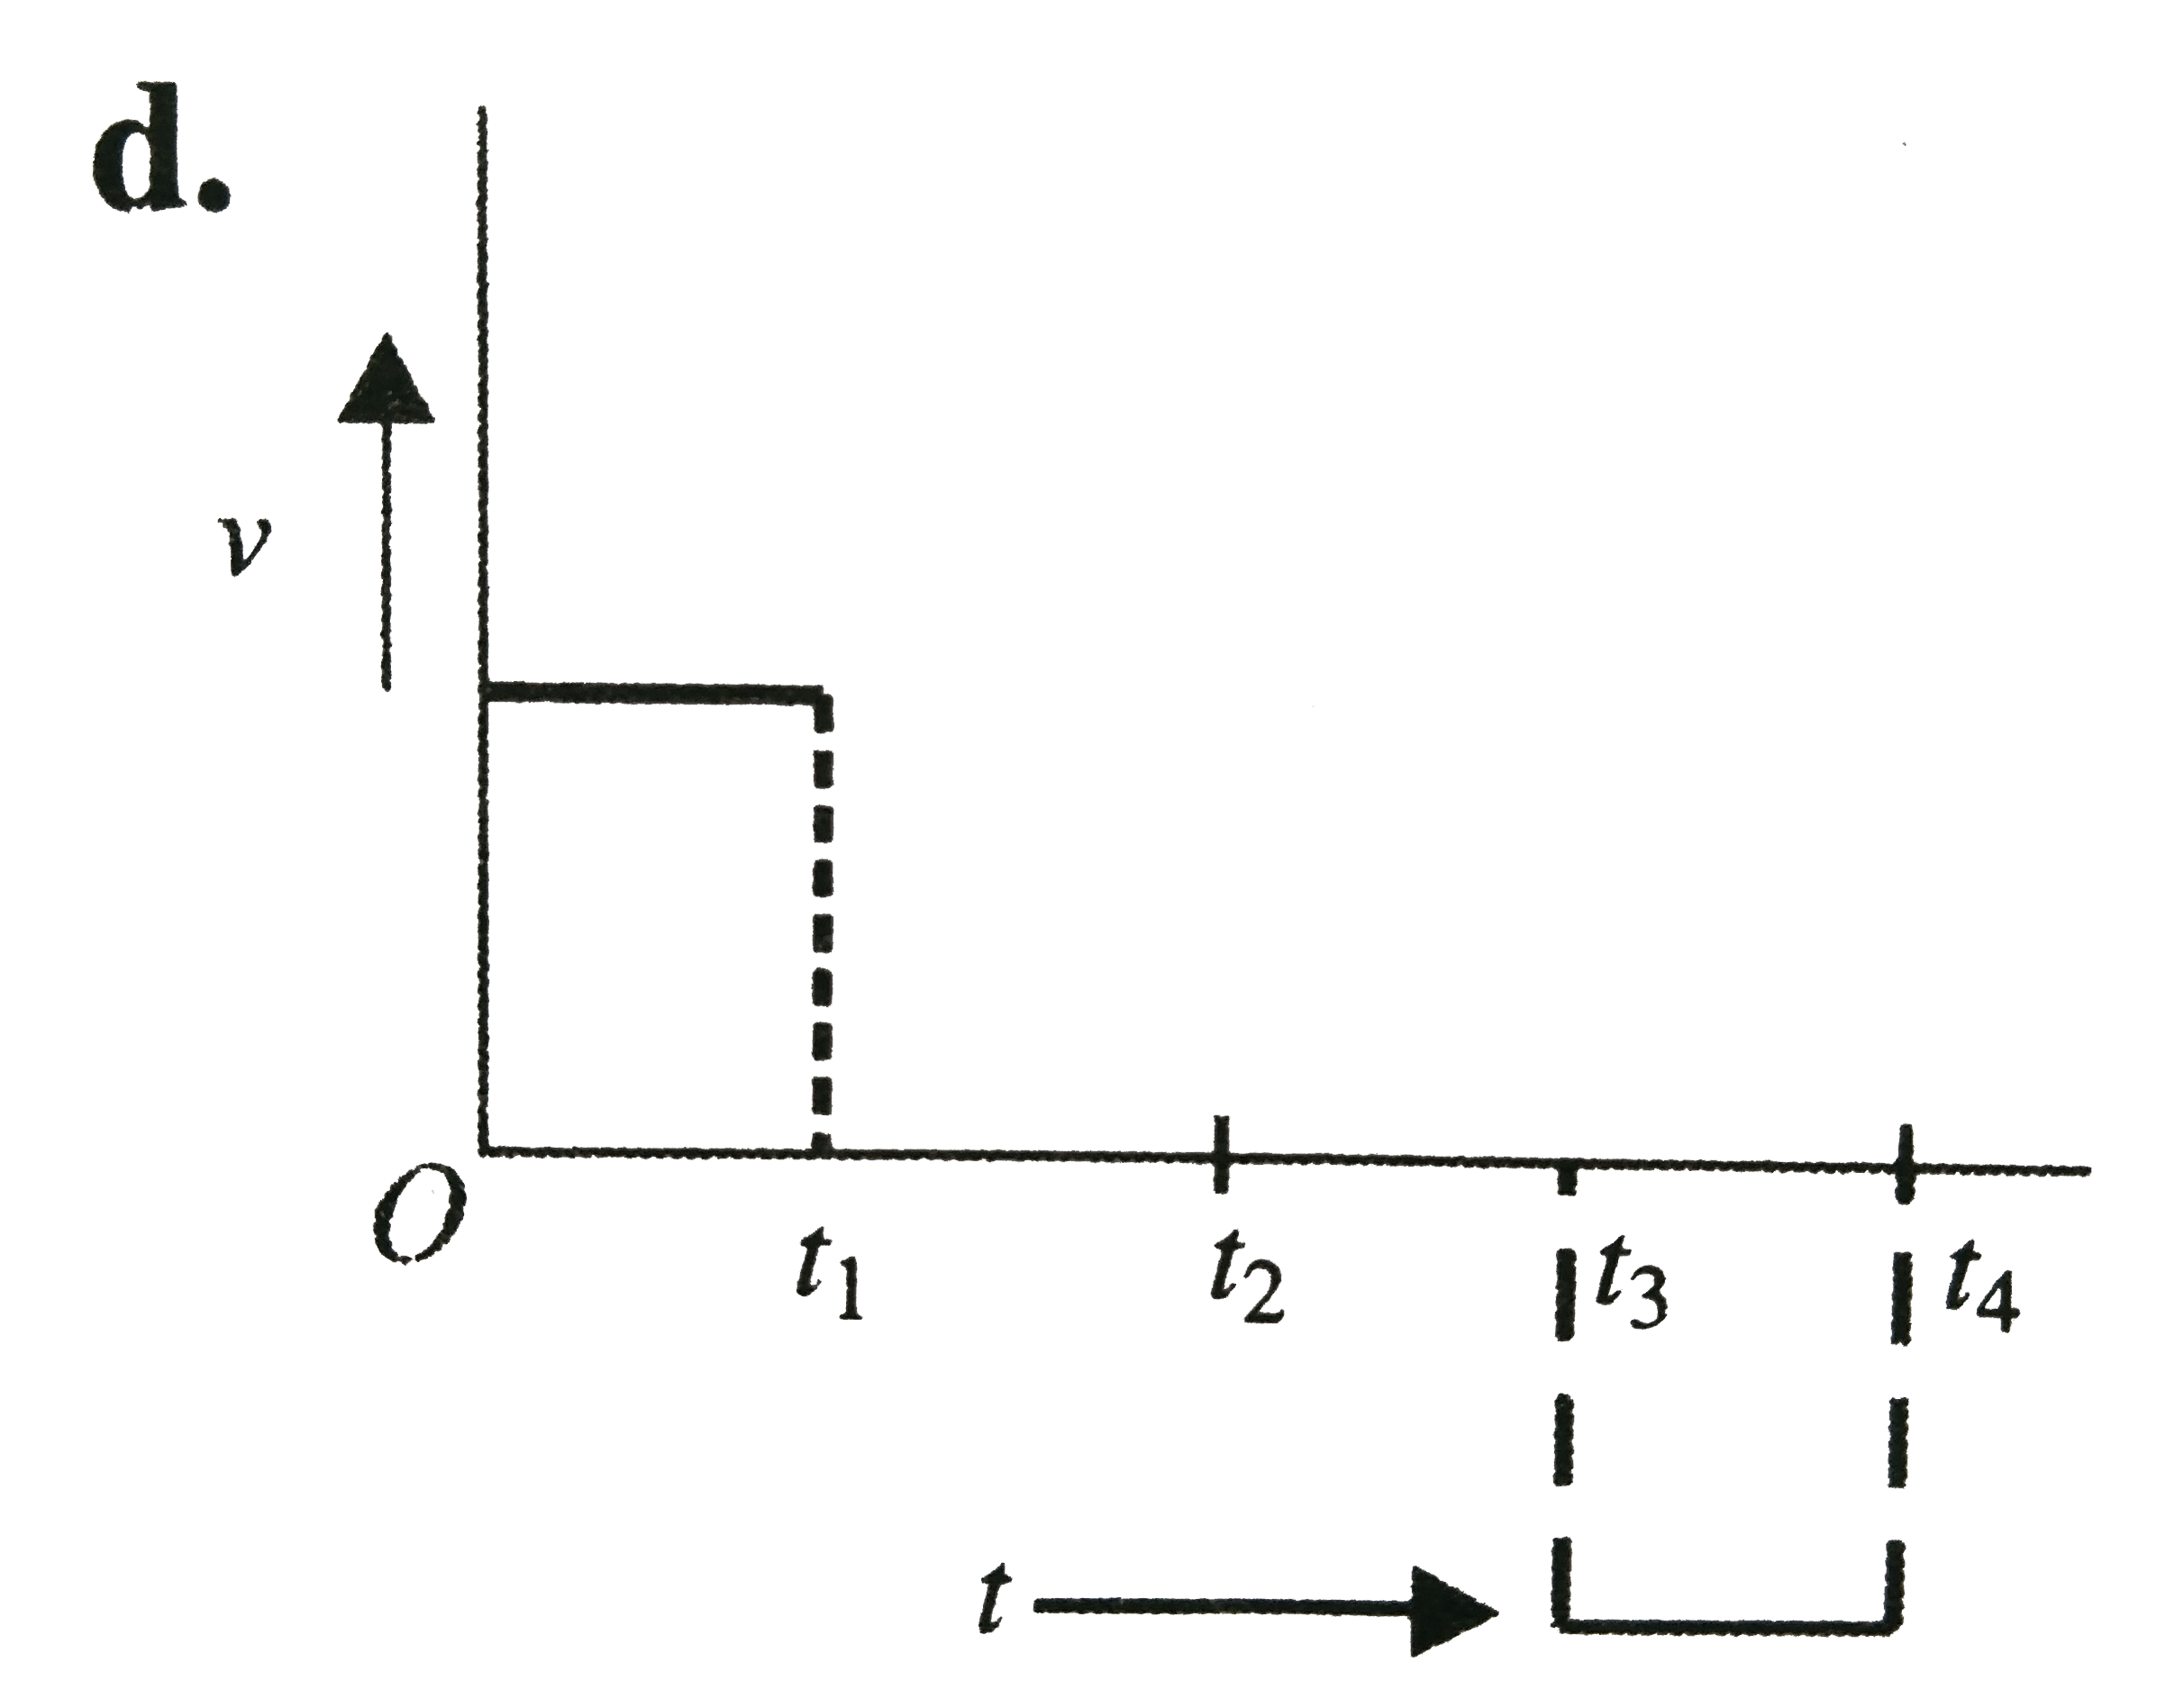
The velocity-time graph of the motion of the body will be .
A
 .
.
B
 .
.
C
 .
.
D
 .
.
Video Solution
Text Solution
The correct Answer is:D
From 0 to t1, Verlocity id positive and constant as indicated by positive and constant slope.
From t1 to t3,slopeiszerohenceveloctyiszer⊙<br>Fromt_(3)→t_(4)velocityis¬ativeandconstantas∈dicatedby¬ativeandconstantslope.<br>Optiond satisfies all these observations.
|
Topper's Solved these Questions
- KINEMATICS-1BOOK - CENGAGE PHYSICSCHAPTER - KINEMATICS-1EXERCISE - Graphical cancept
1 Videos
- KINEMATICS-1BOOK - CENGAGE PHYSICSCHAPTER - KINEMATICS-1EXERCISE - Multiple Correct
16 Videos
- KINEMATICS-1BOOK - CENGAGE PHYSICSCHAPTER - KINEMATICS-1EXERCISE - Single Correct
52 Videos
- GRAVITATIONBOOK - CENGAGE PHYSICSCHAPTER - GRAVITATIONEXERCISE - INTEGER_TYPE
1 Videos
- KINEMATICS-2BOOK - CENGAGE PHYSICSCHAPTER - KINEMATICS-2EXERCISE - Exercise Integer
9 Videos
Similar Questions
Knowledge Check
The displacement time graph of a body is shown in figure. The velocity-time graph of the motion of the body will be
 A
A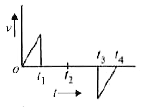 B
B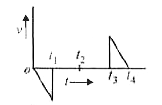 C
C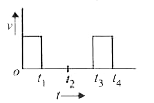 D
D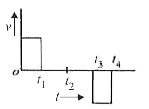
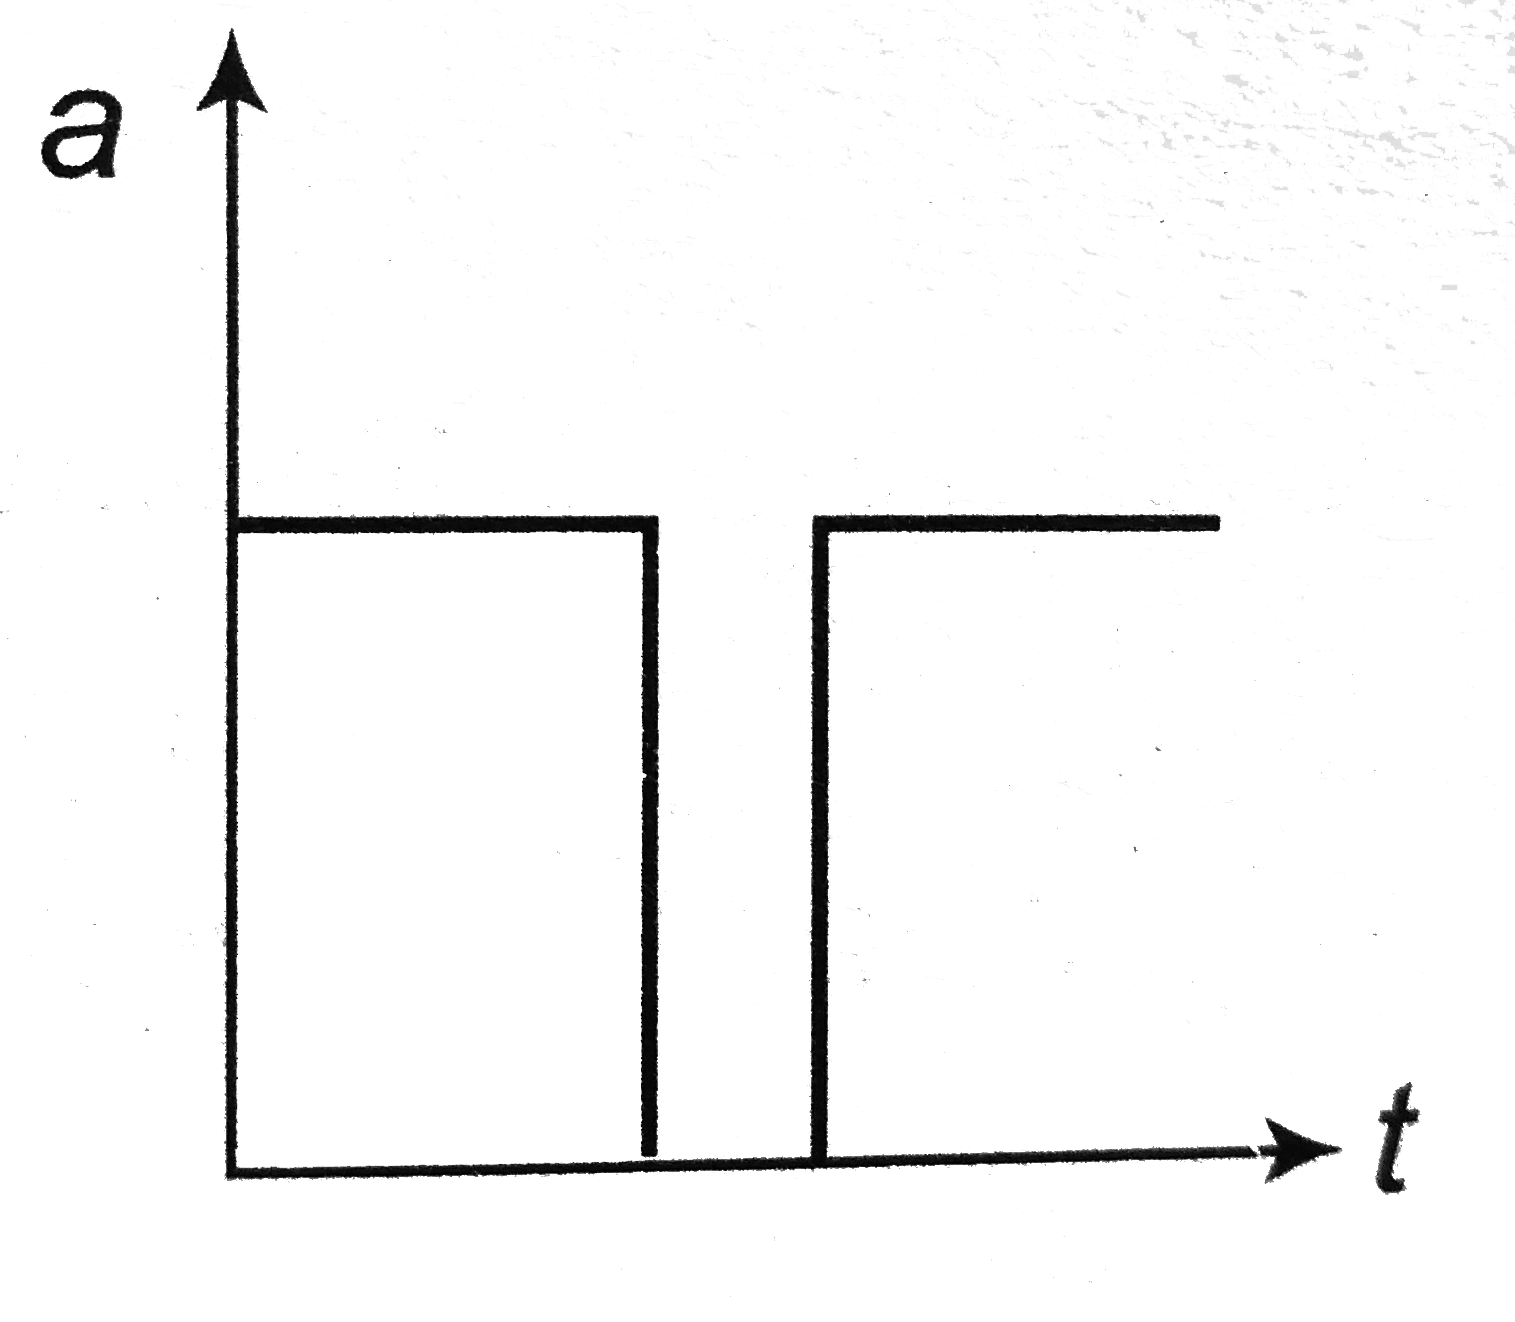
Acceleration-time graph of a body is shown. The corresponding velocity-time graph of the same body is.
 A2sB1sC32sD12s
The velocity - time graph of a body is given in figure below .
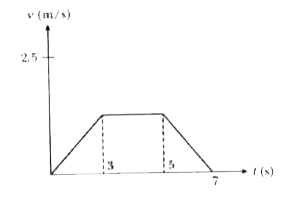
The acceleration-time graph of the motion of the body isA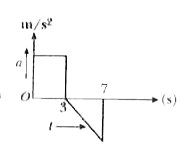 B
B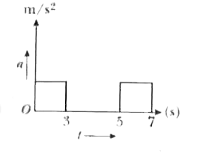 C
C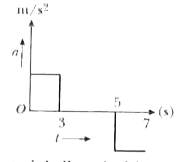 D
D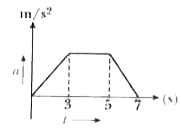

The acceleration time graph of a body is shown below the most probable velocity time graph of the body is
View SolutionThe displacement-time grpah of a body is shown in the figure below.
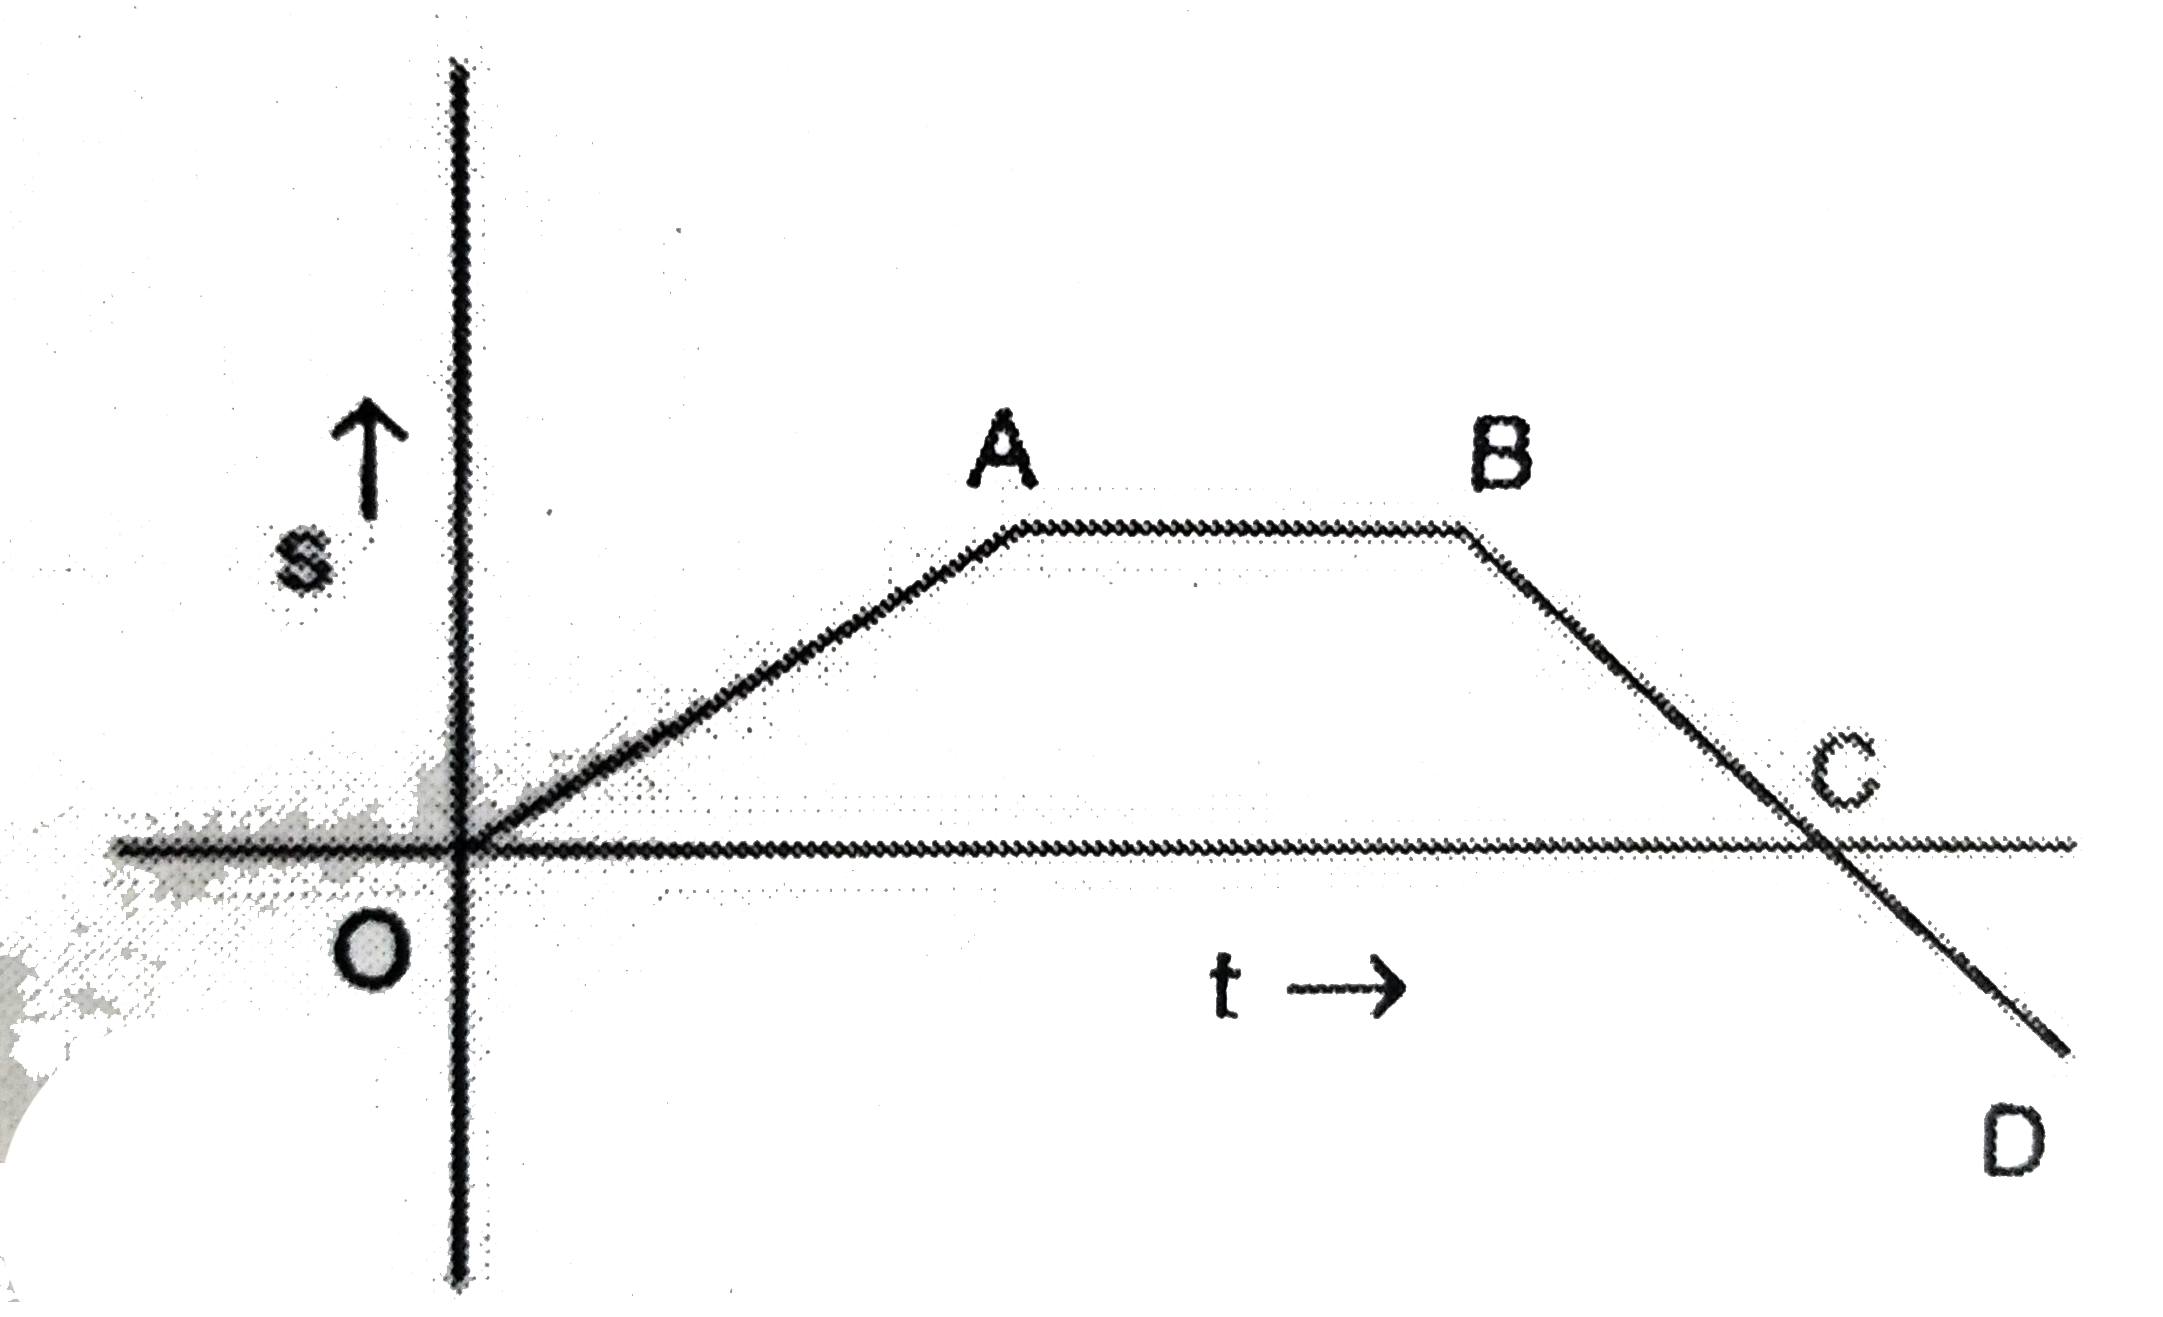
The part of the graph that represens the body at rest is
View SolutionThe velocity-time graph of a body is shown in .
The displacement of the body in 8s is.
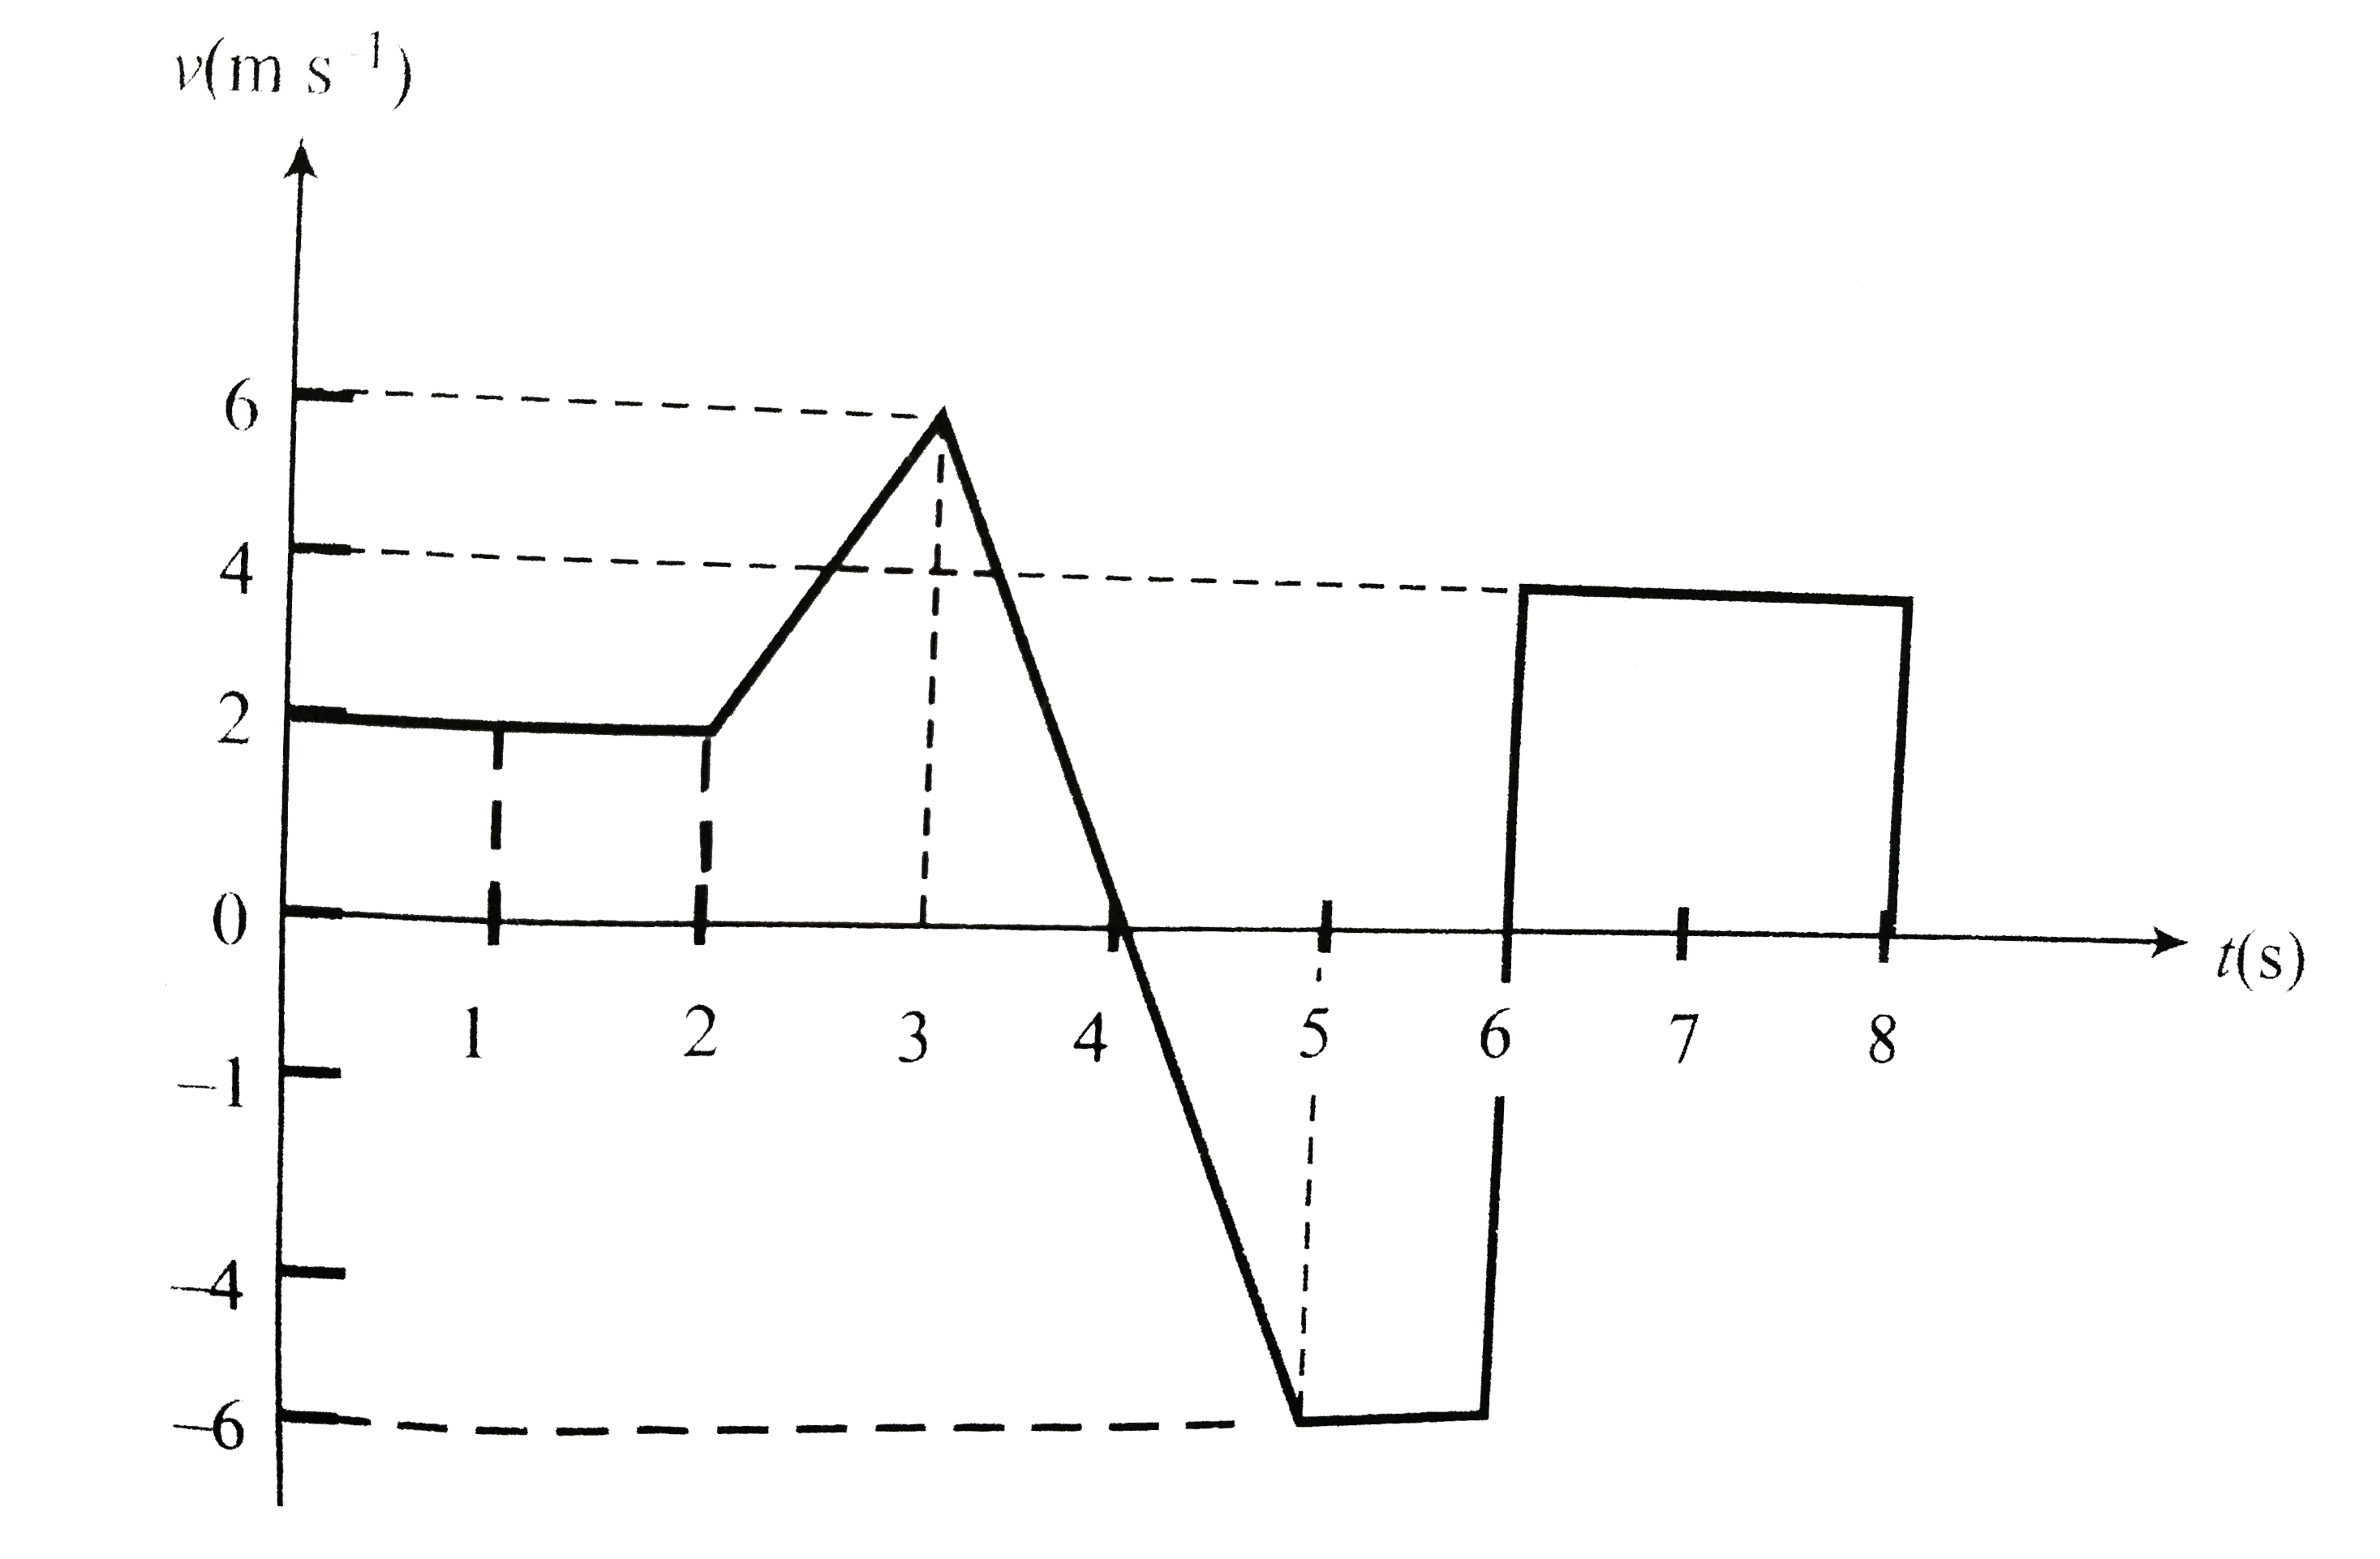 .
.
View SolutionAcceleration time graph of a body is shown below the corresponding velocity time graph of the same body is
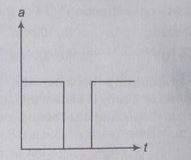
View SolutionAcceleration time graph of a body is shown below the corresponding velocity time graph of the same body is

View Solution

