The following table represents the distance of a car at different instants in a fixed direction.

(a) Draw a displacement-time graph and with its help, find whether the motion of the car is uniform or non-uniform?
(b) Use graph to calculate :
(i) the velocity of car (ii) the displacement of car at t = 2.5 s and t = 4.5 s.
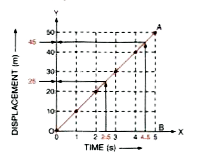
The displacement-time graph for the car is shown in Fig. 2.25. Since it is a straight line OA inclined with the time axis, so the motion of car is with

(b) (i) Velocity = Slope of the straight line OA
(ii) From the graph it is clear that at t = 2.5 s
displacement is 25 m and at t = 4.5 s
displacement is 45 m .
Topper's Solved these Questions
- MOTION IN ONE DIMENSION BOOK - ICSECHAPTER - MOTION IN ONE DIMENSION EXERCISE - EXERCISE -2 (A)
28 Videos
- MOTION IN ONE DIMENSION BOOK - ICSECHAPTER - MOTION IN ONE DIMENSION EXERCISE - EXERCISE -2 (A) ( Multiple choice type: )
5 Videos
- MEASUREMENTS AND EXPERIMENTATION BOOK - ICSECHAPTER - MEASUREMENTS AND EXPERIMENTATION EXERCISE - TOPIC 2 SIMPLE PENDULUM (4 Marks Questions )
1 Videos
- PRESSURE IN FLUIDS AND ATMOSPHERIC PRESSUREBOOK - ICSECHAPTER - PRESSURE IN FLUIDS AND ATMOSPHERIC PRESSUREEXERCISE - Exercise -4(B)Numericals
5 Videos
Similar Questions
A body at rest is made to fall from the top of a tower. Its displacement at different instants is given in the following table : Draw a displacement-time graph and state whether the motion is uniform or non-uniform?

View SolutionFollowing table gives the displacement of a car at different instants of time. (a) Draw the displacement-time sketch and find the average velocity of car.
(b) What will be the displacement of car at (i) 2.5 s and (ii) 4.5 s?

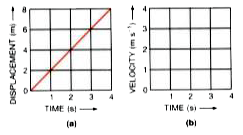
View SolutionFig. 2.37 (a) shows the displacement-time graph for the motion of a body. Use it to calculate the velocity of body at t = 1 s, 2 s and 3 s, then draw the velocitytime graph for it in Fig. (b).

View Solutions-t graph of a particle in motion is as shown below.

(a) State, whether the given graph represents a uniform motion or not.
(b) Find velocity of the particle.
View SolutionA car travels a distance 50 km with a velocity 25 km h−1 and then 60 km with a velocity 20 km h−1 in the same direction. Calculate : (i) the total time of journey and (ii) the average velocity of the car.
View SolutionAssertion : In displacement-time graph of a particle as shown in figure, velocity of particle changes its direction at point A.

Reason : Sign of slope of s-t graph decides the direction of velocity.
View SolutionA car starts from erest accelerates uniform by for 4 second and then moves with uniform velocity which of the x-t graph represent th motion of the car:-
View SolutionEngine of a car supplies constant power to the car which accelerates from rest. Car moves along a straight road. If velocity and displacement of car at any time t be v and s respectively then
View SolutionAarushi was driving a car with uniform speed of 60 km/h. Draw distance-time graph. From the graph, find the distance travelled by Aarushi in (i) 212Hours (ii) 12 Hours
View SolutionDraw a velocity-time graph for a body moving with an initial velocity u and uniform acceleration a. Use this graph to find the distance travelled by the body in time t.
View Solution
