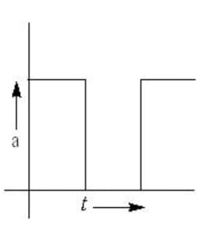
The given acceleration-time graph represents which of the following physical situation?
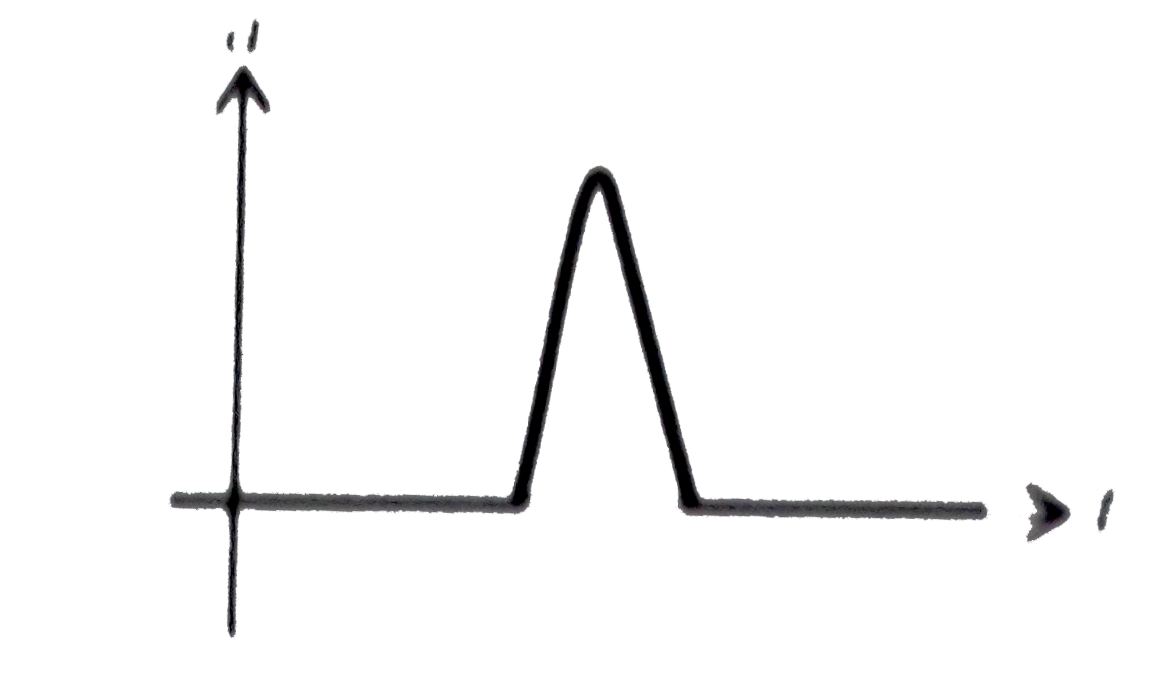
A cricket ball moving with a uniform speed is hit with a bat for a very short time interval.
A ball is falling freely from the top of a tower.
A car moving with constant velocity on a straight road.
A football is kicked into the air vertically upwards.
The correct Answer is:A
The a-t graph shows that initially the body moves with uniform velocity. Its acceleration increases for a short time and then fails to zero and there after the body moves with a constant velocity. Such as physical situation arises when a cricket ball moving with a uniform speed is hit with a bat for a very short time interval.
Topper's Solved these Questions
- MOTION IN A STRAIGHT LINEBOOK - NCERT FINGERTIPSCHAPTER - MOTION IN A STRAIGHT LINEEXERCISE - Kinematic Equations For Uniformly Accelerated Motion
32 Videos
- MOTION IN A STRAIGHT LINEBOOK - NCERT FINGERTIPSCHAPTER - MOTION IN A STRAIGHT LINEEXERCISE - Relative Velocity
18 Videos
- MOTION IN A STRAIGHT LINEBOOK - NCERT FINGERTIPSCHAPTER - MOTION IN A STRAIGHT LINEEXERCISE - Instantaneous Velocity And Speed
16 Videos
- MOTION IN A PLANE BOOK - NCERT FINGERTIPSCHAPTER - MOTION IN A PLANE EXERCISE - Assertion And Reason
15 Videos
- OSCILLATIONS BOOK - NCERT FINGERTIPSCHAPTER - OSCILLATIONS EXERCISE - Assertion And Reason
15 Videos
Similar Questions
Knowledge Check
The area under acceleration - time graph represents the
Ainitial velocityBfinal velocity,Cchange in velocity,Ddistance travelled.Which of the following represents physical adsorption?
A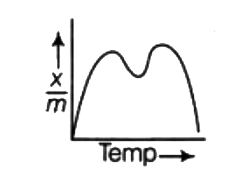 B
B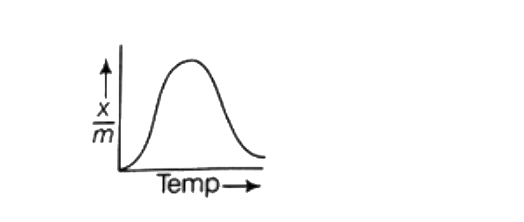 C
C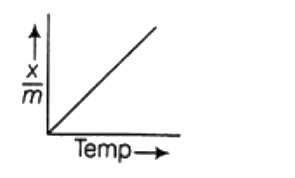 D
D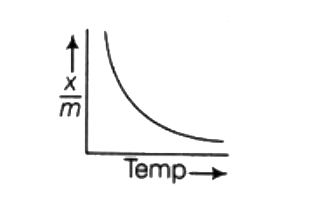
Figure shows the acceleration-time graphs of a particle. Which of the following represents the corresponding velocity -time graph?
 A
A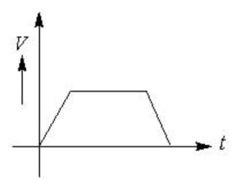 B
B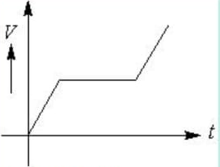 C
C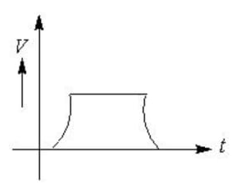 D
D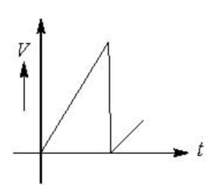
The velocity- time graph of car moving on a straight track is given below. The car weight 1000kg.
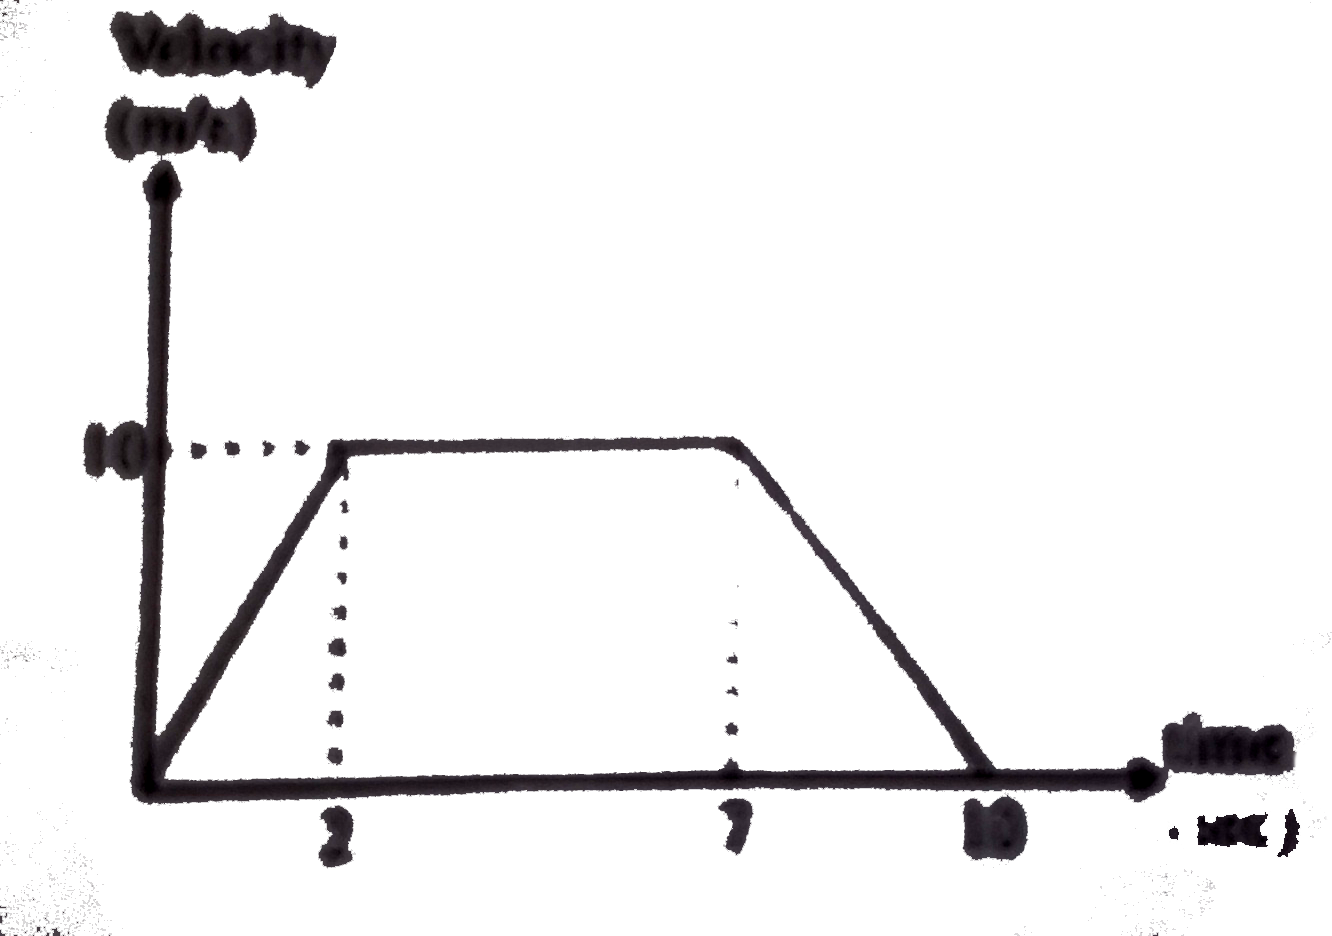 correct acceleration-time graph representing the motion of car is:
View SolutionWhich graph represents the uniform acceleration
View SolutionA parachutist steps from an aircraft, falls freely for two second, and then opens his parachute. Which of the following acceleration time (a−t) graphs best represents his downward acceleration a during the first 5 second ?
View SolutionWhich graph represents positive acceleration ?
View SolutionThe speed -time graph of the ball in the above situation is.
View Solution
