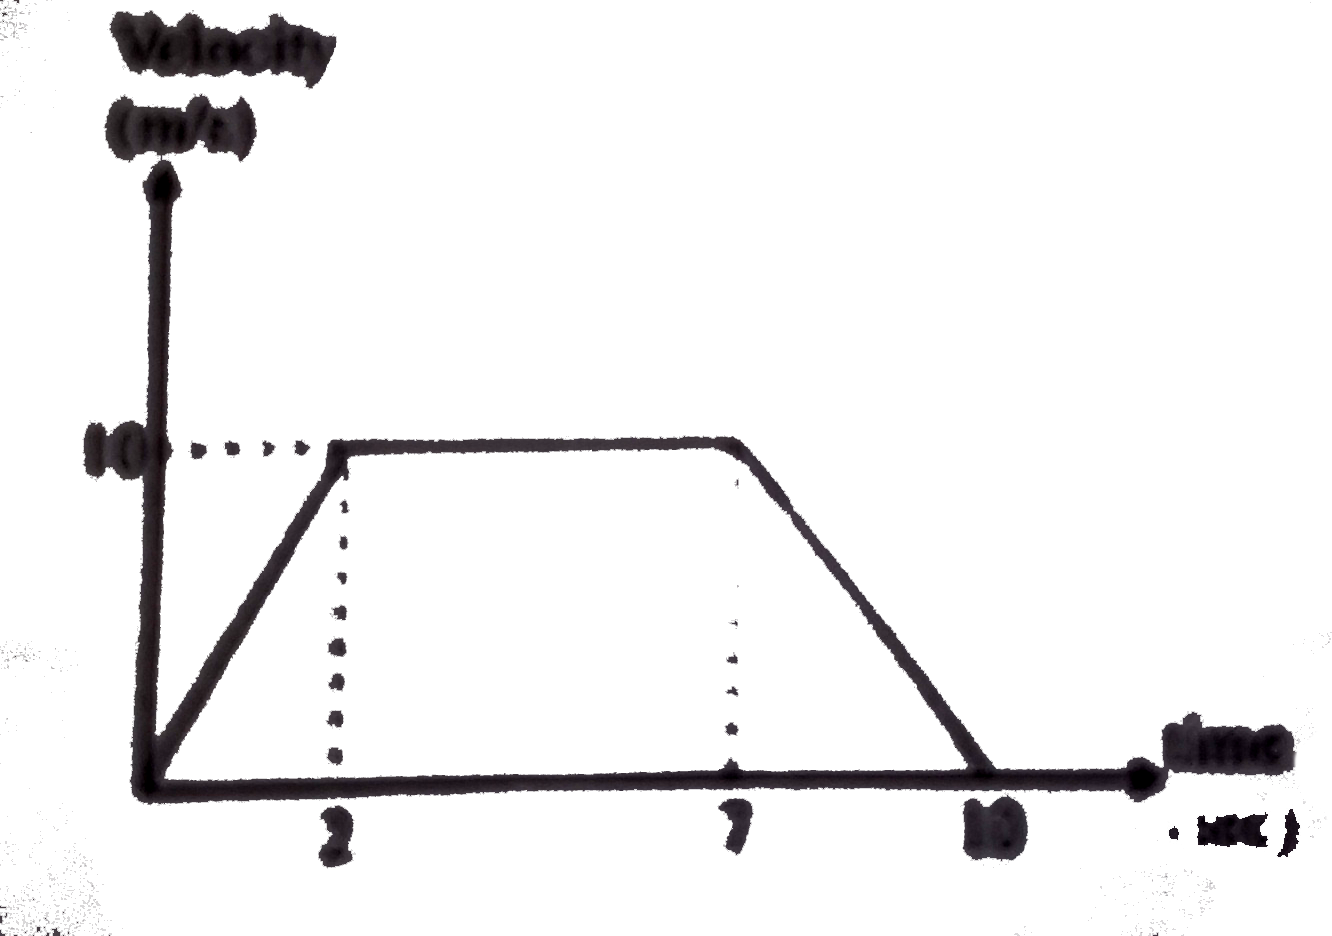
The velocity- time graph of car moving on a straight track is given below. The car weight 1000kg.
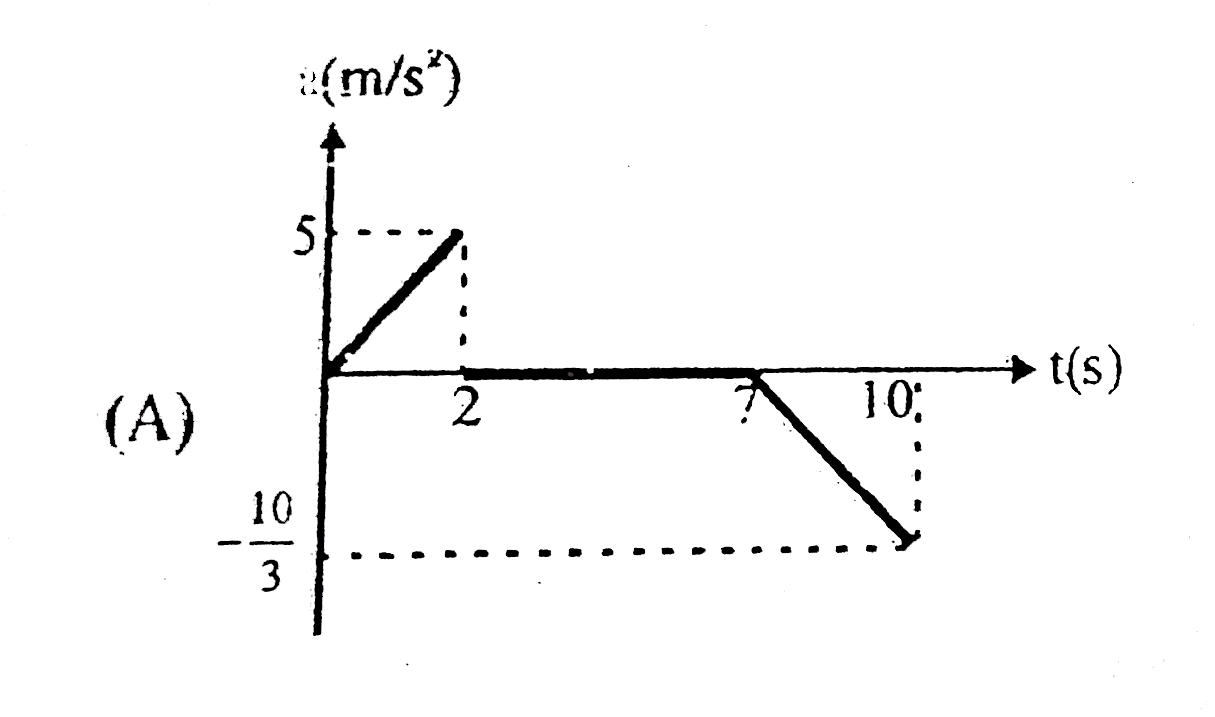
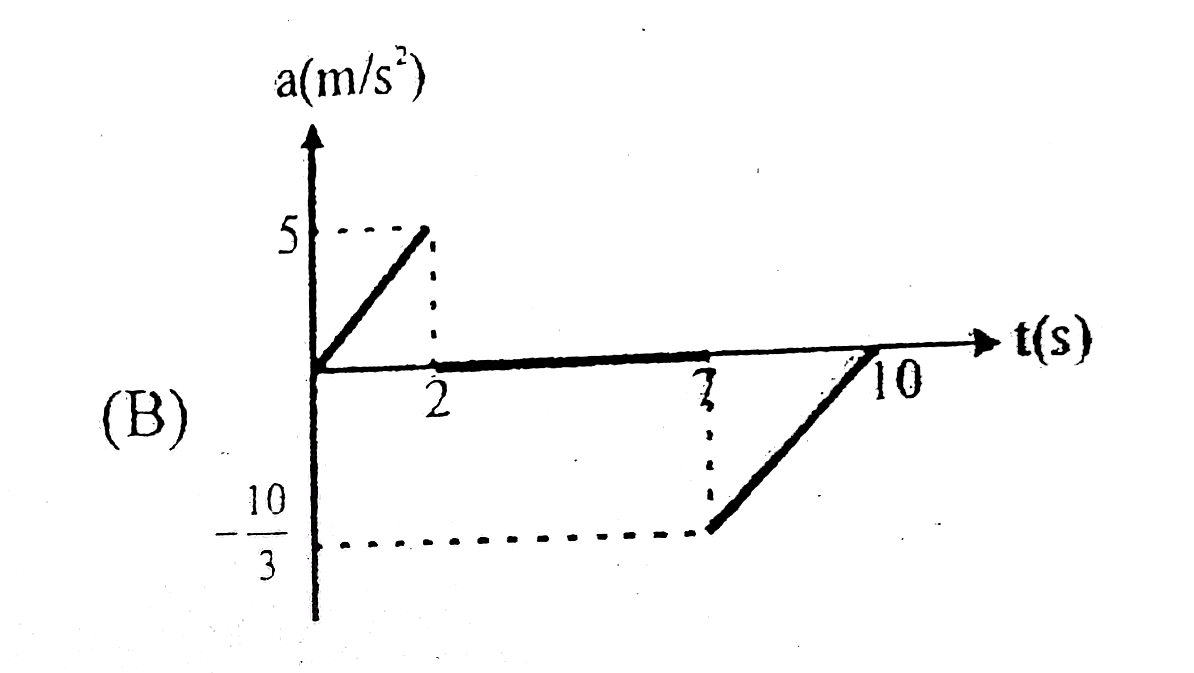
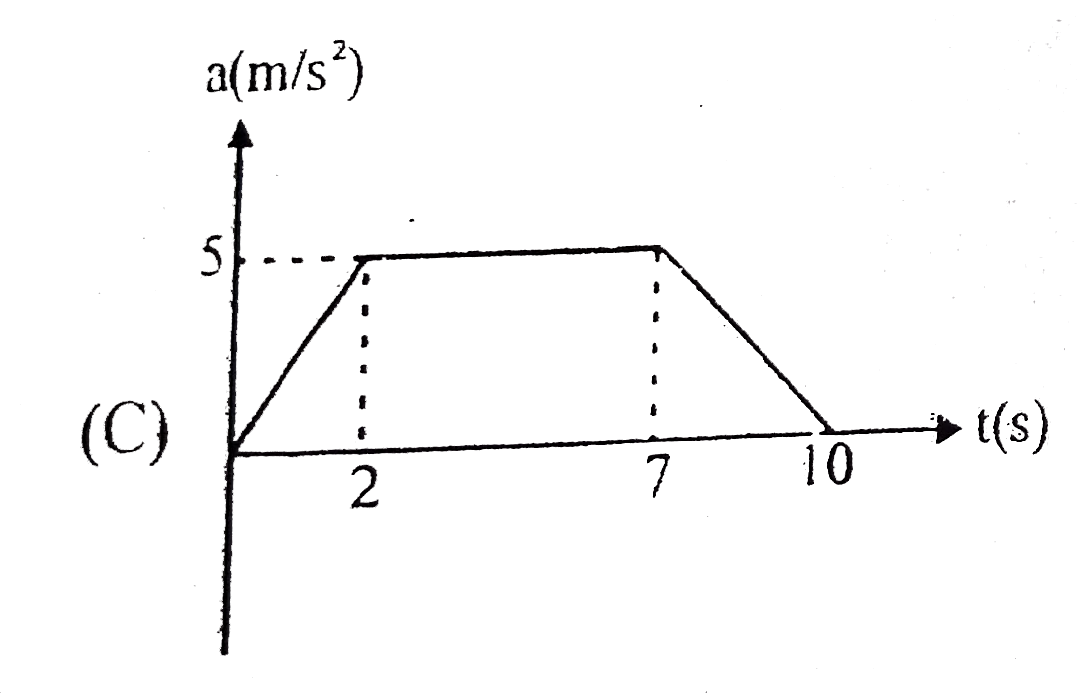
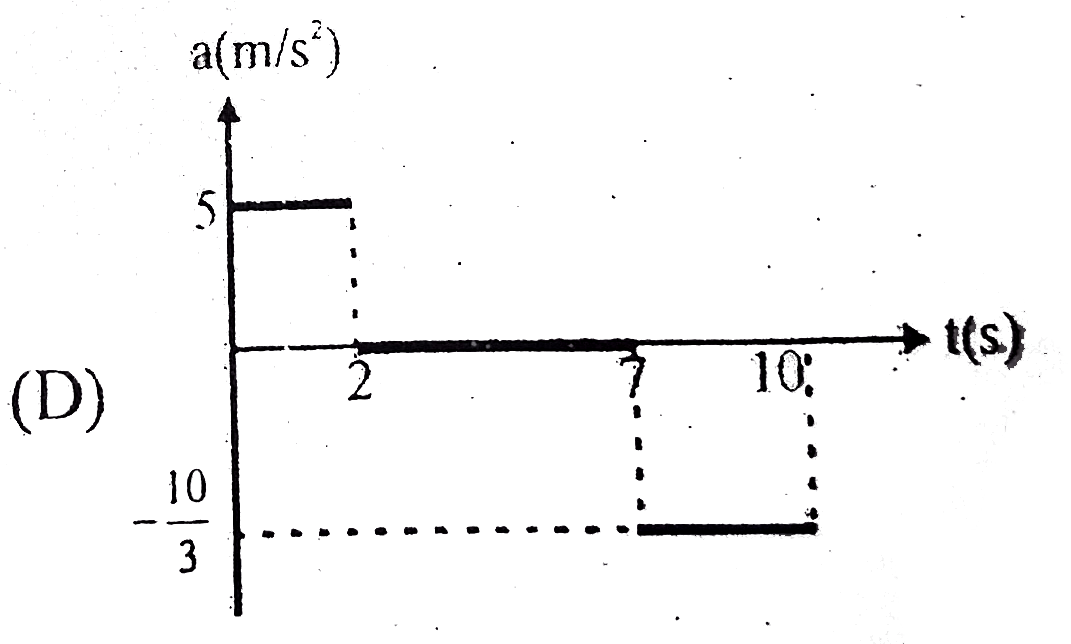
 correct acceleration-time graph representing the motion of car is:
A
B
C
D
Video Solution
Text Solution
The correct Answer is:D
From v-t graph we can analyze in t=0 to t=2 sec slope is positive and constant. Hence acceleration is positive and constant and it is 102=ms−2
Between t=2 to t=7 Slope is zero. Between t=7→t3=10slopeis¬ativeandconstant.Henceae≤rationis¬ativeandconstantanditsvalueis-10/3 ms^(-2)
Hence the required at graph is (D).
|
Topper's Solved these Questions
- MASTER PRACTICE PROBLEMBOOK - BANSALCHAPTER - MASTER PRACTICE PROBLEMEXERCISE - Reasoning
75 Videos
- MASTER PRACTICE PROBLEMBOOK - BANSALCHAPTER - MASTER PRACTICE PROBLEMEXERCISE - Multiple objective
131 Videos
- MASTER PRACTICE PROBLEMBOOK - BANSALCHAPTER - MASTER PRACTICE PROBLEMEXERCISE - Additional topic
70 Videos
- FLUID MECHANICSBOOK - BANSALCHAPTER - FLUID MECHANICSEXERCISE - PYQS AIEEE
10 Videos
- SEMICONDUCTORSBOOK - BANSALCHAPTER - SEMICONDUCTORSEXERCISE - CBSE Question
32 Videos
Similar Questions
Knowledge Check
The velocity- time graph of car moving on a straight track is given below. The car weight 1000kg.
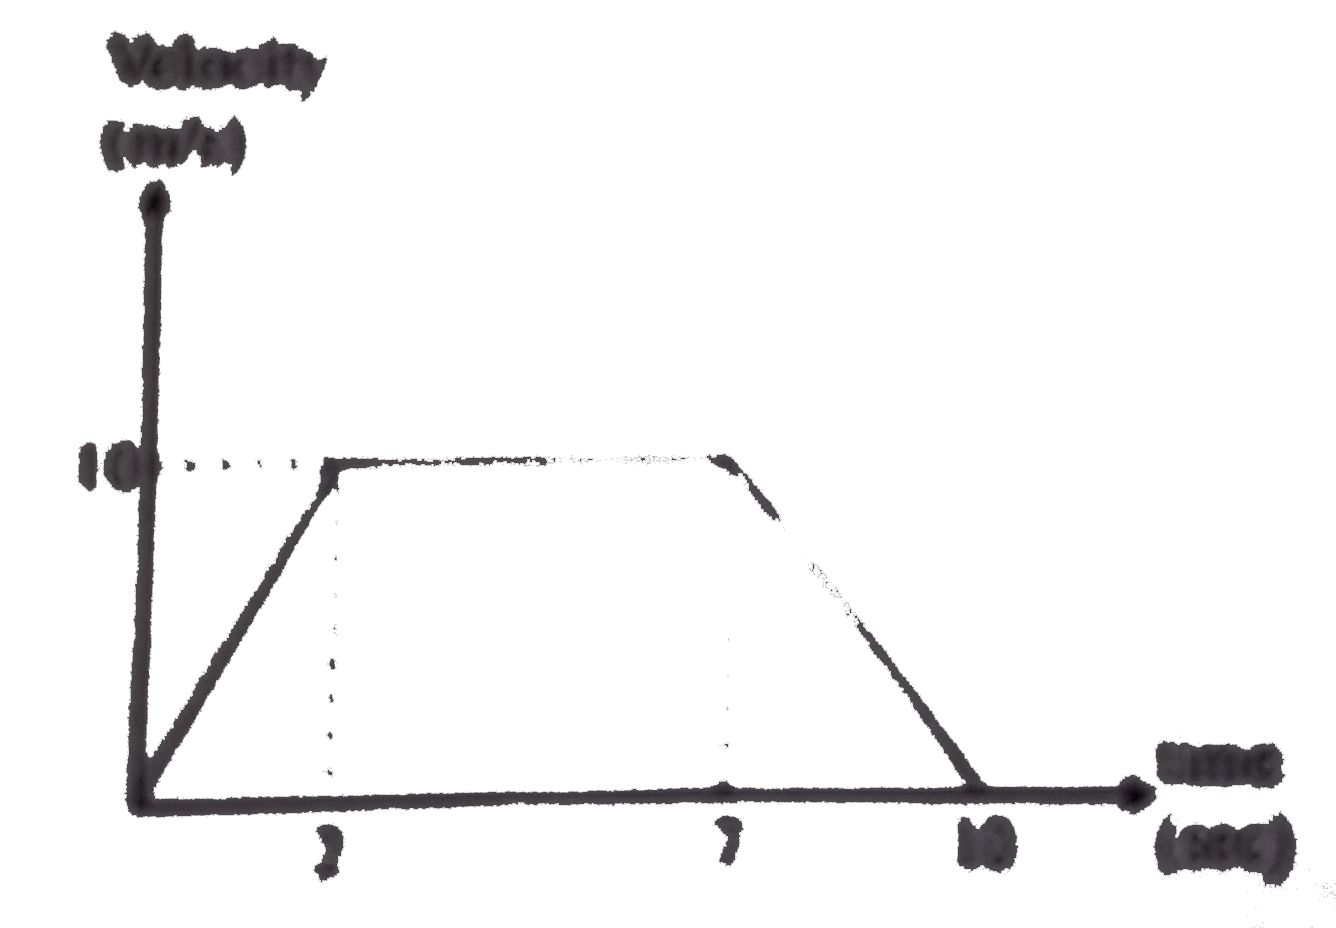 The distance travelled by the car during the whole motion is:A50mB75mC100mD150m
The velocity- time graph of car moving on a straight track is given below. The car weight 1000kg.
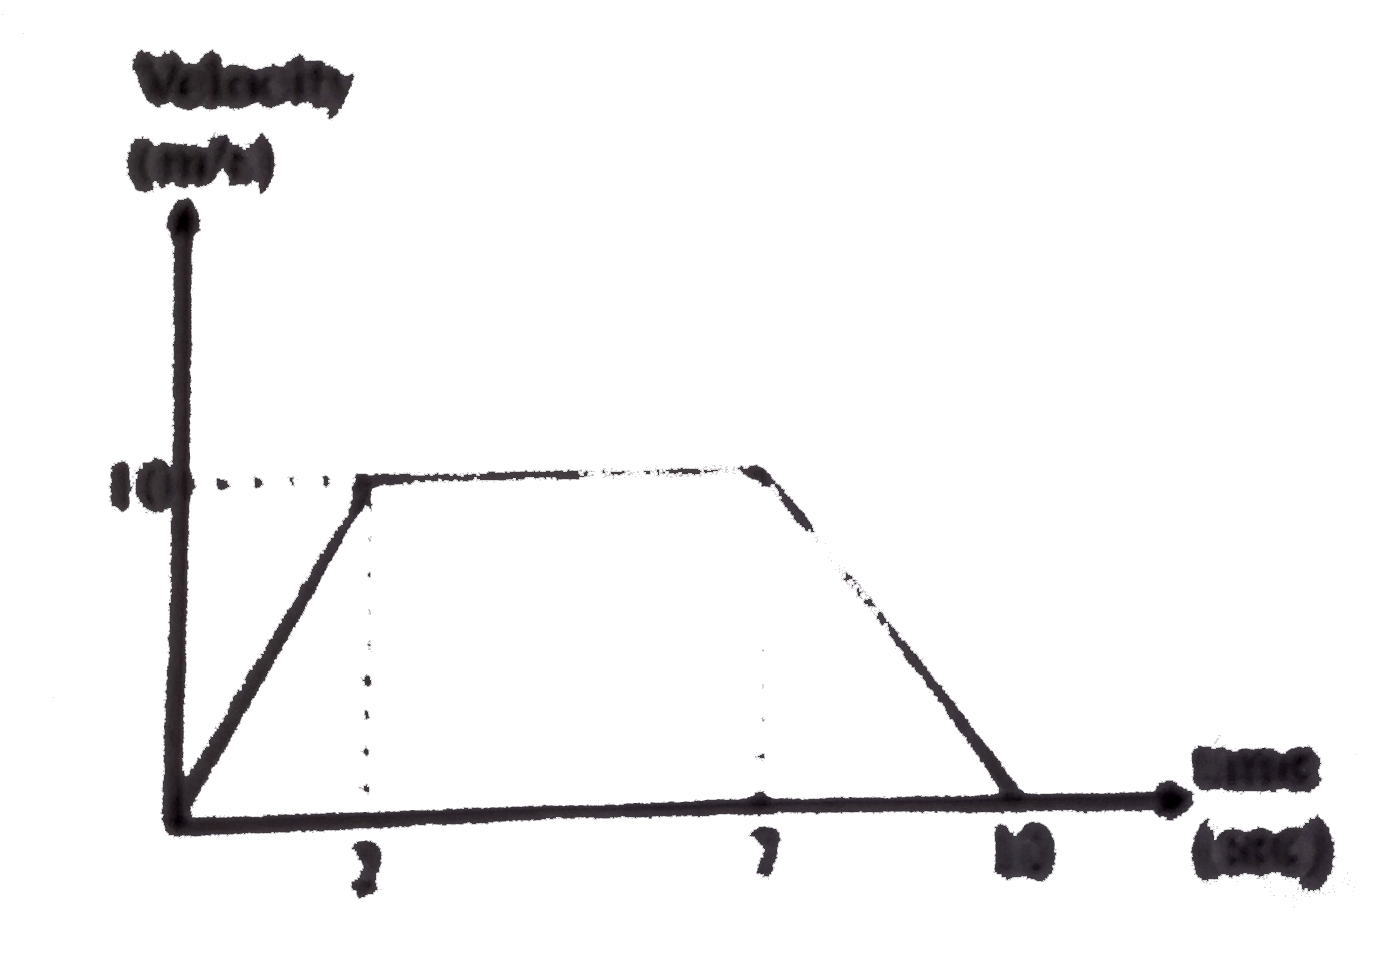 The braking force rewquired to boring the car to a stop with in one second from the maximum speed is:A100003NB5000NC10000ND50003N
The velocity time graph of the motion of a car is given here.
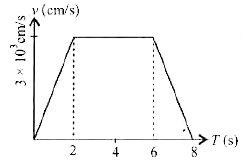 AThe distance travelled by the car in the first six seconds is 150 m.BThe deceleration of the car during the last two seconds are −15ms2.CThe distance travelled by the car in the first six second is 220 m.DThe deceleration of the car during the last two second is −20ms2
The velocity-time graph of a body moving in a straight line is shown below:

Which one of the following represents its acceleration time graph?
View SolutionThe velocity-time graph of a particle moving along a straight line is given as below. The displacement time curve for the particle is given by :
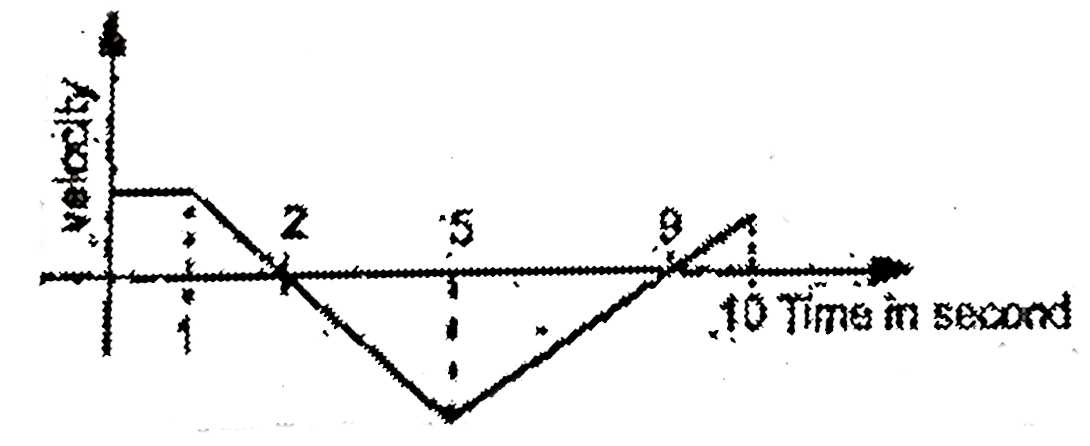
View SolutionThe velocity-time graph of a car moving along a straight road is shown in figure. The average velocity of the car in first 25 seconds is
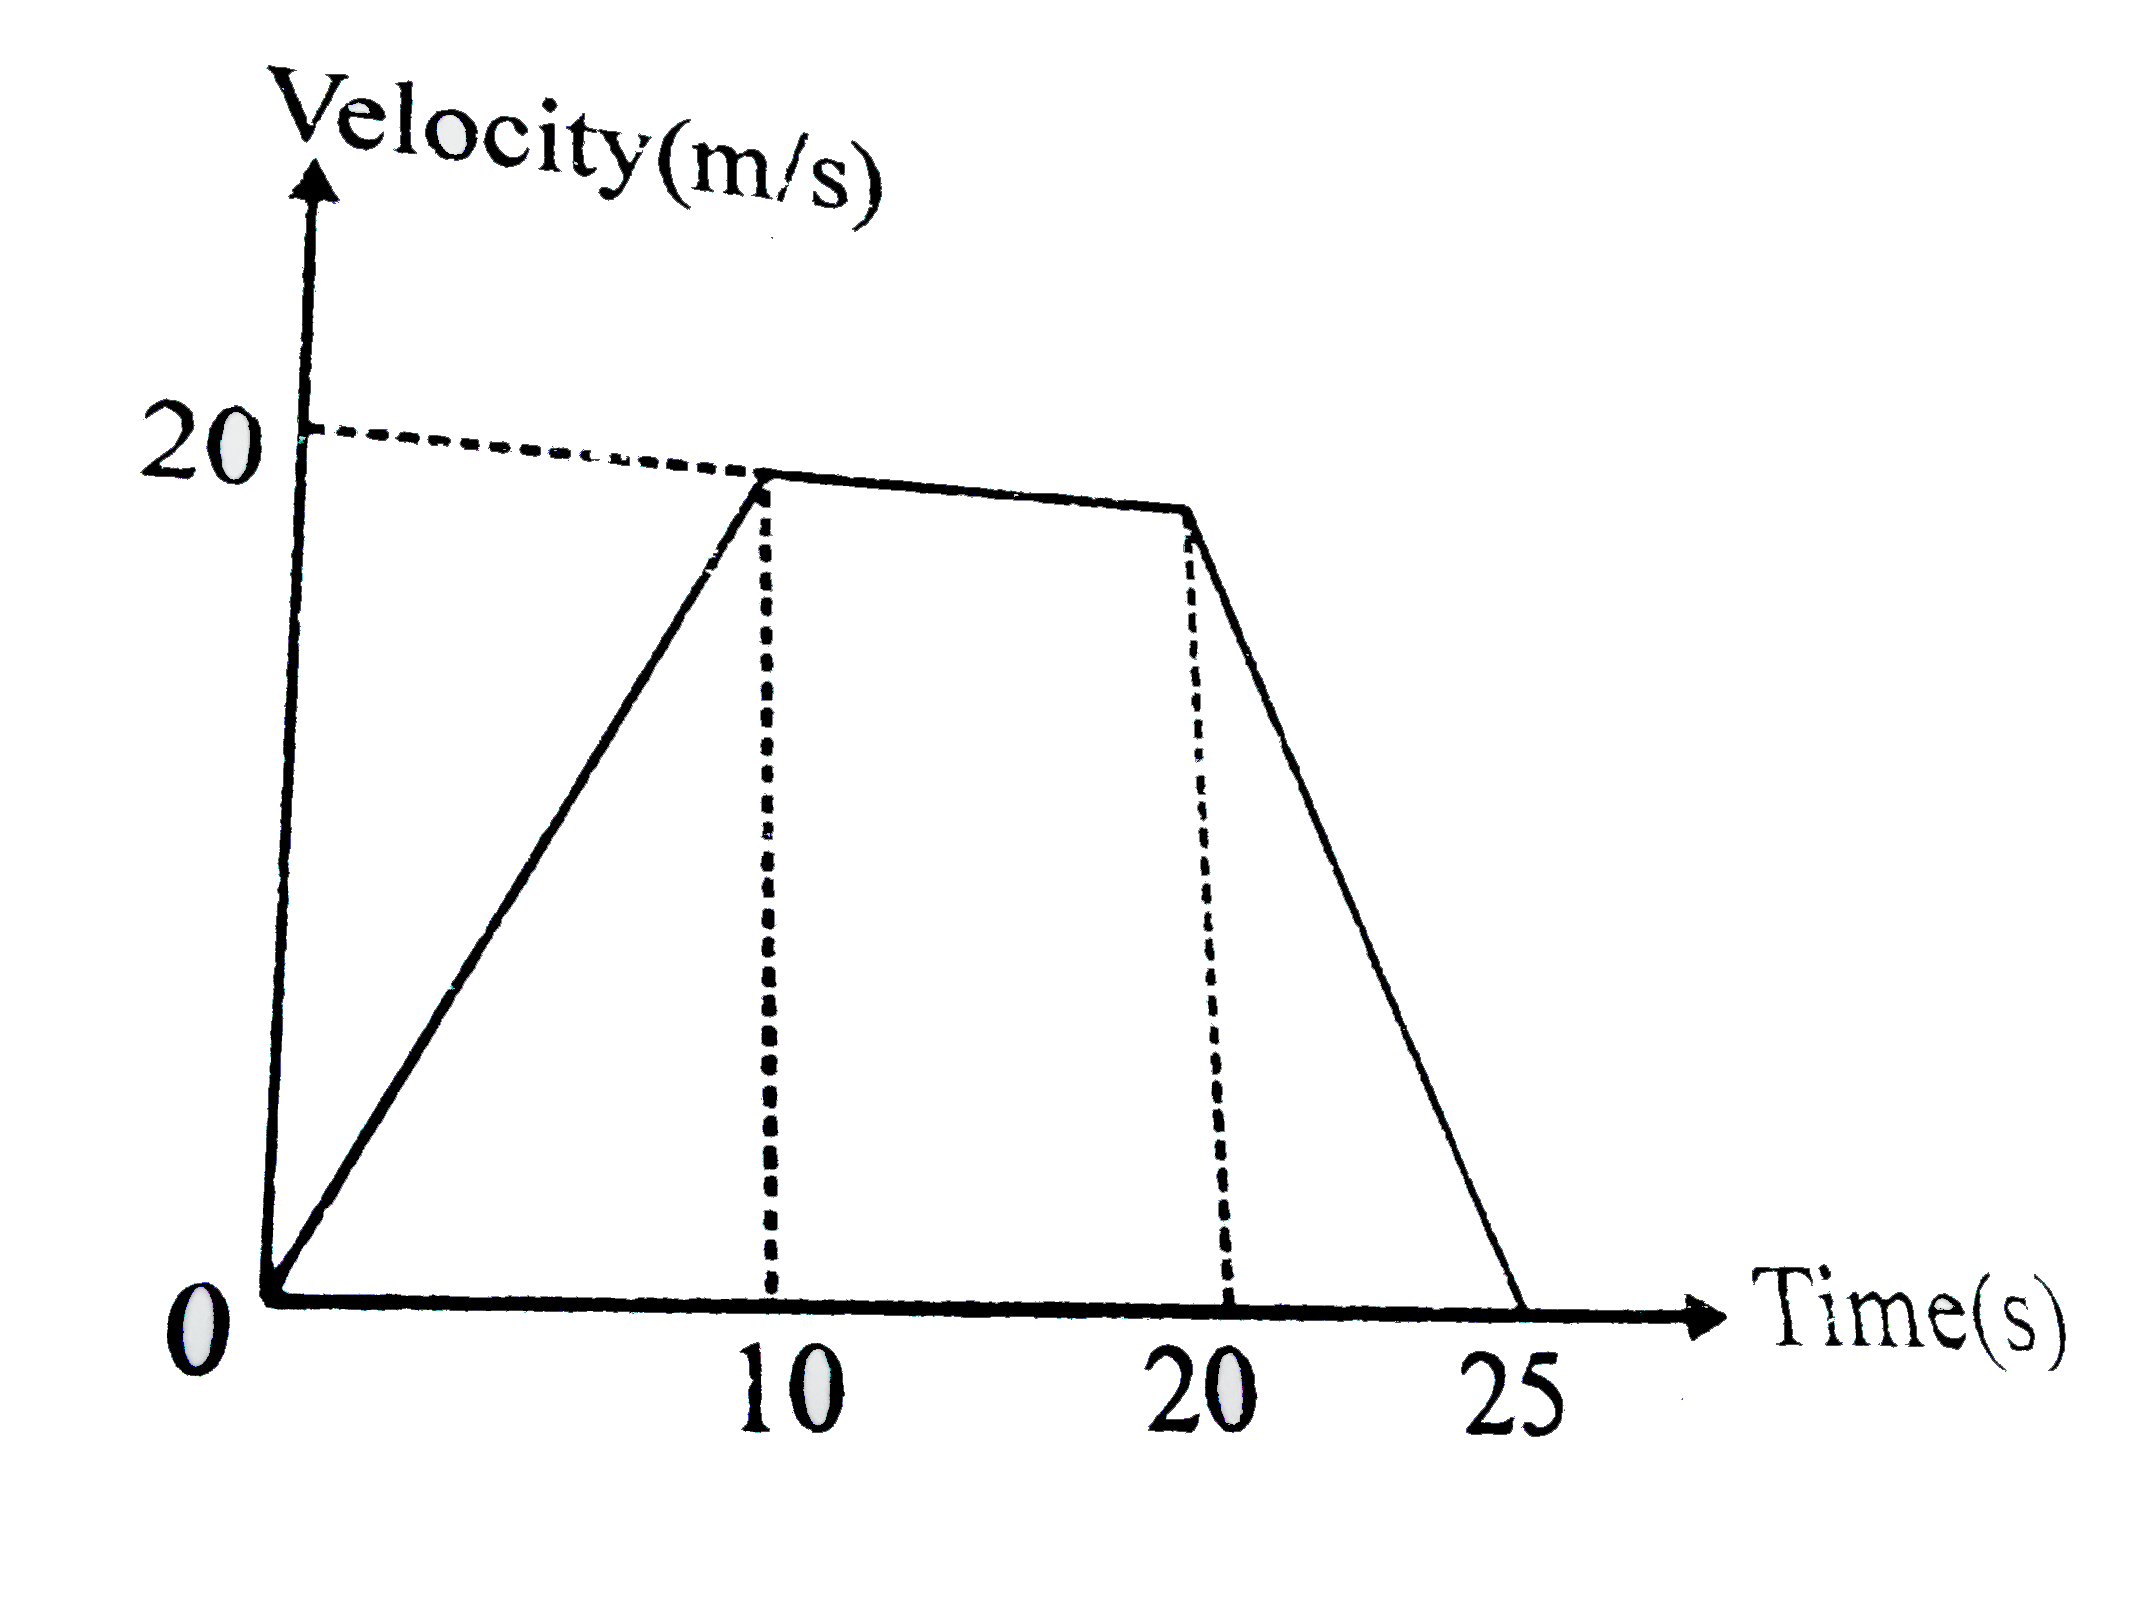
View SolutionThe velocity-time graph of a car moving along a straight road is shown in figure. The average velocity of the car is first 25 seconds is
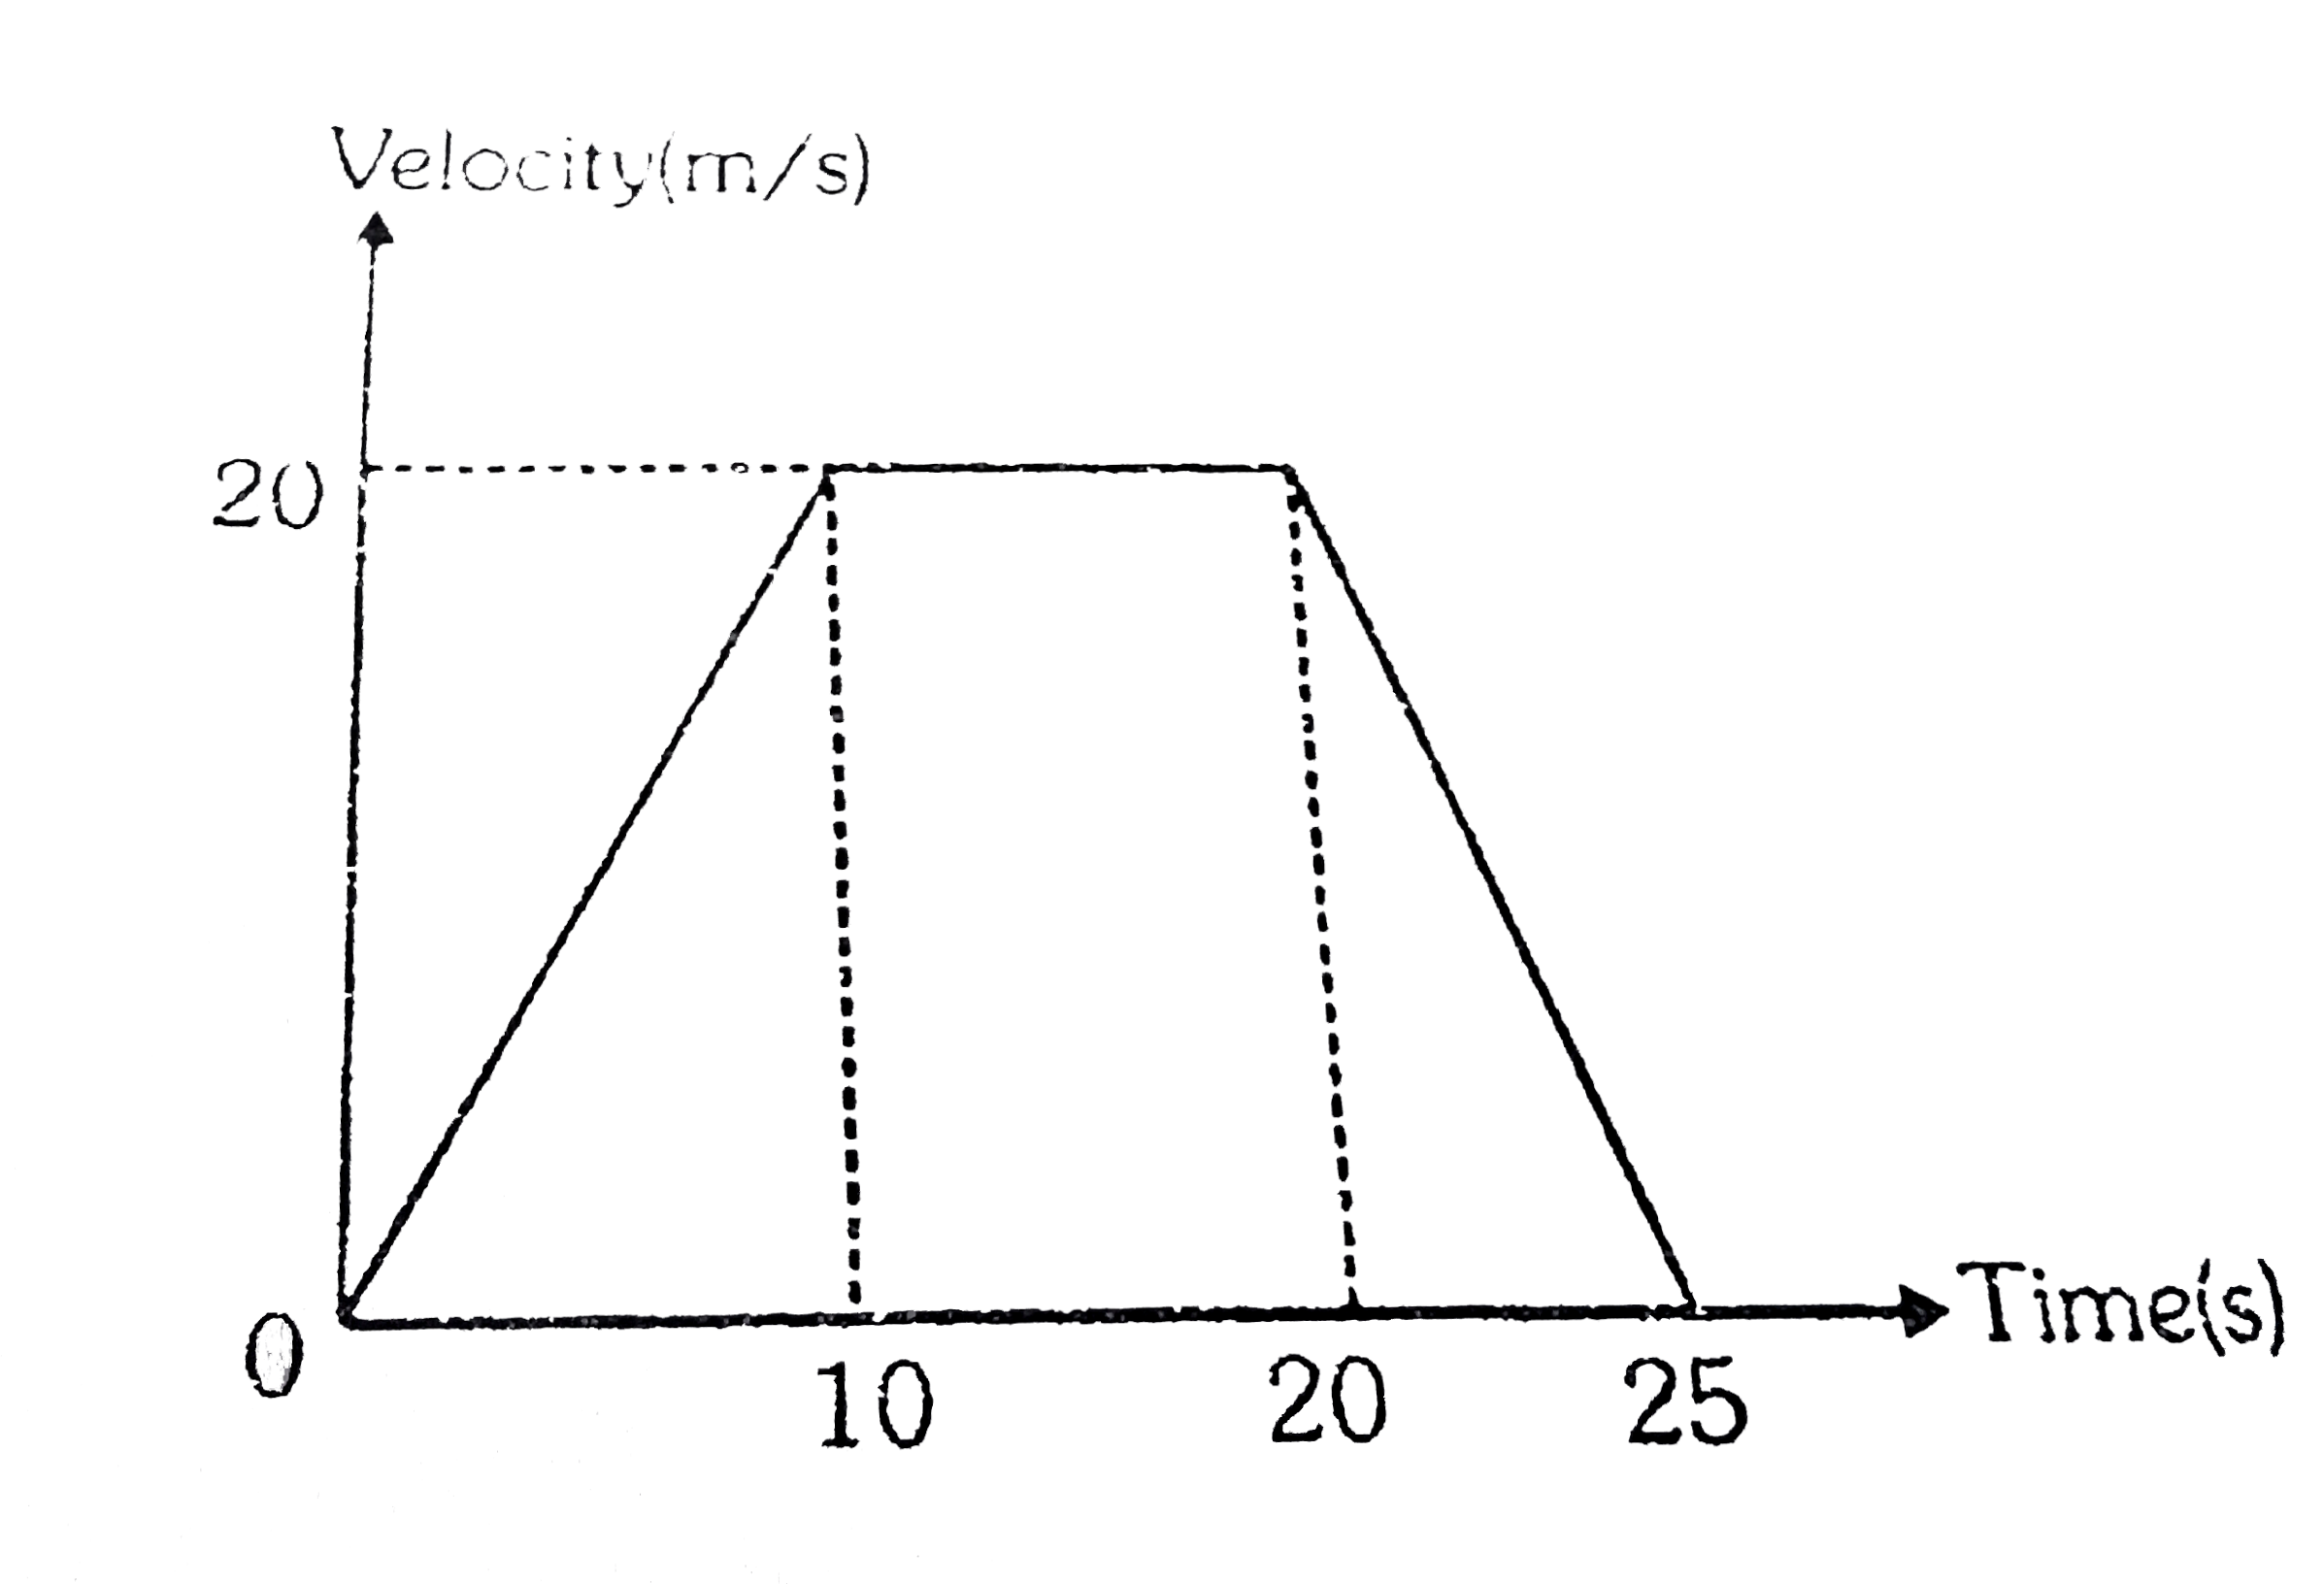
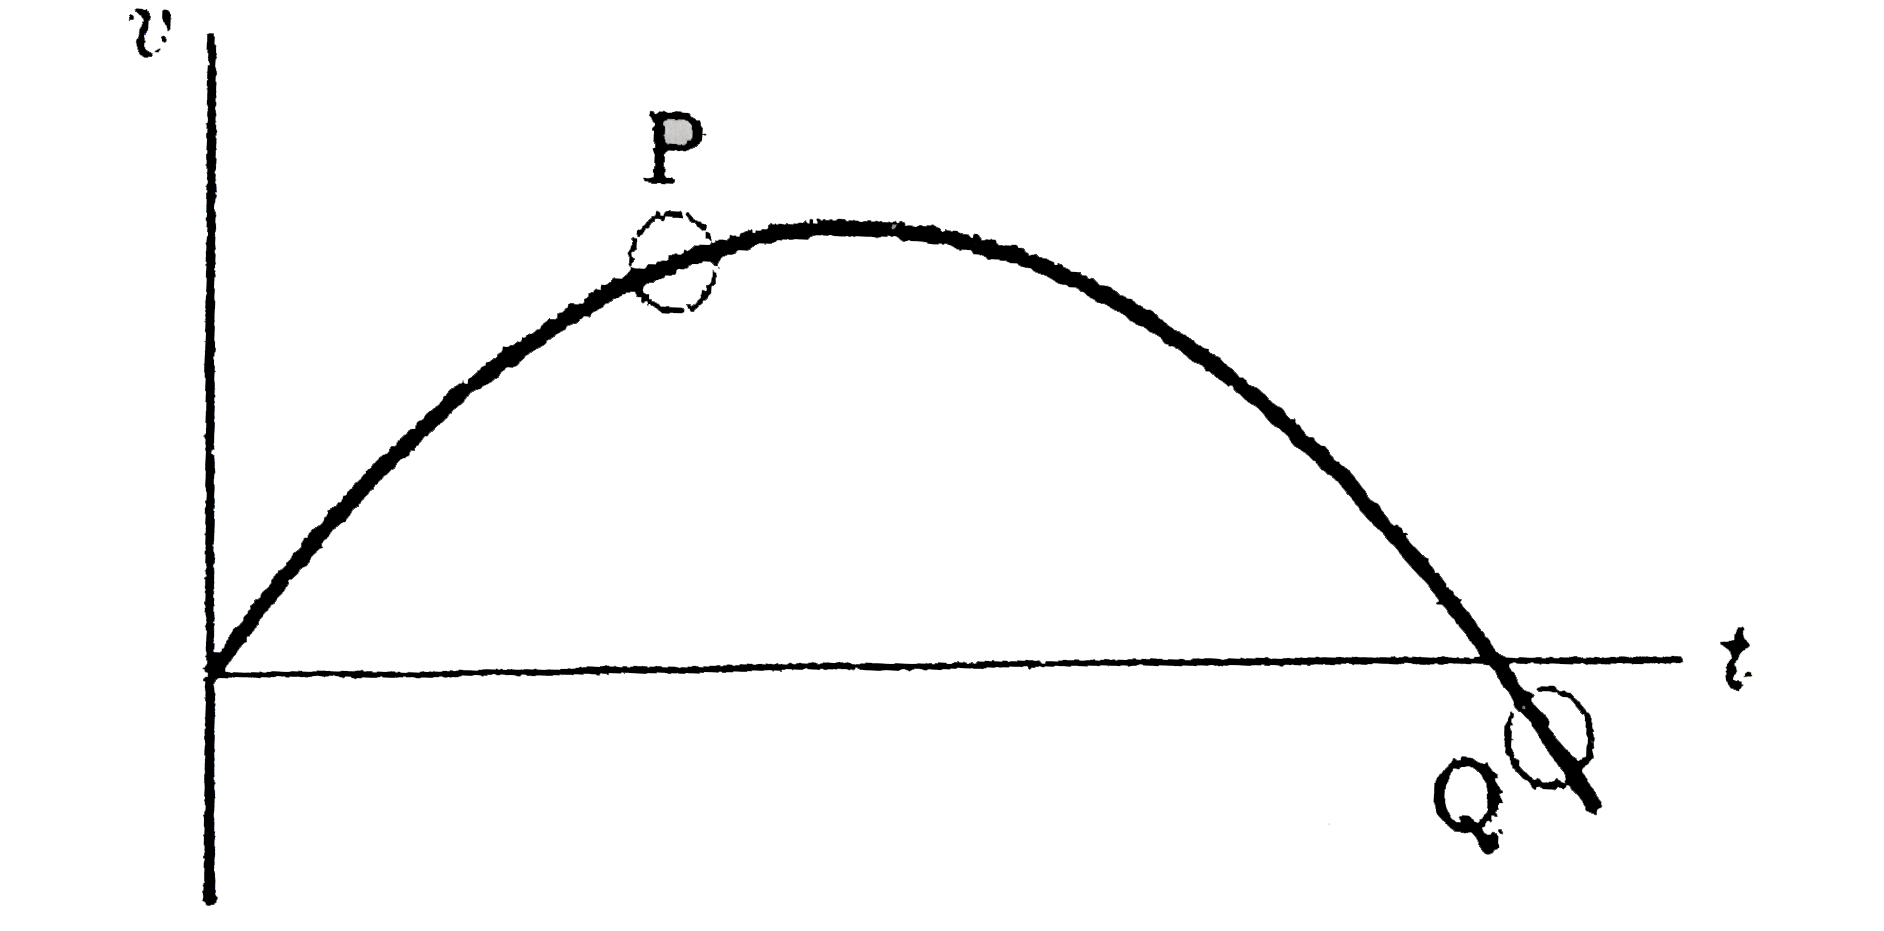
View SolutionThe diagram shows a velocity-time graph for a car moving in a straight line. At point Q the car must be
View Solution

