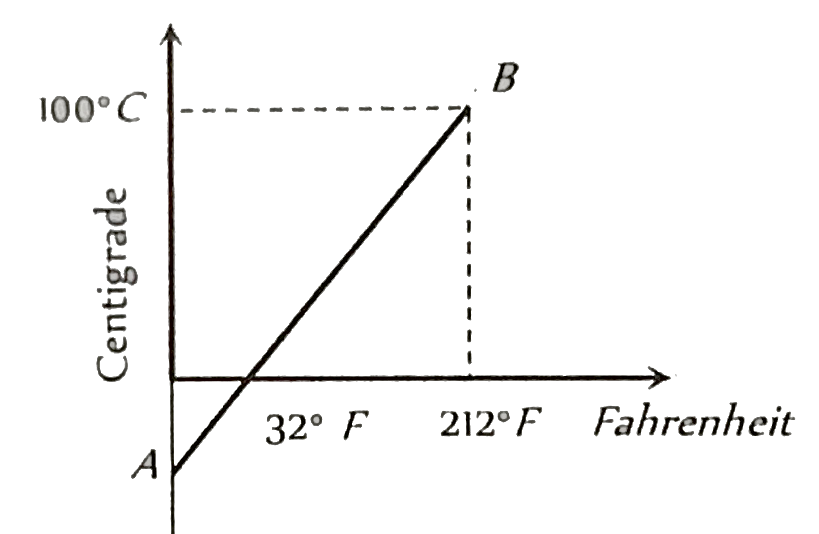
The graph between Celcius and Fahrenheit temperature of a body is shown in the Fig. 4.4. Show that the angle made by the graph with Celsius axis is sin−19√106.

We know,
C5=F−329or,C=59(F−32)or,F=95C+32
This is the equation of a straight line, Here the slope of the line, tanθ=95
∴ OA=√52+92=√106
∴ sinθ=9√106,
or, θ=sin−19√106

Topper's Solved these Questions
- THERMOMETRYBOOK - CHHAYA PUBLICATIONCHAPTER - THERMOMETRYEXERCISE - HIGH ORDER THINKING SKILL (HOTS) QUESTIONS
7 Videos
- THERMOMETRYBOOK - CHHAYA PUBLICATIONCHAPTER - THERMOMETRYEXERCISE - EXERCISE - MULTIPLE CHOICE QUESTIONS
10 Videos
- SUPERPOSITION OF WAVESBOOK - CHHAYA PUBLICATIONCHAPTER - SUPERPOSITION OF WAVESEXERCISE - CBSE Scanner
14 Videos
- VECTORBOOK - CHHAYA PUBLICATIONCHAPTER - VECTOREXERCISE - CBSE SCANNER
19 Videos
Similar Questions
Knowledge Check
The graph AB shown in figure is a plot of temperature of a body in degree celsius and degree Fahrenheit. Then
 ASlope of line AB is 9/5BSlope of line AB is 5/9CSlope of line AB is 1/9DSlope of line AB is 3/9
A graph is drawn between centigrade temperatures of a body along x-axis and corresponding Fahrenheit temperatures along y-axis. Slope of the graph is
View SolutionGraph shows the relation between Centigrade and Fahrenheit scales of temperature. Find the slope in each graph?
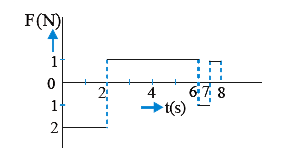
View SolutionA force-time graph for the motion of a body is shown in fig. Change in linear momentum between 0 and 8s is :

View SolutionA force-time graph for the motion of a body is shown in fig. Change in linear momentum between 0 and 8s is :

View Solution(a) Draw graph showing the variation of current versus voltage in an electroyte when an external resistance is also connceted.
(b) (i) The graph between resistance (R ) and temperature (T) for Hg is shown in the figure (a). Explain the behaviour of Hg near 4k.
(ii) In which region of the graph shown in the figure (b) is the resistance negative and why?

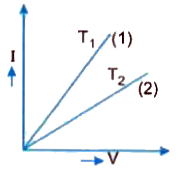
View SolutionI-V graph for a given metallic wire at two temperatures T1 and T2 is as shown in Fig. Which of the two temperatures is lower and why?

View Solution
