A graph is plotted between the temperature of a copper cube in .∘C versus .∘F. The sine of the angle made by the graph with .∘F axis is
2√106
3√106
4√106
5√106
Step by step video & image solution for A graph is plotted between the temperature of a copper cube in .^(@)C versus .^(@)F. The sine of the angle made by the graph with .^(@)F axis is by Physics experts to help you in doubts & scoring excellent marks in Class 12 exams.
Updated on:21/07/2023Topper's Solved these Questions
- HEAT AND THERMAL EXPANSIONBOOK - PHYSICS GALAXY - ASHISH ARORACHAPTER - HEAT AND THERMAL EXPANSIONEXERCISE - ADVANCE MCQs WITH ONE OR MORE OPTIONIS CORRECT
24 Videos
- HEAT AND THERMAL EXPANSIONBOOK - PHYSICS GALAXY - ASHISH ARORACHAPTER - HEAT AND THERMAL EXPANSIONEXERCISE - UNSOLVED NUMRICAL PROBLEMS FOR PREPARATION OF NSEP, INPhO & IPhO
82 Videos
- HEAT AND THERMAL EXPANSIONBOOK - PHYSICS GALAXY - ASHISH ARORACHAPTER - HEAT AND THERMAL EXPANSIONEXERCISE - CONCEPTUAL MCQs SINGLE OPTION CORRECT
15 Videos
- GEOMETRICAL OPTICSBOOK - PHYSICS GALAXY - ASHISH ARORACHAPTER - GEOMETRICAL OPTICSEXERCISE - Unsolved Numerical Problems
107 Videos
- HEAT TRANSFER BOOK - PHYSICS GALAXY - ASHISH ARORACHAPTER - HEAT TRANSFER EXERCISE - Unsolved Numerical Problems for Preparation of NSEP,INPhO&IPhO
66 Videos
Similar Questions
Knowledge Check
The graph plotted between concentration versus time
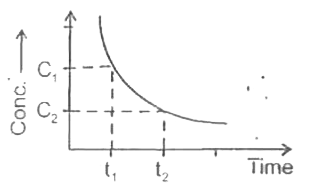 AIt gives rate of disappearance of reactantBRate =(d[C2−C1)])t2−t1CBoth (1) & (2)DIt predicts the order of reaction
The graph plotted between acceleration and displacement of a particle in SHM is
Aa straight lineBa circleCan ellipseDa hyperbolaThe graph between angle of deviation (δ) and angle of incidence (i) for a triangular prism is represented by
A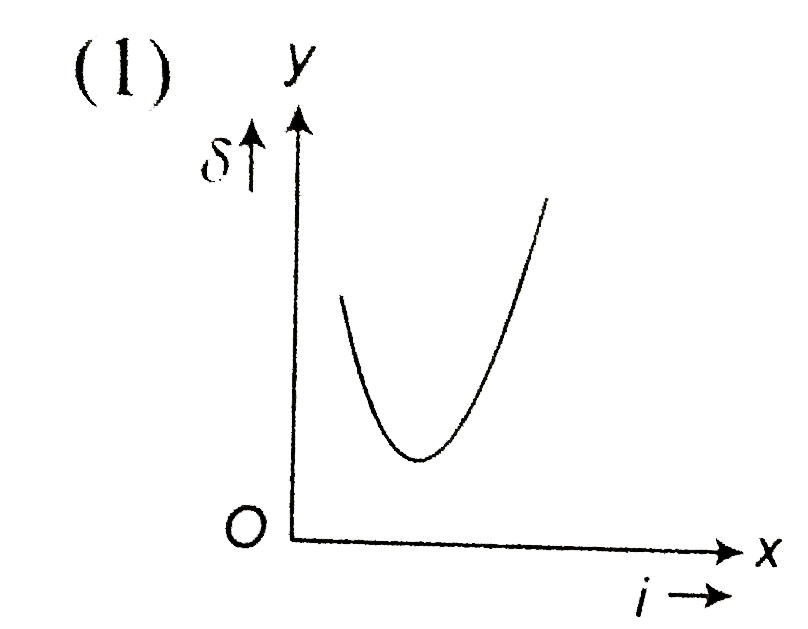 B
B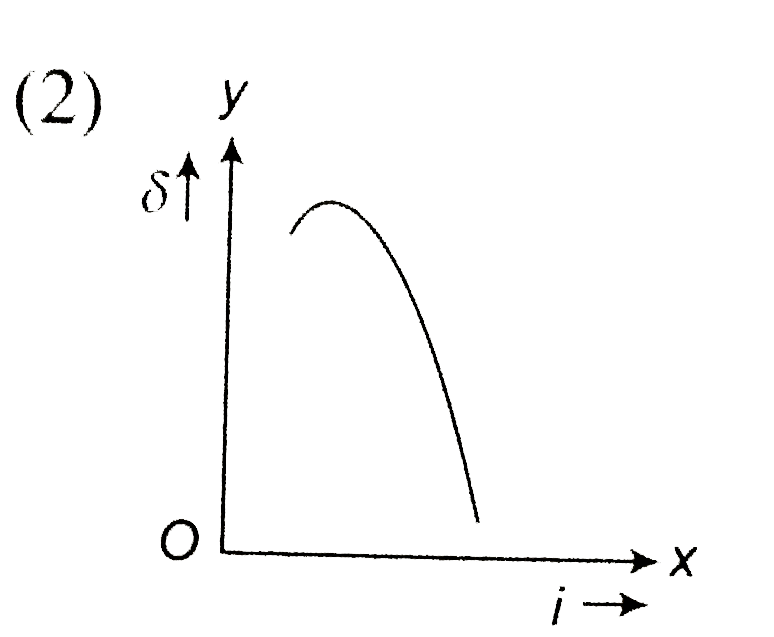 C
C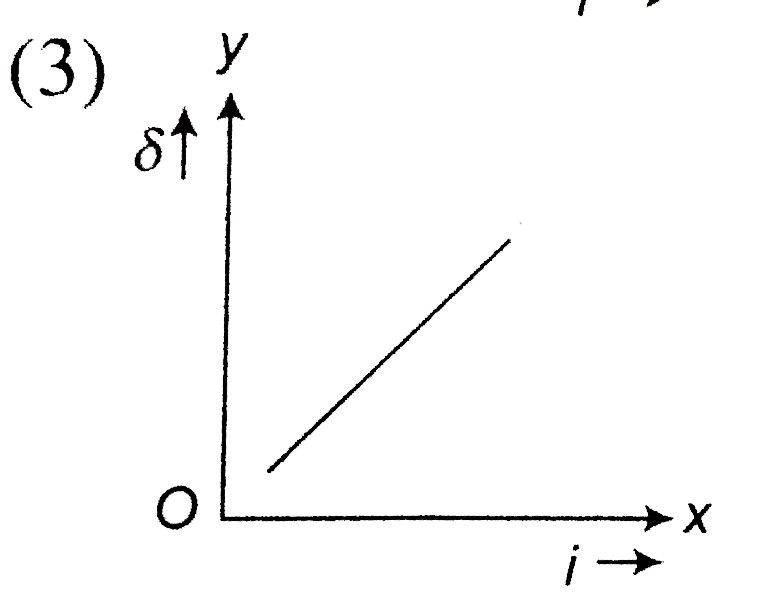 D
D
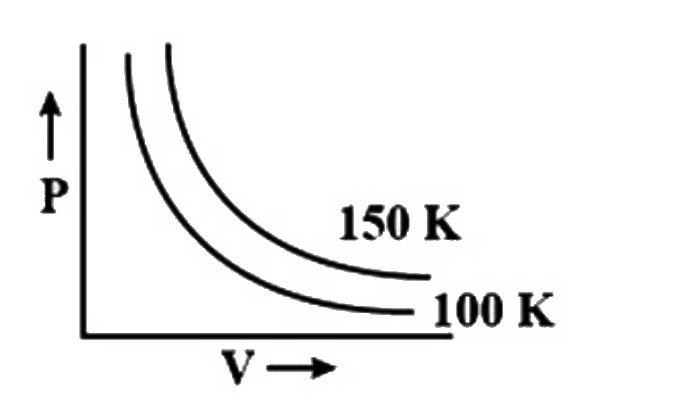
A graph is plotted between pressure and volume at different temperature. On the basis of the graph what changes will you observe in the volume if
(i) the pressure is increased at constant temperature
(ii) the temperature is decreased at constant pressure
View SolutionIf a graph is plotted taking the temperature in Fahrenheit along the Y-axis and the corresponding temperature in Celsius along the X-axis, it will be a straight line
View SolutionA graph was plotted taking the temperature in .∘C along the X-axis and the corresponding temperature in Kelvin along the Y-axis. Which of the curves in Fig, 6.1 most correctly represents this behaviour?
View SolutionA graph plotted between logk versus 1/T for calculating activation energy is shown by
View SolutionA graph plotted between logk versus 1/T for calculating activation energy is shown by
View Solution

