The graph between linear monentum (p) and Kinetic energy (k) is best represented by
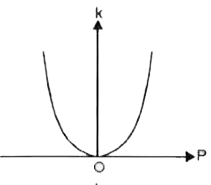
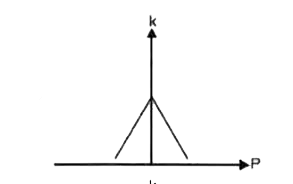
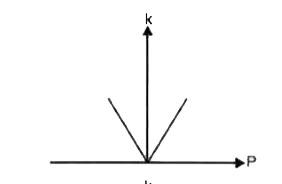
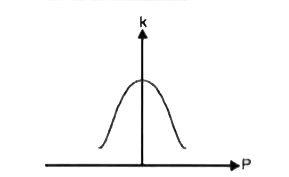
The correct Answer is:A
To solve the problem of determining the best representation of the graph between linear momentum (p) and kinetic energy (K), we can follow these steps:
Step 1: Understand the relationship between kinetic energy and momentum
The kinetic energy (K) of an object is given by the formula:
K=12mv2
where m is the mass of the object and v is its velocity.
The momentum (p) of the object is defined as:
p=mv
Step 2: Express velocity in terms of momentum
From the momentum equation, we can express velocity v as:
v=pm
Step 3: Substitute velocity in the kinetic energy formula
We can substitute this expression for v back into the kinetic energy formula:
K=12m(pm)2
K=12m⋅p2m2
K=p22m
Step 4: Identify the relationship between K and p
From the equation K=p22m, we can see that kinetic energy (K) is directly proportional to the square of momentum (p):
K∝p2
Step 5: Determine the graph representation
Since K is proportional to p2, when we plot kinetic energy (K) on the y-axis and momentum (p) on the x-axis, the graph will be a parabola that opens upwards. This is because the relationship is quadratic.
Step 6: Analyze the options
We need to find the graph that represents this relationship:
- The graph should show a parabola opening upwards.
- At p=0, K should also be 0.
Conclusion
Based on the analysis, the graph that best represents the relationship between linear momentum (p) and kinetic energy (K) is the one that shows a parabola opening upwards, which corresponds to option 1.
The kinetic energy (K) of an object is given by the formula:
K=12mv2
where m is the mass of the object and v is its velocity.
p=mv
From the momentum equation, we can express velocity v as:
v=pm
We can substitute this expression for v back into the kinetic energy formula:
K=12m(pm)2
K=12m⋅p2m2
K=p22m
From the equation K=p22m, we can see that kinetic energy (K) is directly proportional to the square of momentum (p):
K∝p2
Since K is proportional to p2, when we plot kinetic energy (K) on the y-axis and momentum (p) on the x-axis, the graph will be a parabola that opens upwards. This is because the relationship is quadratic.
We need to find the graph that represents this relationship:
- The graph should show a parabola opening upwards.
- At p=0, K should also be 0.
Based on the analysis, the graph that best represents the relationship between linear momentum (p) and kinetic energy (K) is the one that shows a parabola opening upwards, which corresponds to option 1.
Topper's Solved these Questions
- MISCELLANEOUS QUESTIONSBook:MCGROW HILL PUBLICATIONChapter:MISCELLANEOUS QUESTIONSExercise:PART-B
Explore 99 Videos
- MEASUREMENTBook:MCGROW HILL PUBLICATIONChapter:MEASUREMENTExercise:ELEMENTARY QUESTIONS (HIGHER ORDER THINKING QUESTIONS)
Explore 13 Videos
- MOTIONBook:MCGROW HILL PUBLICATIONChapter:MOTIONExercise:HIGHER ORDER THINKING QUESTIONS
Explore 48 Videos
Similar Questions
Knowledge Check
Which one of the following correctly represents the variation between linear momentum (P) and kinetic energy (E) ofa body?
A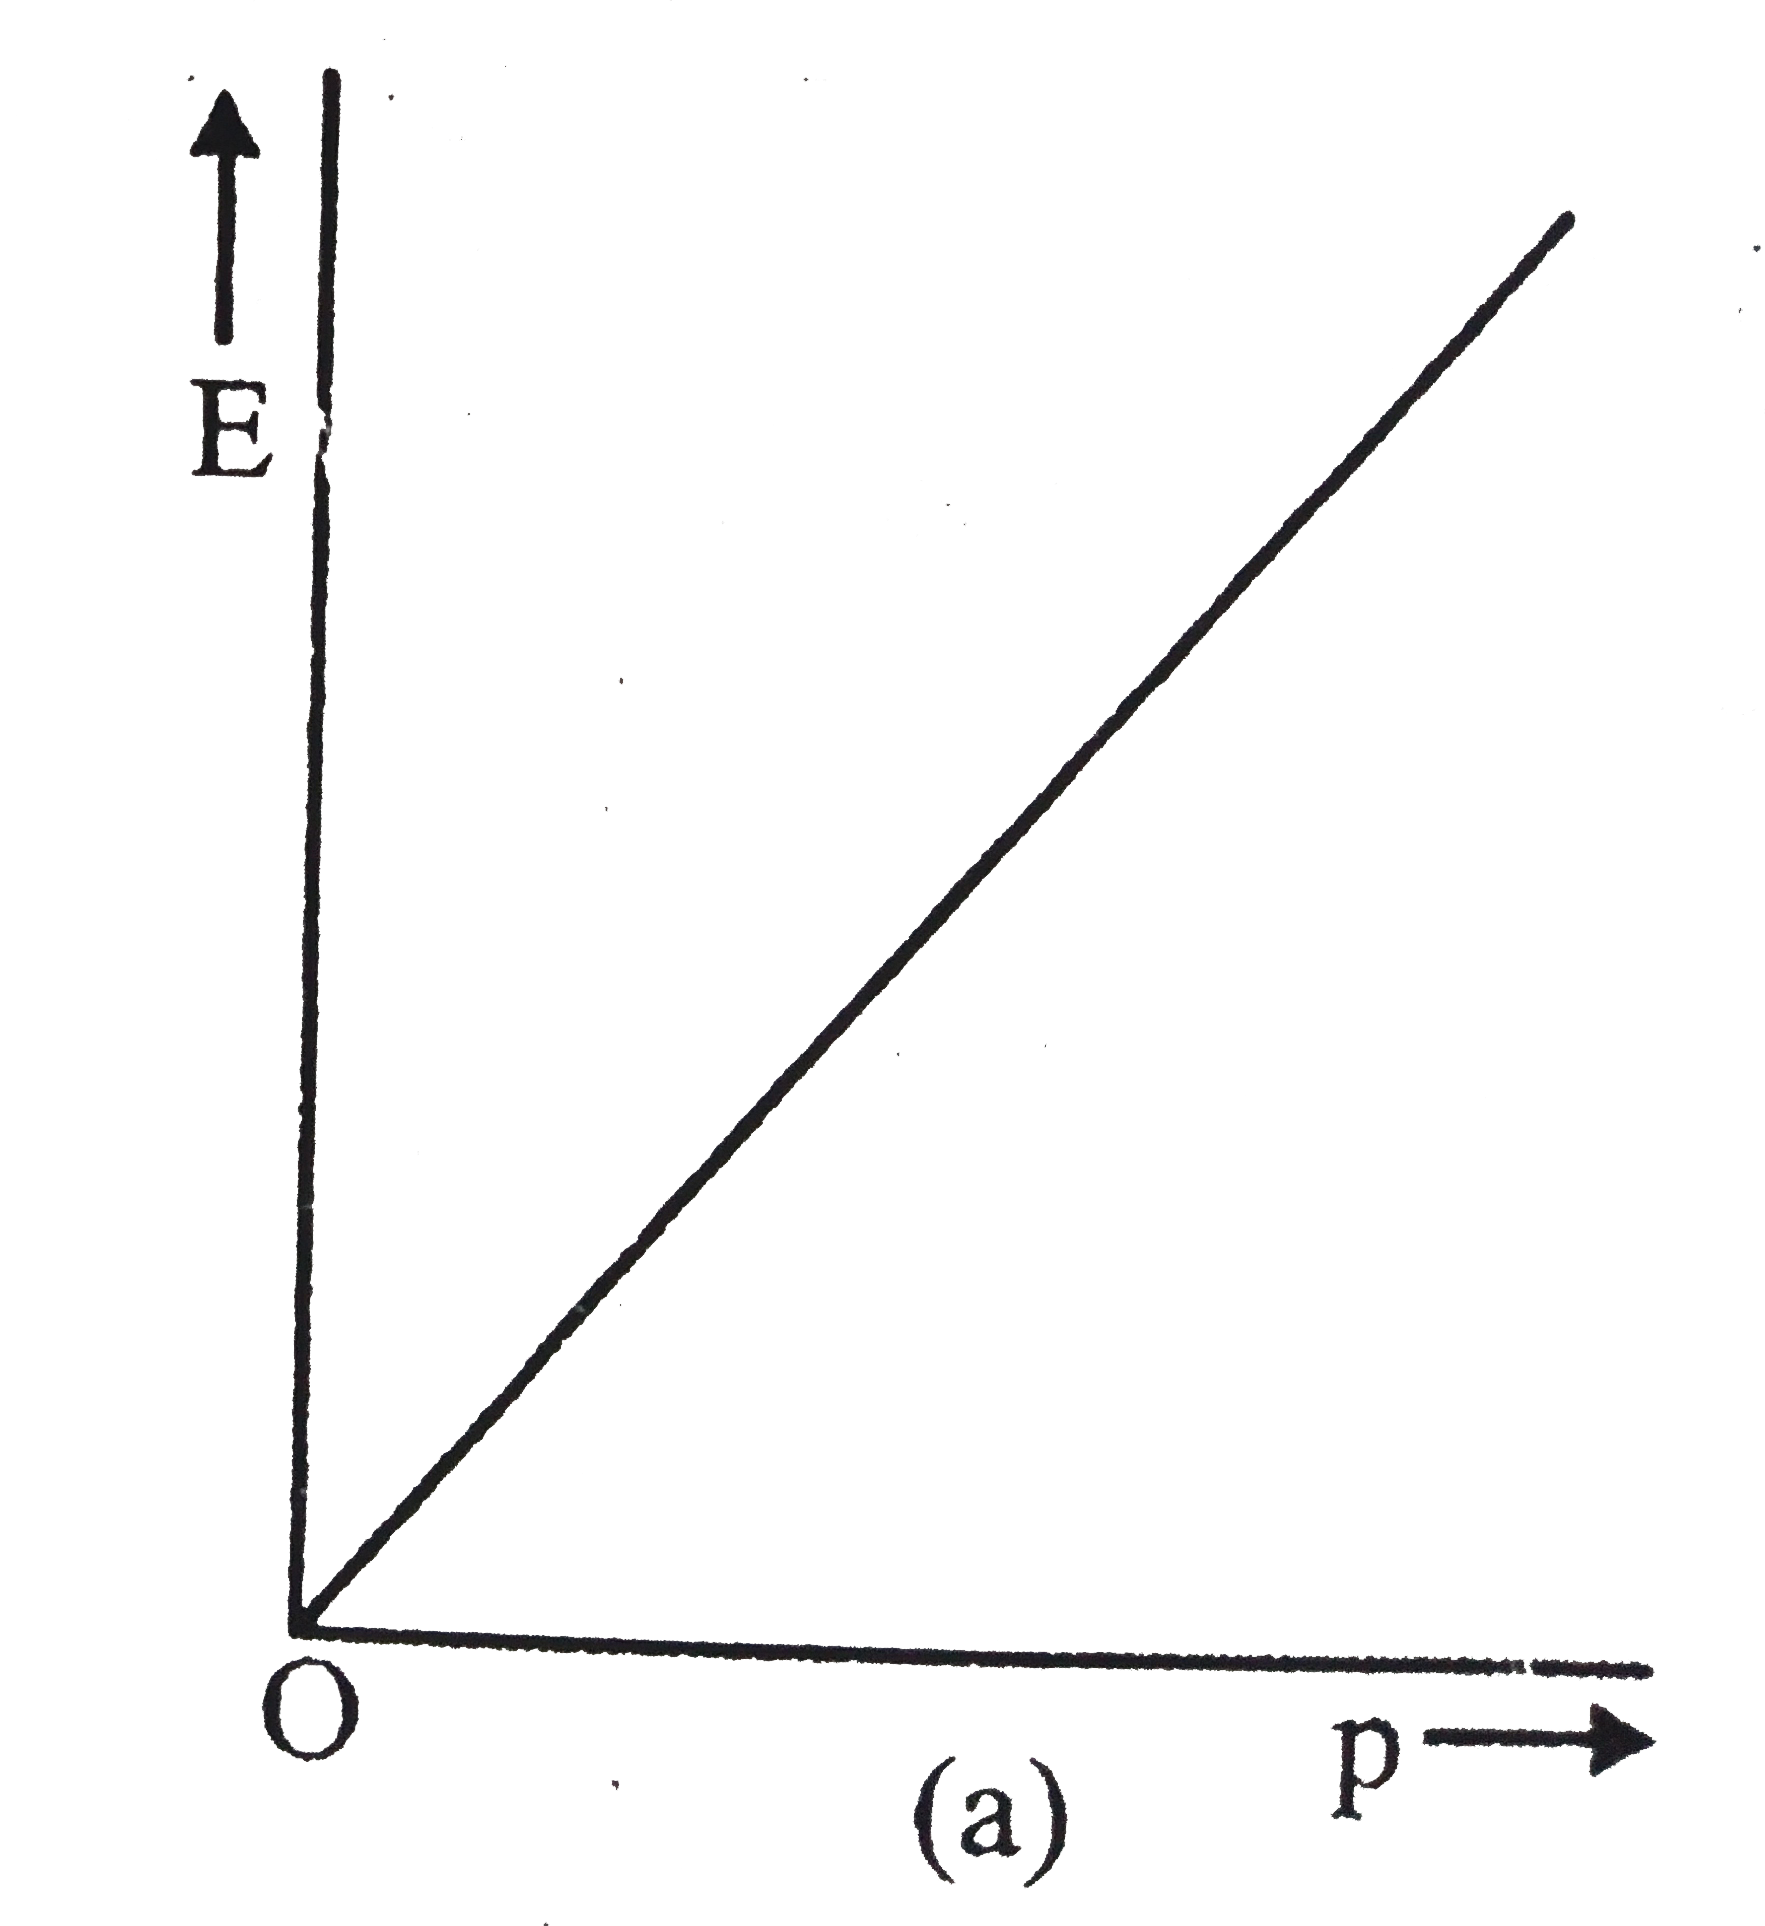 B
B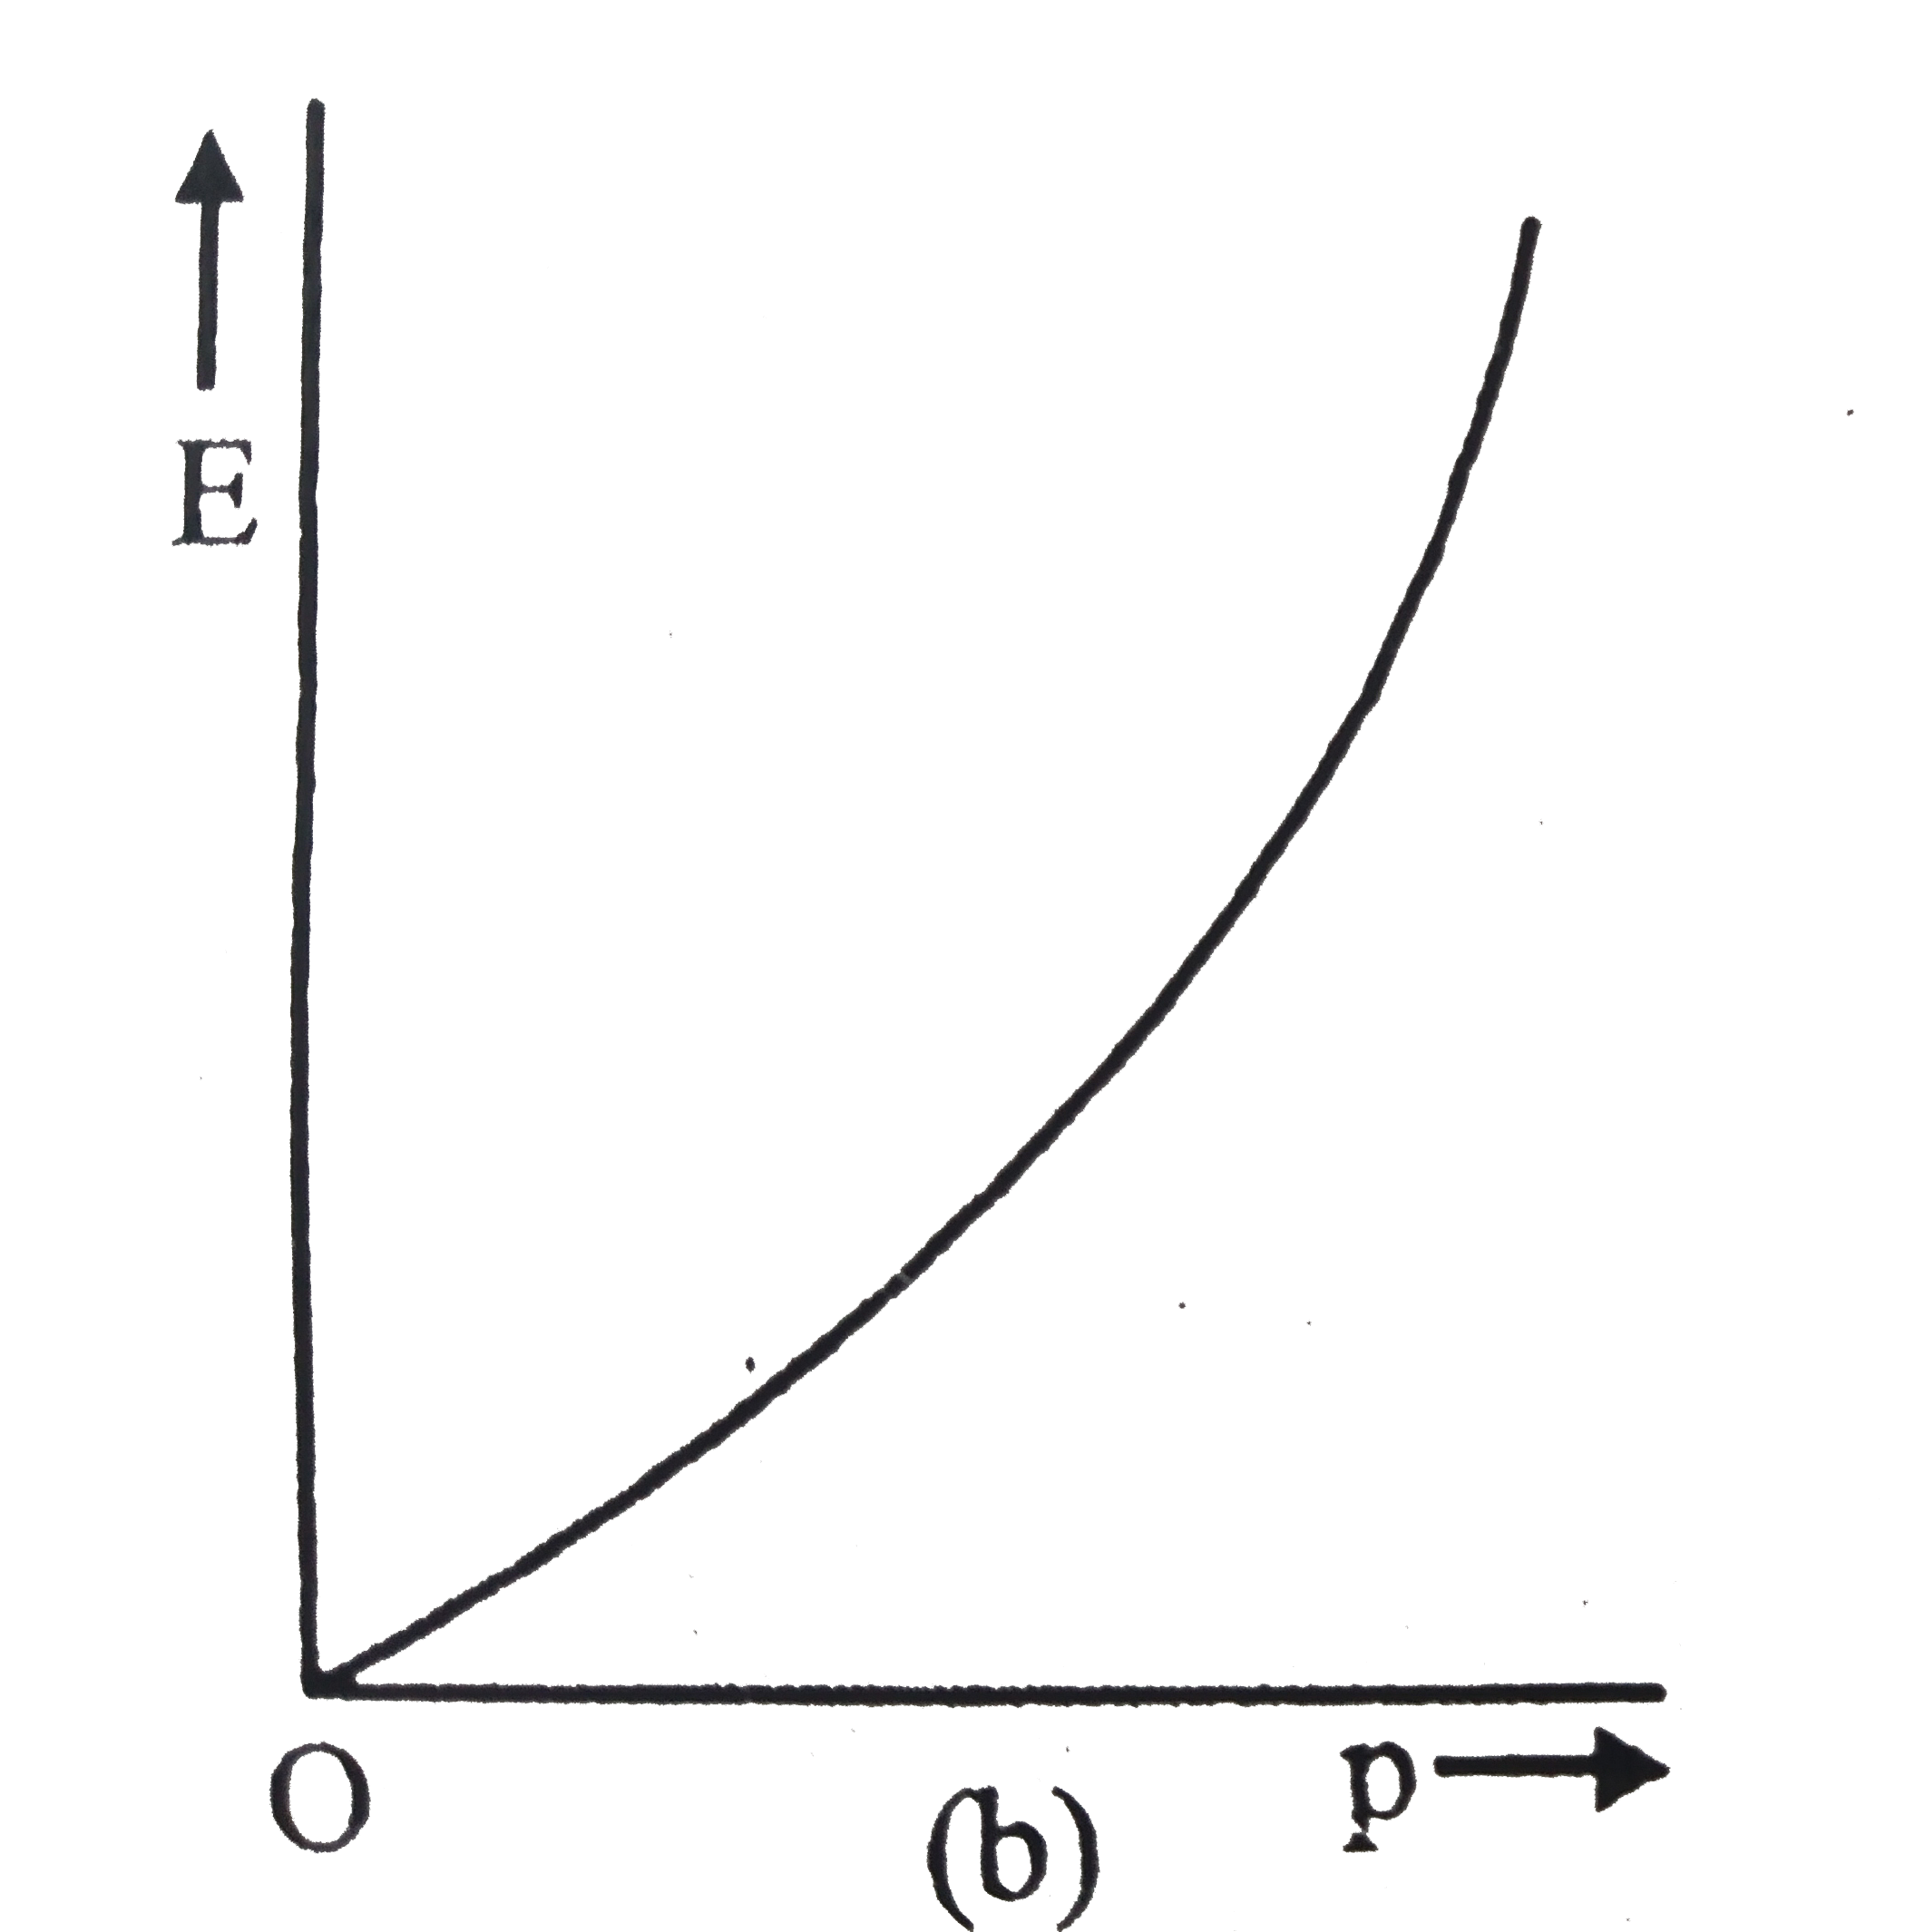 C
C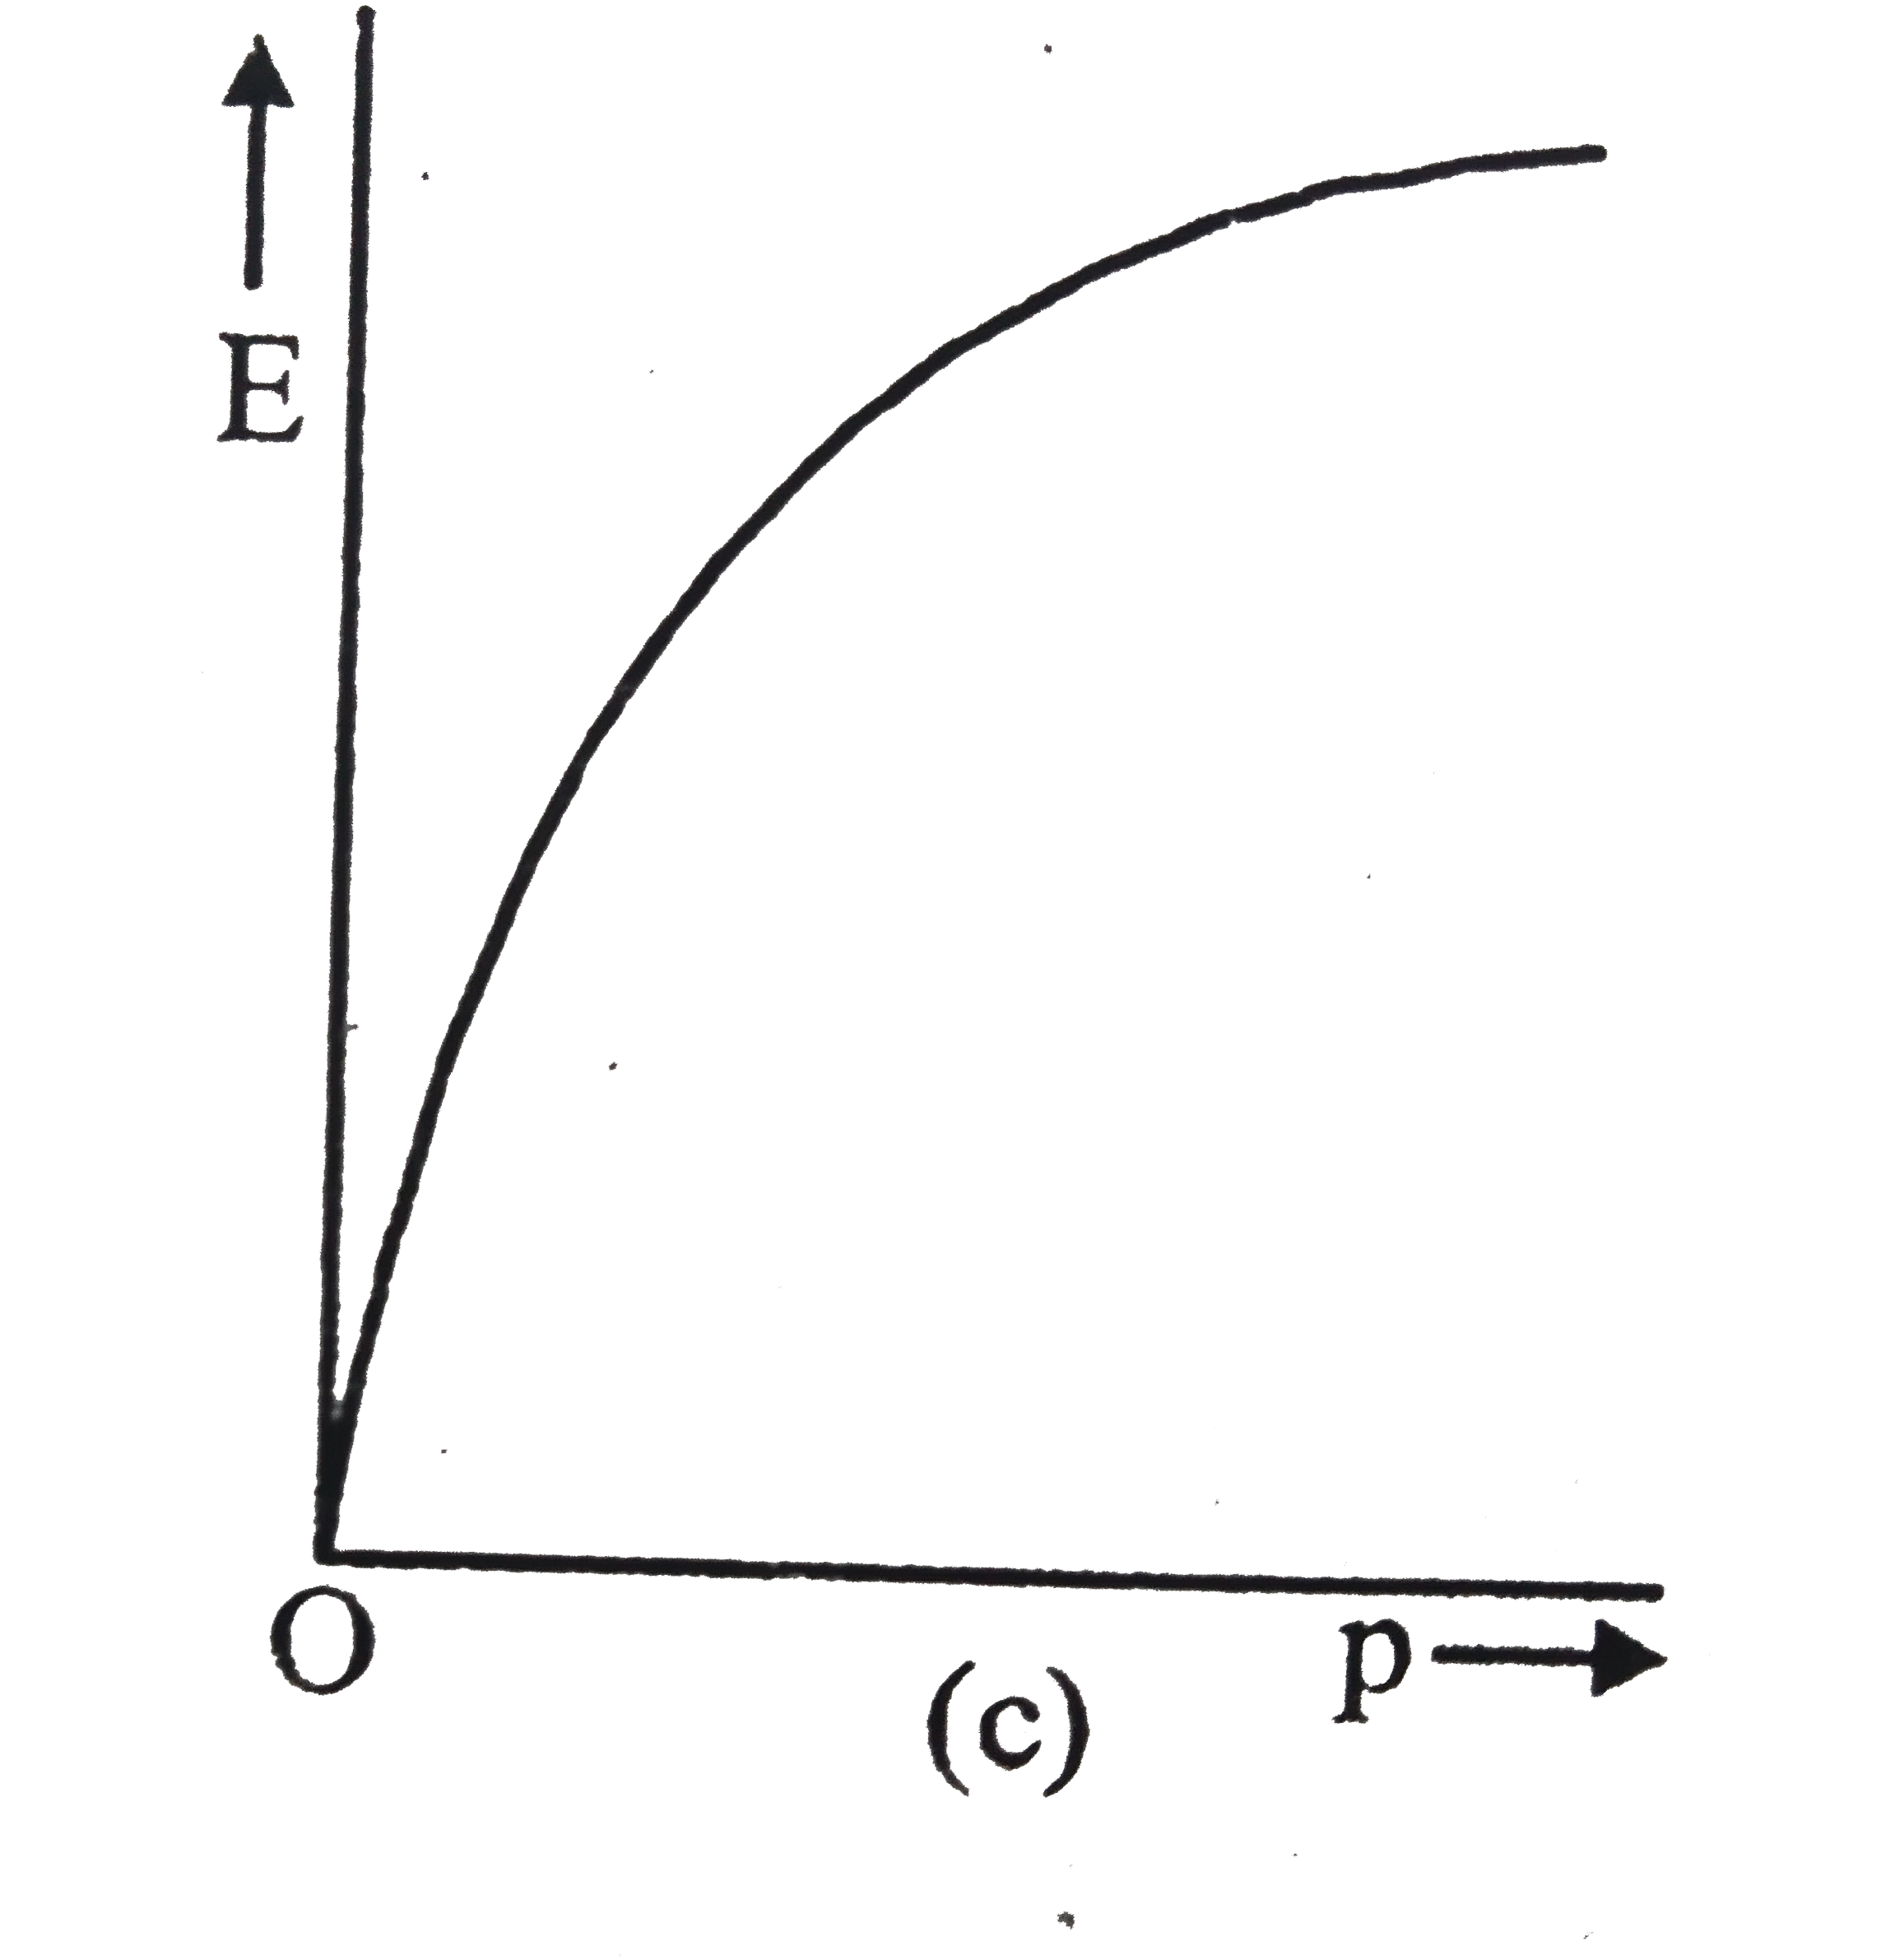 D
D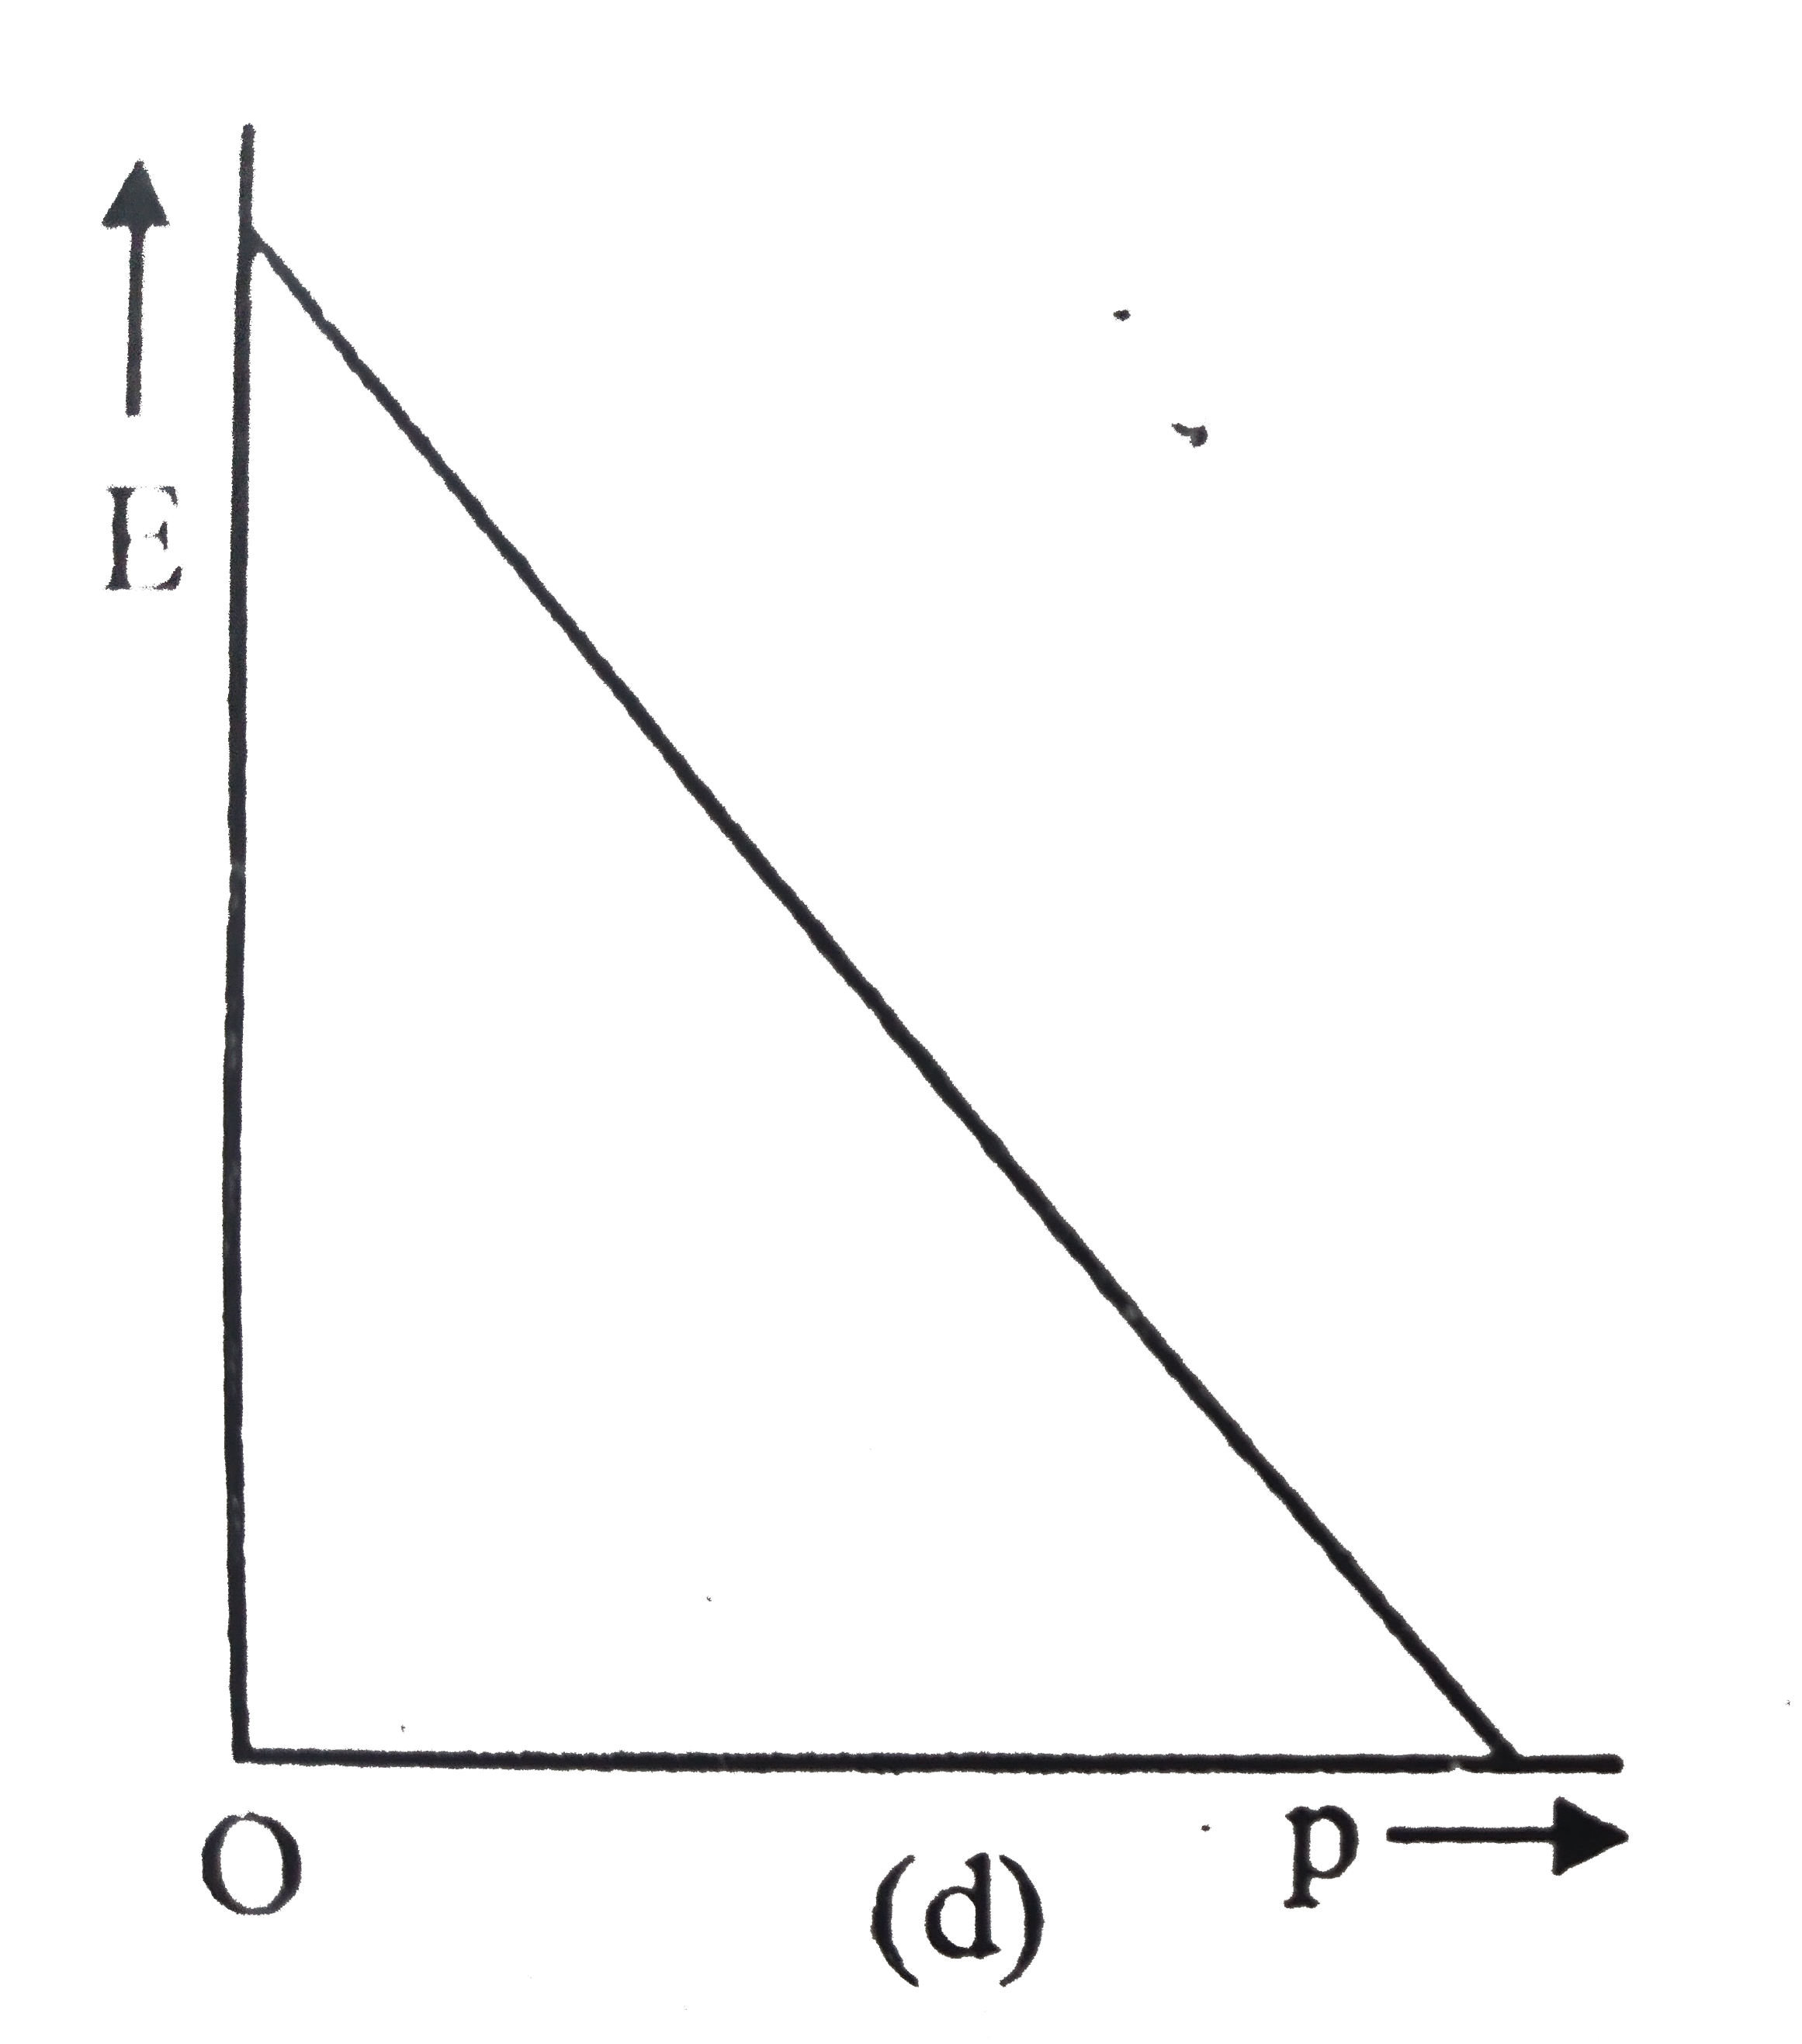
On a particle placed at origin a variable force F=−ax(where a is a positive constant) is applied. If U(0)=0, the graph between potential energy of particle U(x) and x is best represented by:-
A B
B C
C D
D
Which of the following graphs represents the graphical relation between momentum (p) and kinetic energy (K) for a body in motion?
A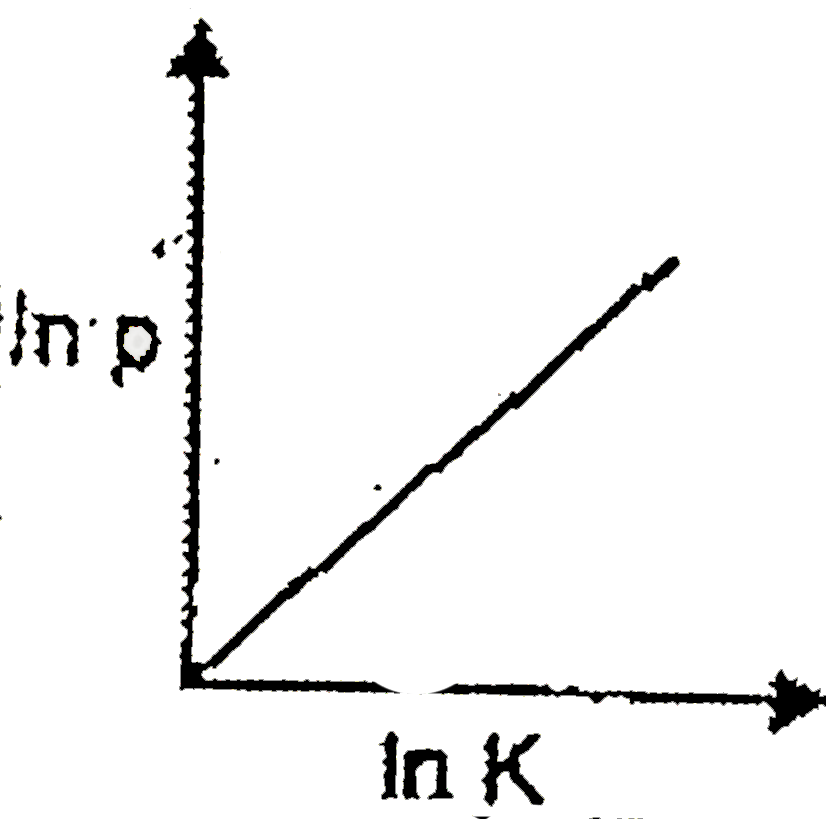 B
B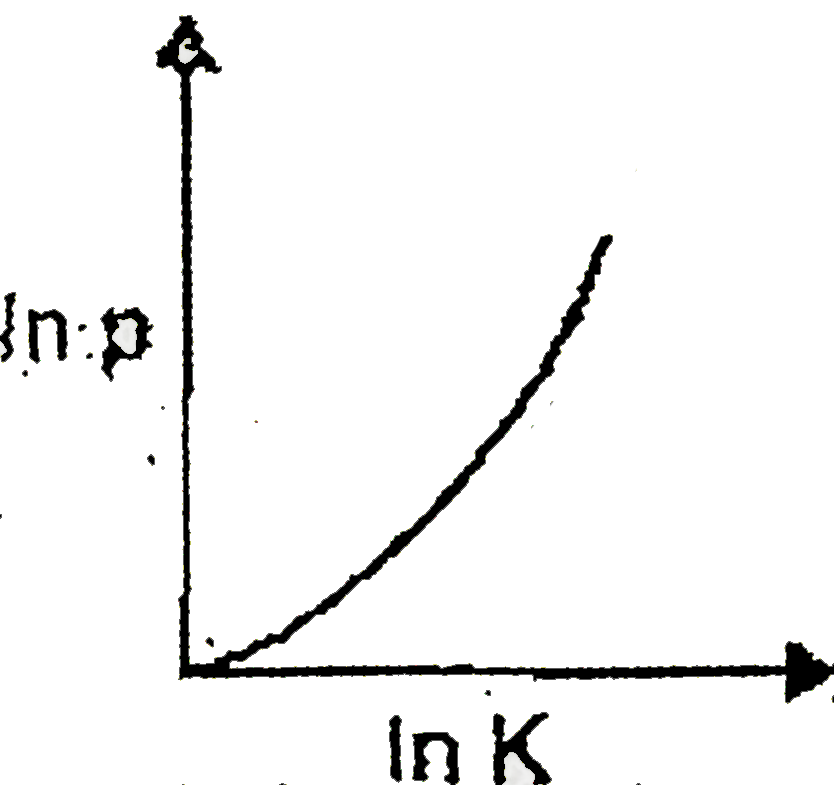 C
C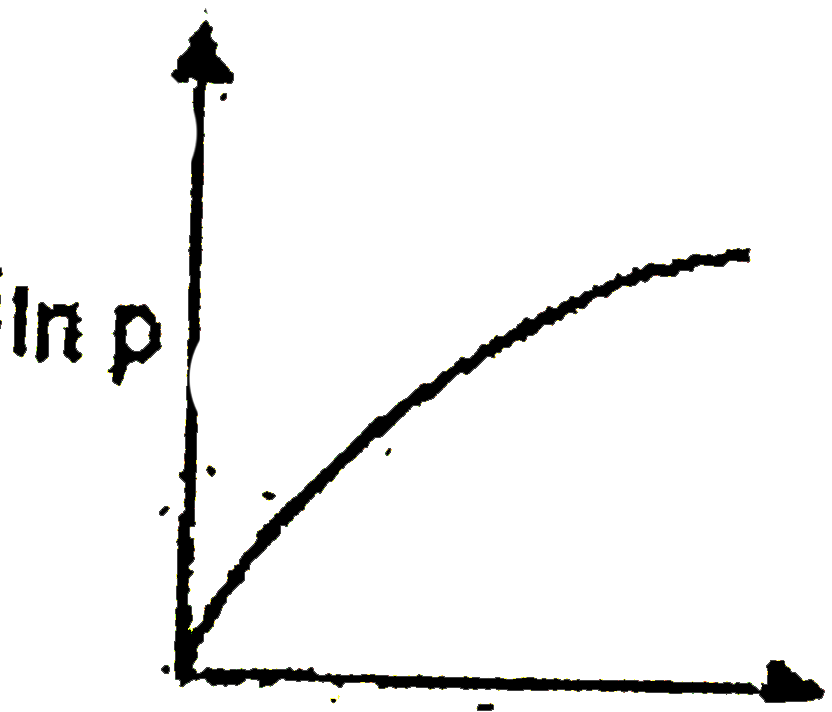 DNone
DNone
In an experiment , to find the loss of energy with respect to time in case of swinging simple pendulum , the graph between (amplitude)2 and time is
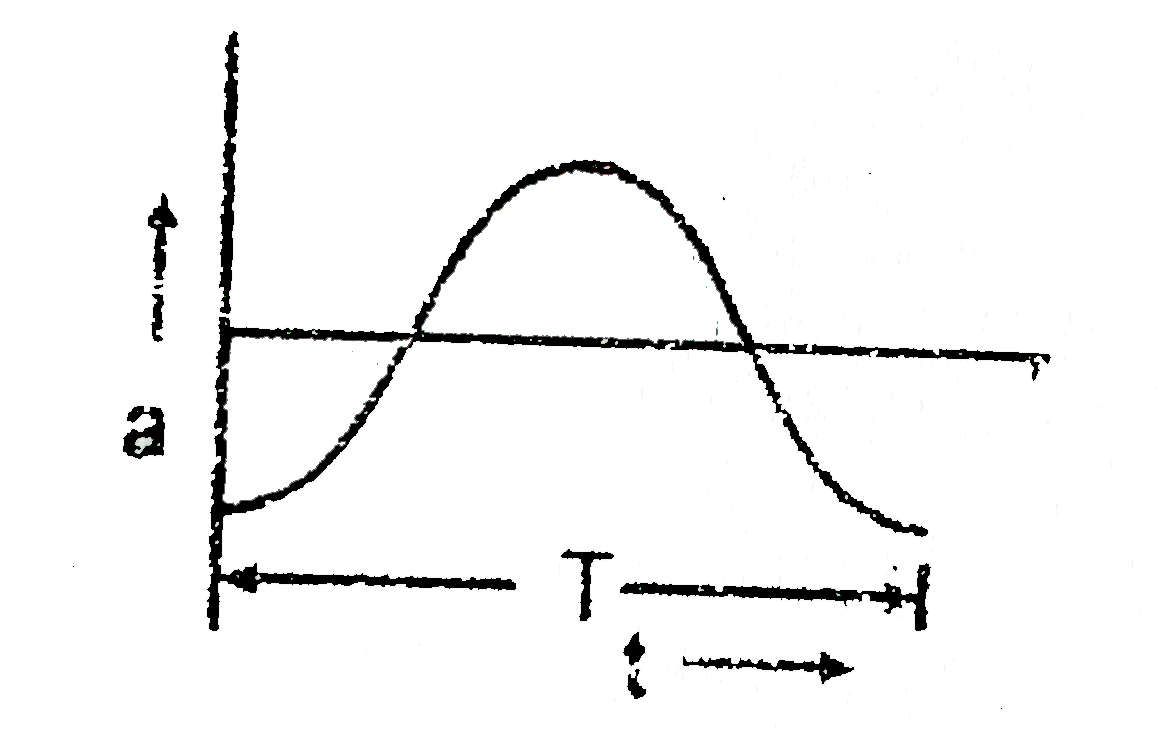
View SolutionAcceleration a versus time t graph of a body in SHM is given by a curve shown below. T is the time period Then corresponding graph between kinetic energy KE and time t is correctly represented by
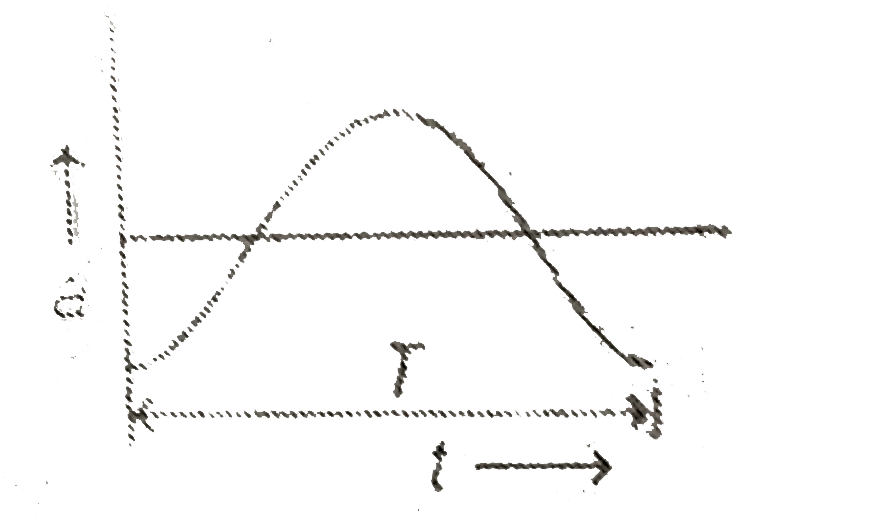
View SolutionAcceleration versus time graph of a body in SHM is given by a curve shown below. T is the time period. Then corresponding graph between kinetic energy KE and time t is correctly represented by
View SolutionIf p and E represent linear momentum and kinetic energy respectively, then the graph between E and pis correctly shown by
View SolutionThe relation between kinetic energy K and linear momentum p of a particle is represented by
View Solution
