The graph showing the variation of K.E. or P.E. with displacement of a harmonic oscillator is a parabola, but that of total energy with displacement is a straight line. Why?
Step by step video & image solution for The graph showing the variation of K.E. or P.E. with displacement of a harmonic oscillator is a parabola, but that of total energy with displacement is a straight line. Why? by Physics experts to help you in doubts & scoring excellent marks in Class 11 exams.
Updated on:21/07/2023Topper's Solved these Questions
- OSCILLATIONS BOOK - ICSECHAPTER - OSCILLATIONS EXERCISE - VERY SHORT ANSWER QUESTIONS
13 Videos
- OSCILLATIONS BOOK - ICSECHAPTER - OSCILLATIONS EXERCISE - SELECTED PROBLEMS (FROM THE CHARACTERISTIC OF SHM)
14 Videos
- OSCILLATIONS BOOK - ICSECHAPTER - OSCILLATIONS EXERCISE - LONG ANSWER QUESTIONS
3 Videos
- MOTION IN FLUIDS BOOK - ICSECHAPTER - MOTION IN FLUIDS EXERCISE - SELECTED PROBLEMS (FROM POISEUILLE.S FORMULA)
19 Videos
- PROPERTIES OF MATTERBOOK - ICSECHAPTER - PROPERTIES OF MATTEREXERCISE - MODULE 4 ( TEMPERATURE ) UNSOLVED PROBLEMS
12 Videos
Similar Questions
The displacement of a harmonic oscillator is half of its amplitude. What fraction of the total energy is kinetic and what fraction is potential ?
View SolutionDraw a graph to show the variation of PE, KE and total energy of a simple harmonic oscillator with displacement.
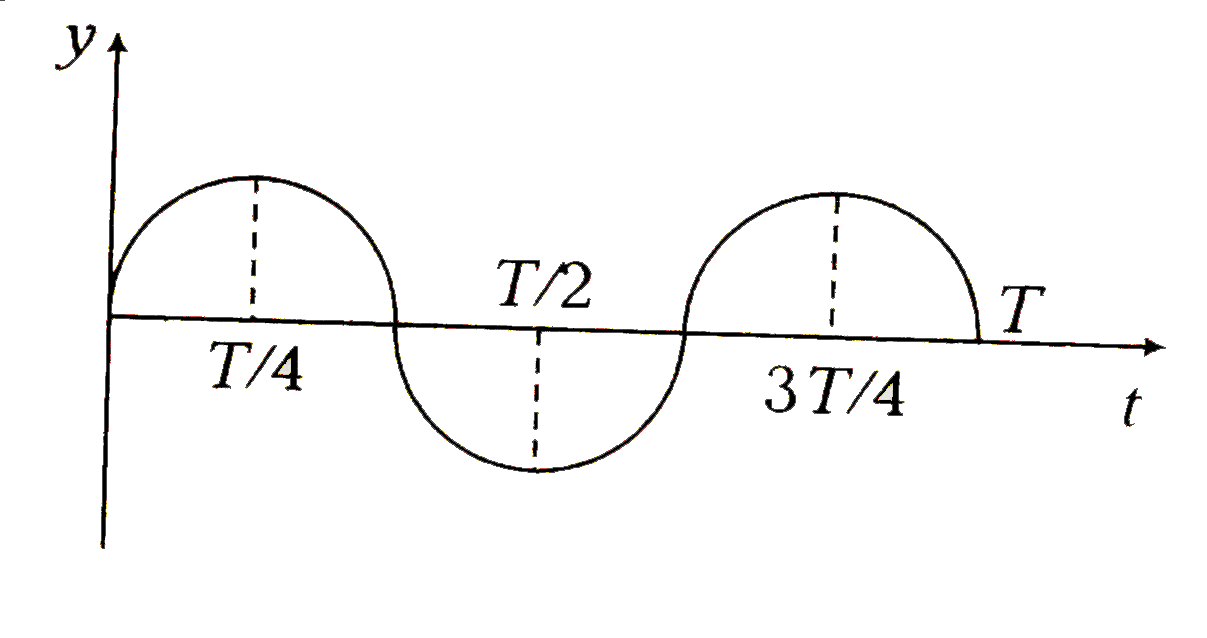
View SolutionThe graph shows the variation of displacement of a particle execting SHM with time . We infer from this graph that

View SolutionFind the displacement of a simple harmonic oscillator at which its PE is half of the maximum energy of the oscillator.
View SolutionIf angular frequency of simple harmonic oscillator is 2 rad/s, then the graph between velocity and displacement is
View SolutionThe graph shows the variation of displacement of a particle executing S.H.M with time. We inference form this graph that :-
_E01_037_Q01.png)
View SolutionDraw graph showing the variation of displacement with time of a body executing (i) free oscillation (ii) damped oscillations.
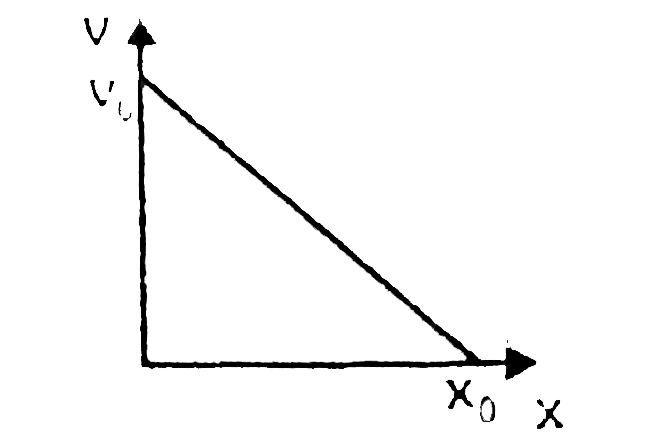
View SolutionThe given graph shows the variation of velocity with displacement. Which one of the graph given below correctly represents the variation of acceleration with displacement :-

View SolutionThe given graph shows the variation of velocity with displacement. Which one of the graphs given below correctly represents the variation of acceleration with displacement ?

View SolutionIf the total energy of a simple harmonic oscillator is E, then its potential energy, when it is halfway to its endpoint will be
View Solution
