Draw the displacement-time, velocity-time and acceleration-time graph of a body executing shm.
To draw the displacement-time, velocity-time, and acceleration-time graphs of a body executing Simple Harmonic Motion (SHM), we will follow these steps:
Step 1: Understand the equations of SHM
The displacement x of a body in SHM is given by the equation:
x(t)=Asin(ωt)
where A is the amplitude and ω is the angular frequency.
Step 2: Derive the velocity equation
The velocity v can be found by differentiating the displacement with respect to time:
v(t)=dxdt=Aωcos(ωt)
Step 3: Derive the acceleration equation
The acceleration a can be found by differentiating the velocity with respect to time:
a(t)=dvdt=−Aω2sin(ωt)
Step 4: Draw the displacement-time graph
1. The displacement graph x(t)=Asin(ωt) is a sine wave.
2. The maximum displacement is A and the minimum is −A.
3. The period of the wave is T=2πω.
Step 5: Draw the velocity-time graph
1. The velocity graph v(t)=Aωcos(ωt) is a cosine wave.
2. The maximum velocity is Aω and the minimum is −Aω.
3. The velocity graph lags the displacement graph by 90∘ (or π2 radians).
Step 6: Draw the acceleration-time graph
1. The acceleration graph a(t)=−Aω2sin(ωt) is a sine wave but inverted.
2. The maximum acceleration is −Aω2 and the minimum is Aω2.
3. The acceleration graph is 180∘ out of phase with the displacement graph.
Final Graphs
- Displacement-Time Graph: A sine wave oscillating between A and −A.
- Velocity-Time Graph: A cosine wave oscillating between Aω and −Aω, shifted left by 90∘.
- Acceleration-Time Graph: An inverted sine wave oscillating between −Aω2 and Aω2, shifted left by 180∘.
The displacement x of a body in SHM is given by the equation:
x(t)=Asin(ωt)
where A is the amplitude and ω is the angular frequency.
The velocity v can be found by differentiating the displacement with respect to time:
v(t)=dxdt=Aωcos(ωt)
The acceleration a can be found by differentiating the velocity with respect to time:
a(t)=dvdt=−Aω2sin(ωt)
1. The displacement graph x(t)=Asin(ωt) is a sine wave.
2. The maximum displacement is A and the minimum is −A.
3. The period of the wave is T=2πω.
1. The velocity graph v(t)=Aωcos(ωt) is a cosine wave.
2. The maximum velocity is Aω and the minimum is −Aω.
3. The velocity graph lags the displacement graph by 90∘ (or π2 radians).
1. The acceleration graph a(t)=−Aω2sin(ωt) is a sine wave but inverted.
2. The maximum acceleration is −Aω2 and the minimum is Aω2.
3. The acceleration graph is 180∘ out of phase with the displacement graph.
- Displacement-Time Graph: A sine wave oscillating between A and −A.
- Velocity-Time Graph: A cosine wave oscillating between Aω and −Aω, shifted left by 90∘.
- Acceleration-Time Graph: An inverted sine wave oscillating between −Aω2 and Aω2, shifted left by 180∘.
Topper's Solved these Questions
- OSCILLATIONS BOOK - ICSECHAPTER - OSCILLATIONS EXERCISE - VERY SHORT ANSWER QUESTIONS
13 Videos
- OSCILLATIONS BOOK - ICSECHAPTER - OSCILLATIONS EXERCISE - SELECTED PROBLEMS (FROM THE CHARACTERISTIC OF SHM)
14 Videos
- OSCILLATIONS BOOK - ICSECHAPTER - OSCILLATIONS EXERCISE - LONG ANSWER QUESTIONS
3 Videos
- MOTION IN FLUIDS BOOK - ICSECHAPTER - MOTION IN FLUIDS EXERCISE - SELECTED PROBLEMS (FROM POISEUILLE.S FORMULA)
19 Videos
- PROPERTIES OF MATTERBOOK - ICSECHAPTER - PROPERTIES OF MATTEREXERCISE - MODULE 4 ( TEMPERATURE ) UNSOLVED PROBLEMS
12 Videos
Similar Questions
Knowledge Check
If x, v and a denote the displacement, the velocity and the acceleration of a particle executing simple harmonic motion of time period T, then, which of the following does not change with time?
AaTvBaT+2πvCaTxDa2T+4π2v2
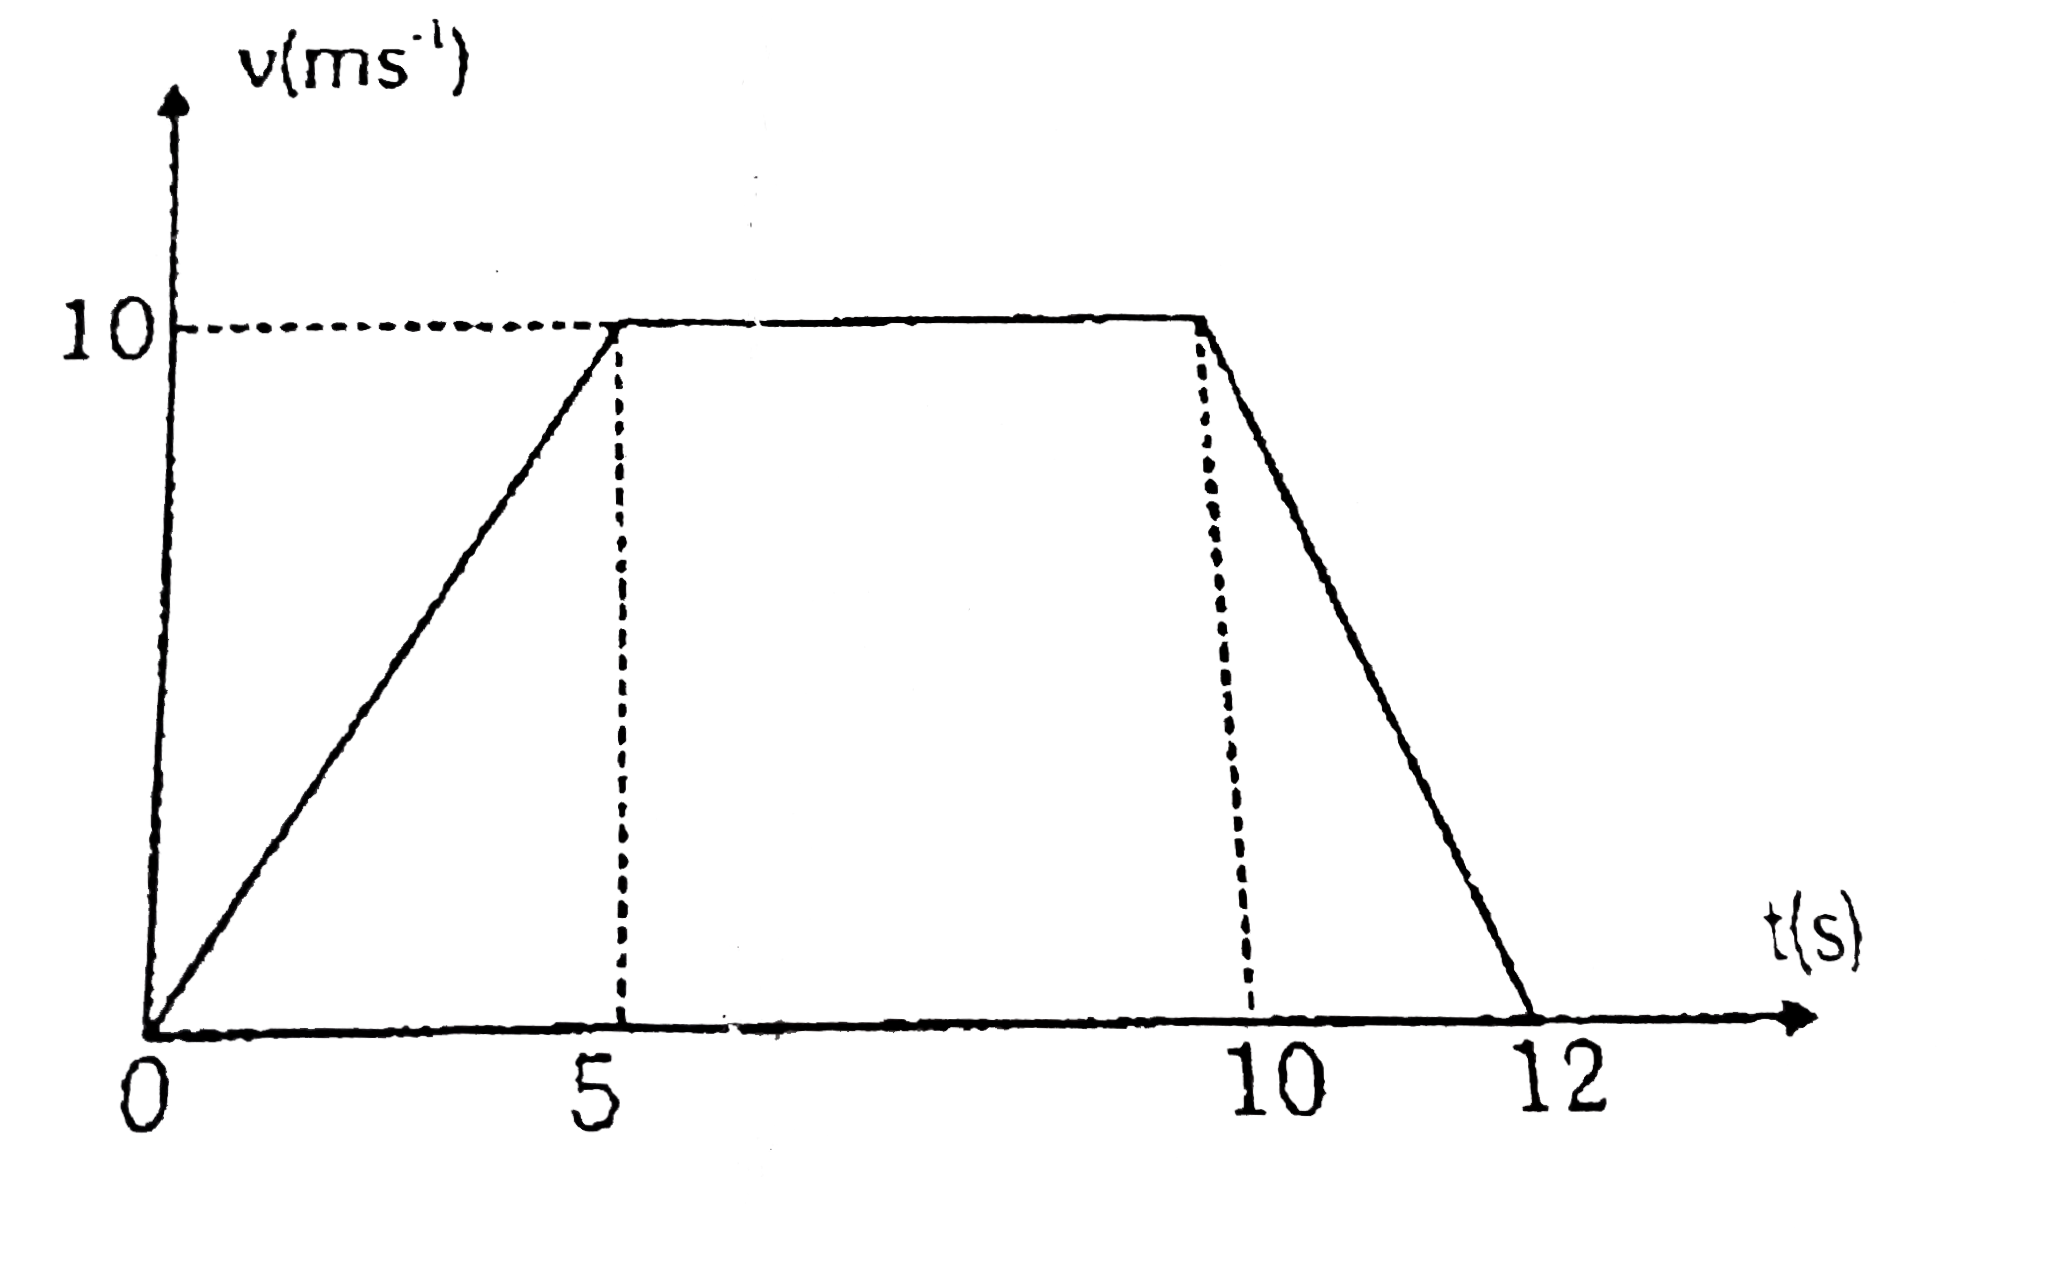
Draw displacement time and acceleration -time graph for the given velocity-time graph

View SolutionObtain the formulae for displacement, velocity, acceleration and time period of a particle executing simple harmonic motion. When is the velocity of particle maximum and when zero ? Acceleration ?
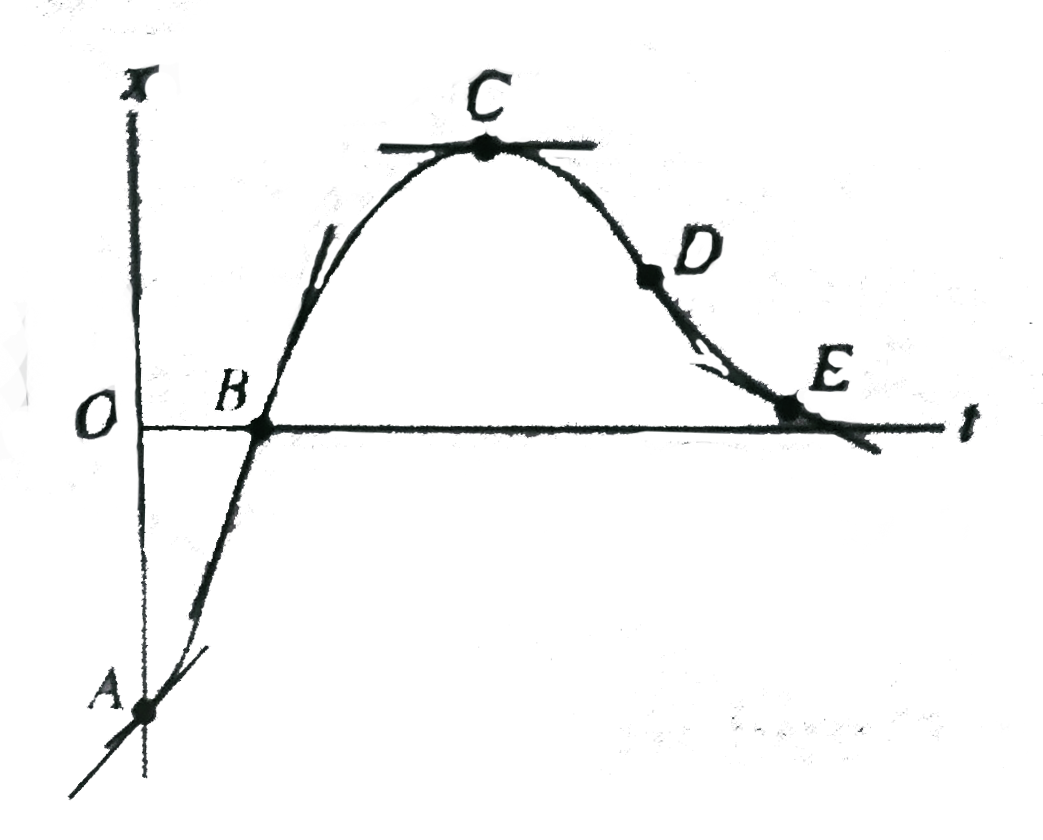
View SolutionConsiedr the following x−t garaph to be parabolic. Draw the velocity-time graph and acceleration-time graph analyze the motion of the particle regarding its velocity and acceleration.
 .
.
View SolutionDraw a graph between displacement from mean position and time for a body executing free vibration in a vacuum.
View SolutionThe velocity time graph of a body is shown in fig. it indicates that :

View SolutionThe displacement-time graph of a body is shown in.
 .
.
The velocity-time graph of the motion of the body will be .
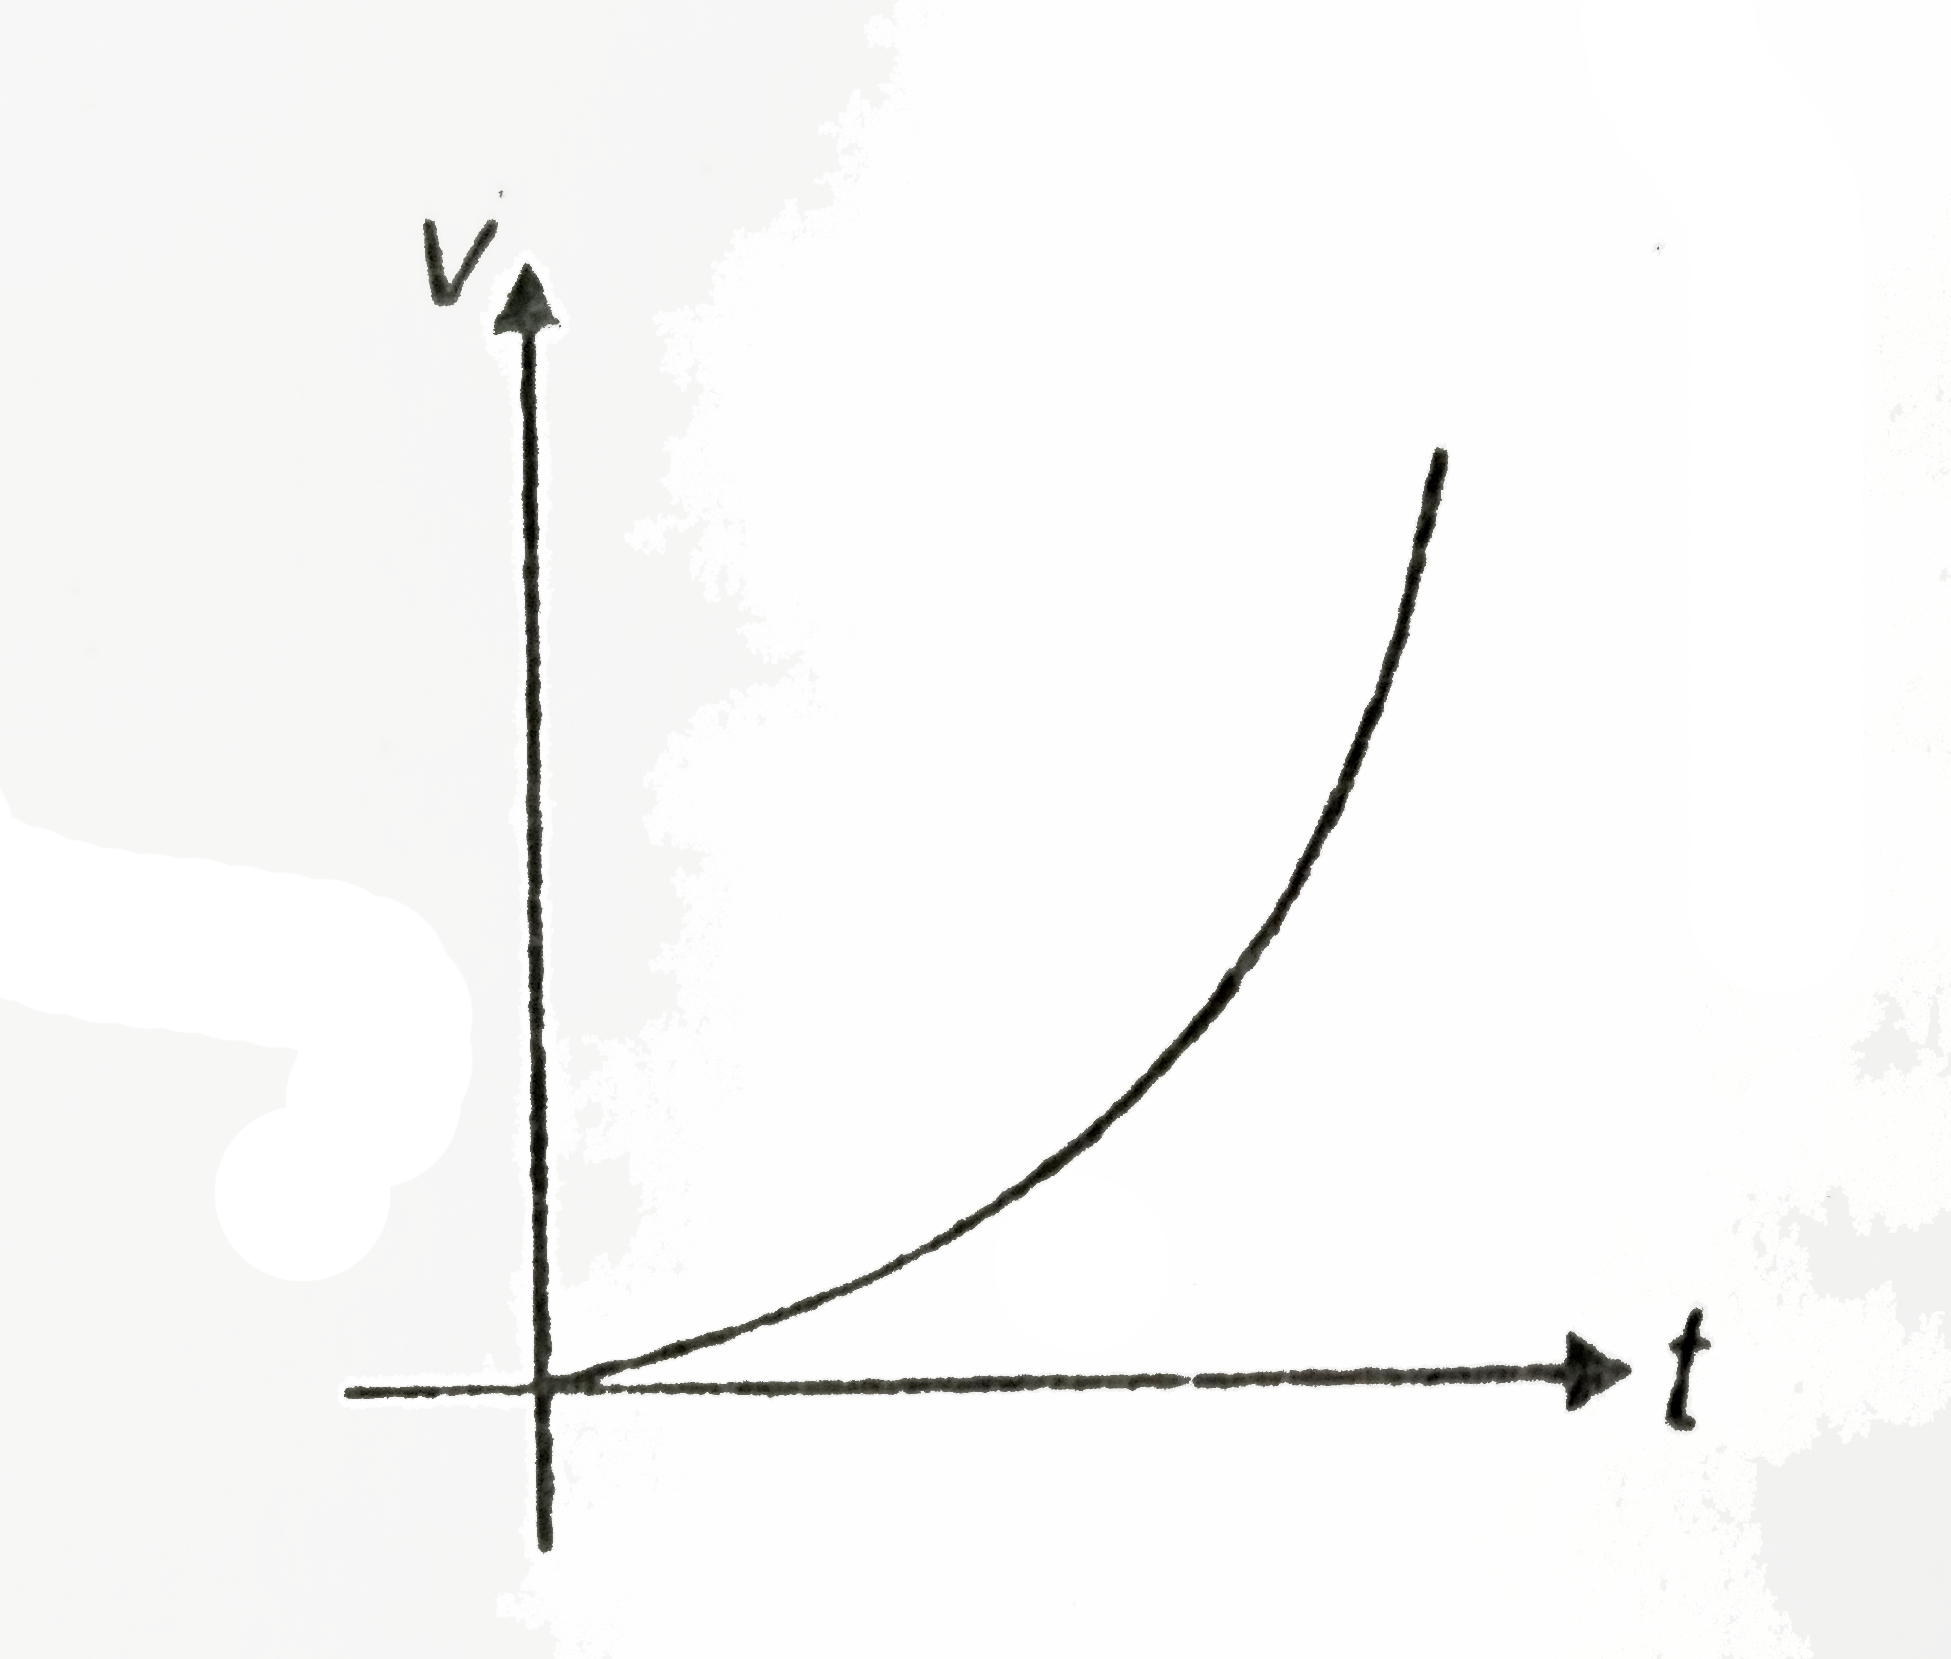
View SolutionGraphs are very useful to represent a physical situation. Various quantities can be easily represented on graphs and other quantites can be determined from the graph. For example the slope of velocity-time graph represents instantaneous acceleration. For a motion with constant acceleration slope of velocity-time graph is constant. If acceleration is changing with time, slope will change and thus velocity-time graph will be a non-linear curve. Further the area of velocity-time graph gives displacement.
For the given velocity-time graph the possibly correct acceleration-time relationship is

View Solution
