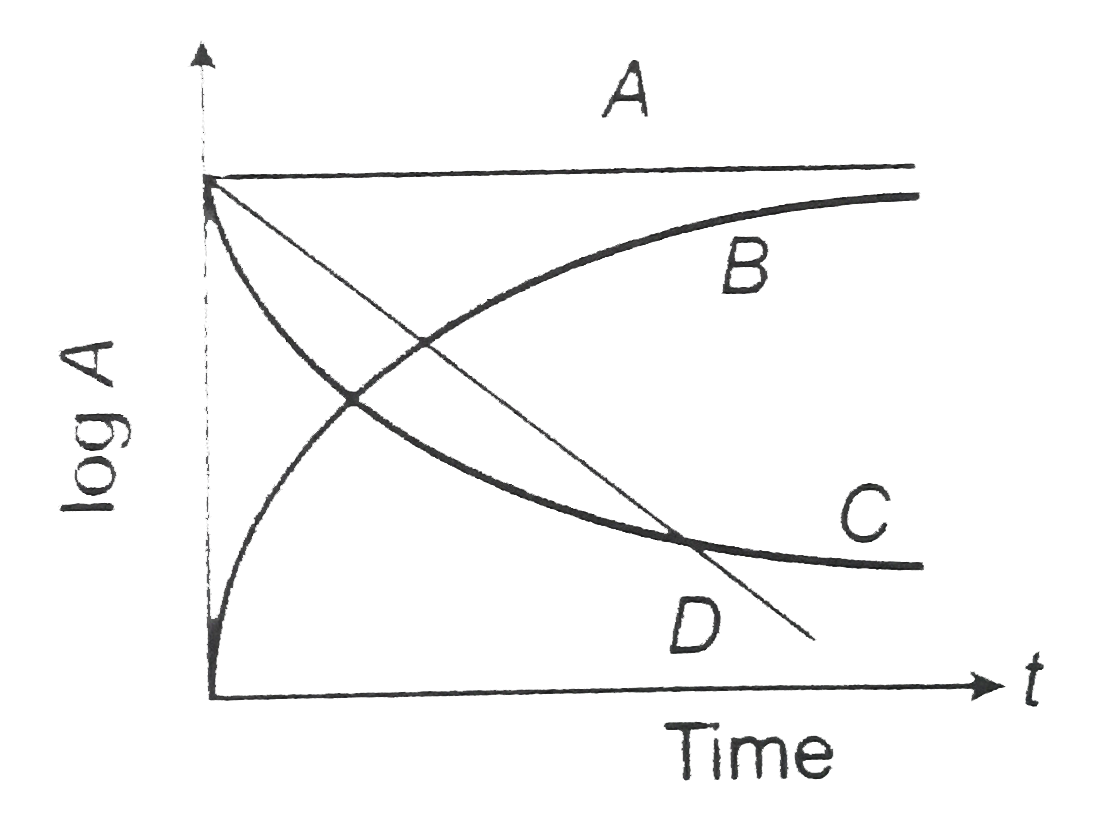
The graph which represents the correct variation of logarithm of activity (log A) versus time, in figure is.
 .
.
A
B
C
D
The correct Answer is:D
Step by step video, text & image solution for The graph which represents the correct variation of logarithm of activity (log A) versus time, in figure is. . by Physics experts to help you in doubts & scoring excellent marks in Class 12 exams.
Updated on:21/07/2023Topper's Solved these Questions
- ATOMIC AND NUCLEAR PHYSICSBOOK - ERRORLESS CHAPTER - ATOMIC AND NUCLEAR PHYSICSEXERCISE - Ordinary
15 Videos
- ATOMIC AND NUCLEAR PHYSICSBOOK - ERRORLESS CHAPTER - ATOMIC AND NUCLEAR PHYSICSEXERCISE - Nuckeus, Nuclear Reaction
2 Videos
- ALTERNATING CURRENTBOOK - ERRORLESS CHAPTER - ALTERNATING CURRENTEXERCISE - SET
15 Videos
- COMMUNICATION SYSTEMBOOK - ERRORLESS CHAPTER - COMMUNICATION SYSTEMEXERCISE - S E T
14 Videos
Similar Questions
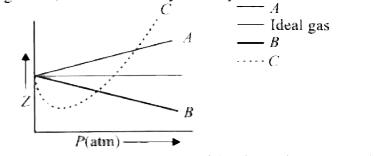
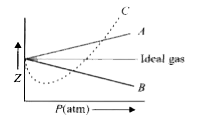
The given graph represents the variation of Z (compressibility factor =PVnRT) versus P, for three real gases A,B and C. Identify the only incorrect statement.
View SolutionThe given graph represents the variation of Z (compressibility factor =PVnRT) versus P, for three real gases A, B and C. Identify the only incorrect statement.
View Solution
Knowledge Check
At time t=0, some radioactive gas is injected into a sealed vessel. At time T, some more of the same gas is injected into the same vessel. Which one of the following graphs best represents the variation of the logarithm of the activity A of the gas with time t?
A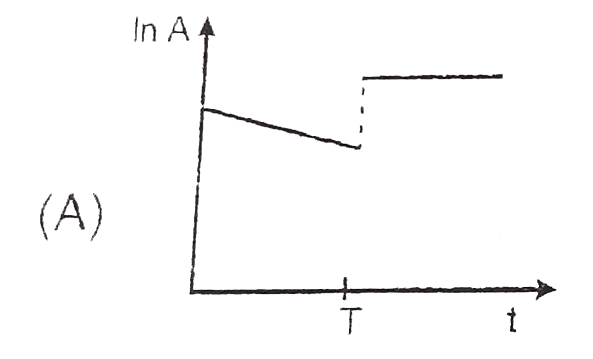 B
B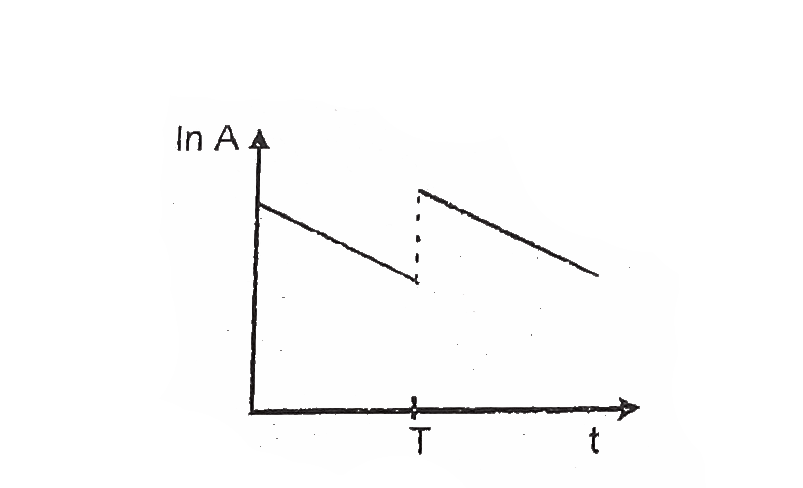 C
C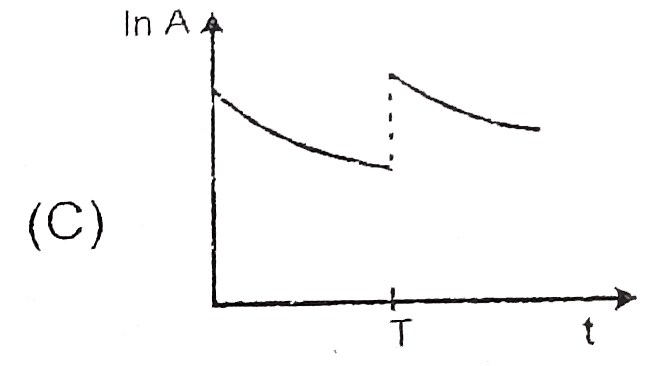 D
D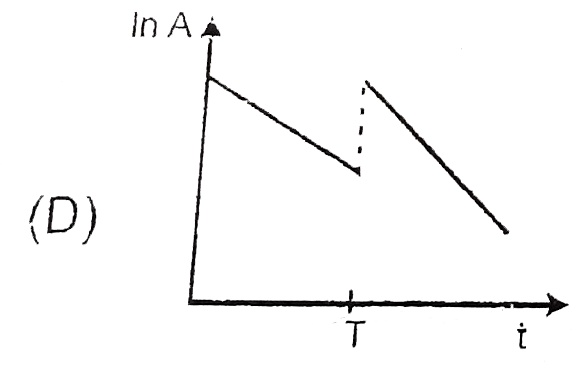
Which of the following graphs represents the variation of activity (A) of a radioactive substance with time (t).
A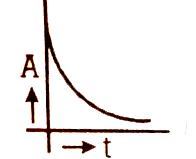 B
B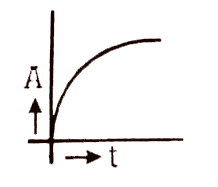 C
C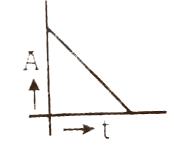 D
D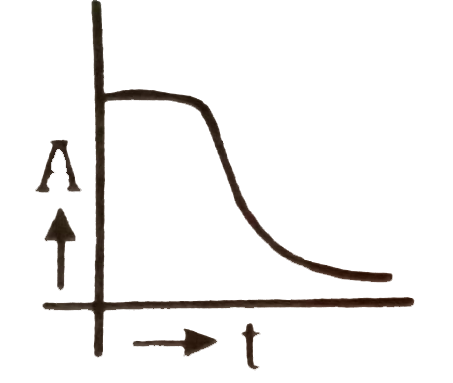
The graph which represents the variation of mean kinetic energy of moleules with temperature ∘C is ?
A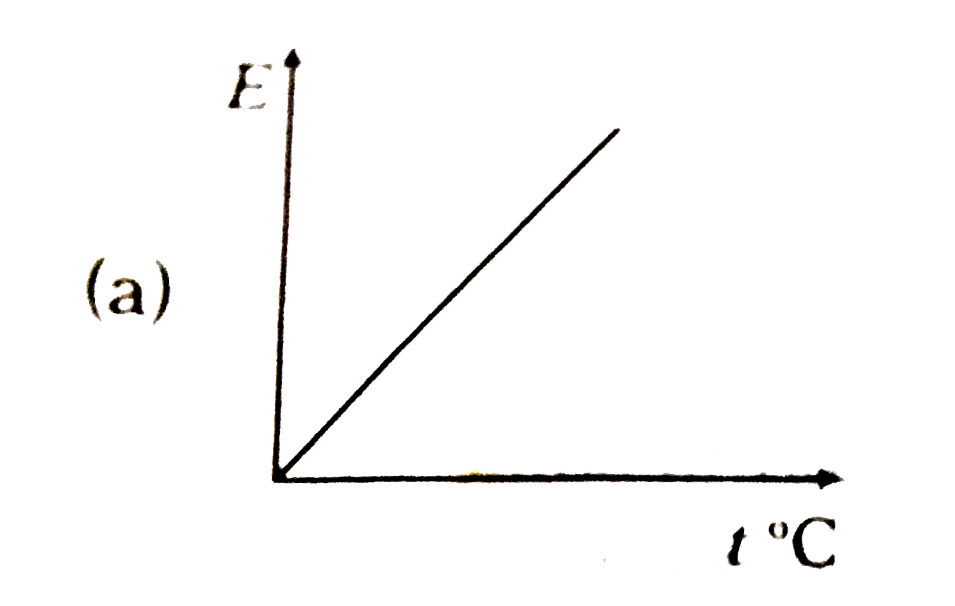 B
B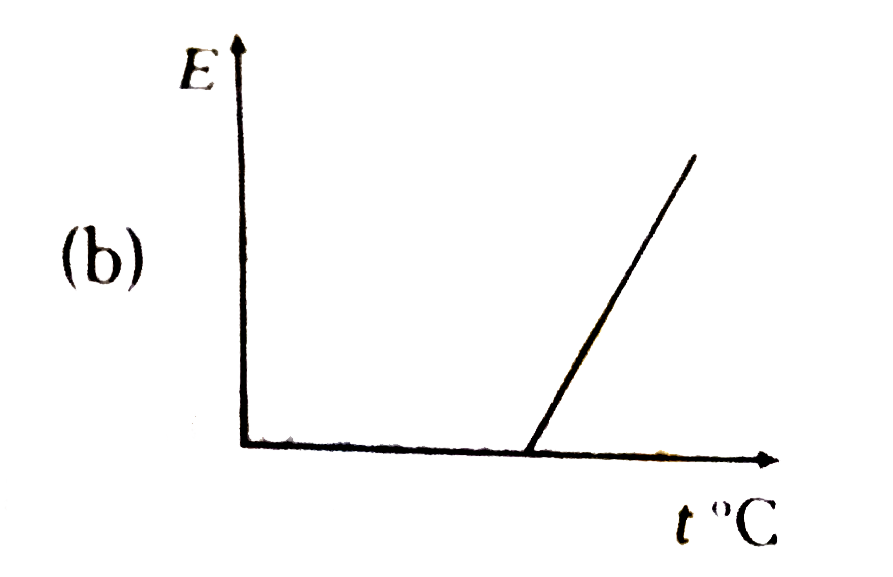 C
C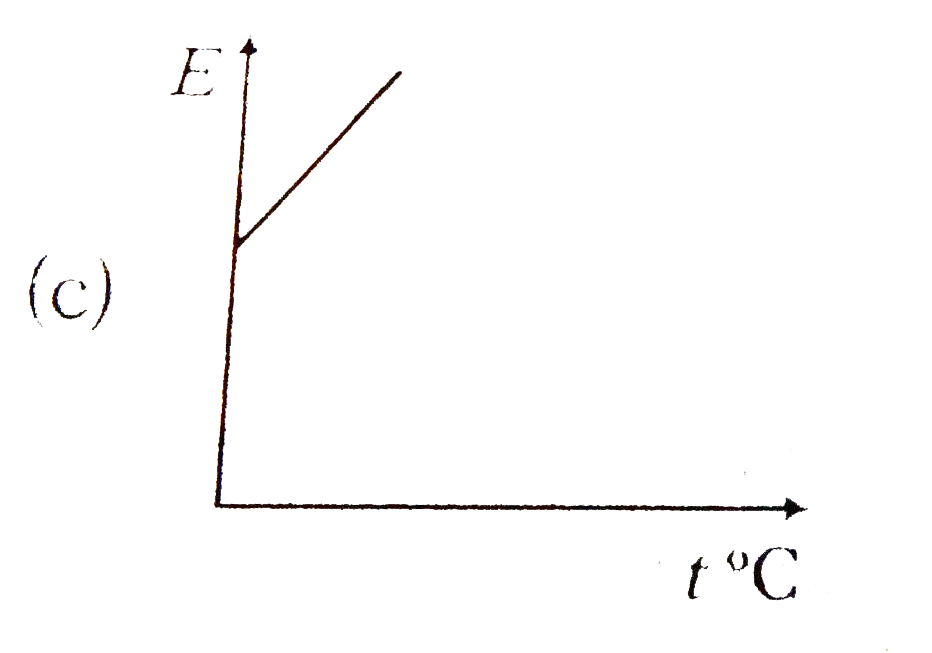 D
D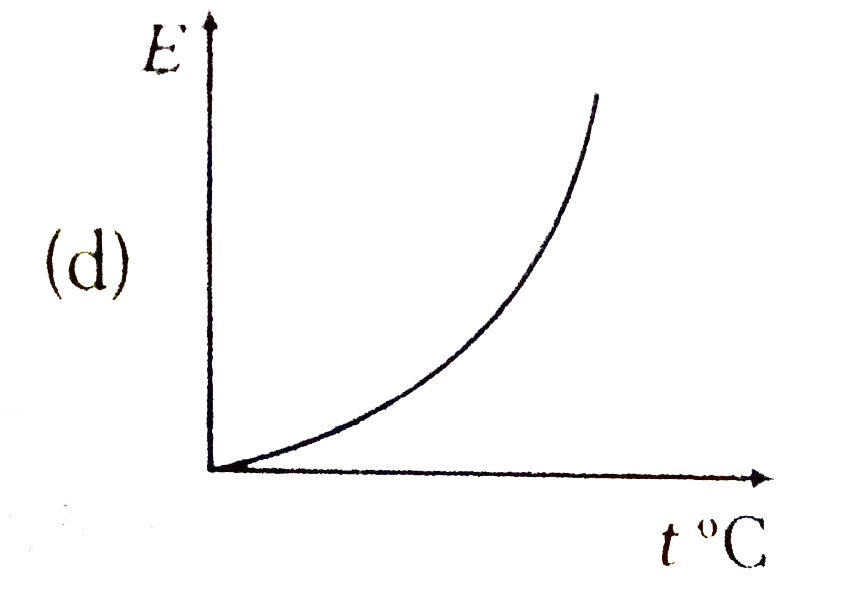
Which graph best represents the variation of radius r of a circular orbit of a satellite against its time priod T ?
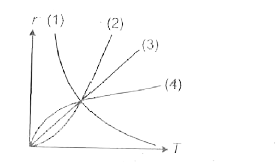
View SolutionTen moles of an ideal gas are filled in a closed vessel. The vessel has cylinder and piston type arrangement and pressure of the gas remains constant at 0.821 atm. Which of the following graph represents correct variation of log V vs log T?
(V = Volume in litre and T = temperature in Kelvin)
View SolutionVariation of velocity v versus time t is ( Given x= Asinomegat)
View SolutionWhich of the following graphs represent the correct variation of inductive reactance XL with frequency υ?
View Solutionwhich of the following graph represents the variation of resistivity (ρ) with temperature (T) for copper?
View Solution
