The graphs show the variation of current I (y-axis) in two photocell A and B as a function of the applied voltage V(x-axis) when light is incident on the cell. Which of the following is the correct conclusion drawn from the data?

Cathodes of the two cells are made from the same substance, the intensity of light used are different
Cathodes are made from different substances and the intensity of light is the same.
Cathode substances as well as intensity of light are different.
No conclusion can be drawn.
The correct Answer is:A
The stopping potential depends on the substance of the cathode. Since it is same for A and B, the cathodes are made of the same substace. Since the current of A is greater than the current of B , the lights used are of different intensities . Light of A is more intense.
Topper's Solved these Questions
- DUAL NATURE OF MATTER AND RADIATION BOOK - MTG GUIDECHAPTER - DUAL NATURE OF MATTER AND RADIATION EXERCISE - NEET Cafe Topicwise Practice Questions (PARTICLE NATURE OF LIGHT (THE PHOTON)
17 Videos
- DUAL NATURE OF MATTER AND RADIATION BOOK - MTG GUIDECHAPTER - DUAL NATURE OF MATTER AND RADIATION EXERCISE - NEET Cafe Topicwise Practice Questions (MATTER WAVES AND DE BROGLIE RELATION)
39 Videos
- DUAL NATURE OF MATTER AND RADIATION BOOK - MTG GUIDECHAPTER - DUAL NATURE OF MATTER AND RADIATION EXERCISE - AIPMT/ NEET MCQs
30 Videos
- CURRENT ELECTRICITY BOOK - MTG GUIDECHAPTER - CURRENT ELECTRICITY EXERCISE - MCQs AIPMT / NEET
32 Videos
- ELECTROMAGNETIC INDUCTION AND ALTERNATING CURRENTSBOOK - MTG GUIDECHAPTER - ELECTROMAGNETIC INDUCTION AND ALTERNATING CURRENTSEXERCISE - AIPMT/NEET MCQS
31 Videos
Similar Questions
The graph shows the variation of photocurrent with the applied voltage in a photoelectric effect experiment for three different beams of light falling on identical metal surfaces, then which among the following is correct ?
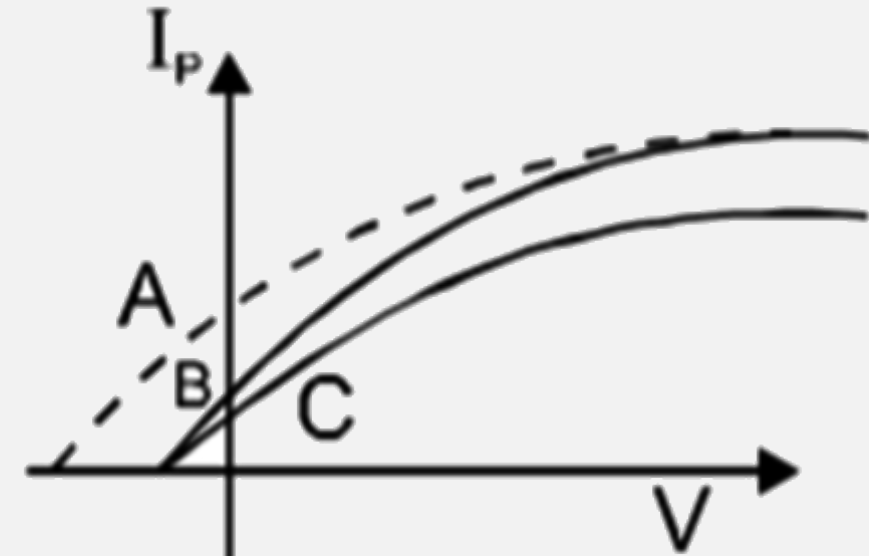
View SolutionThe graph shows the variation of photocurrent with the applied voltage in a photoelectric effect experiment for three different beams of light falling on identical metal surfaces, then which among the following is correct ?

View Solution
Knowledge Check
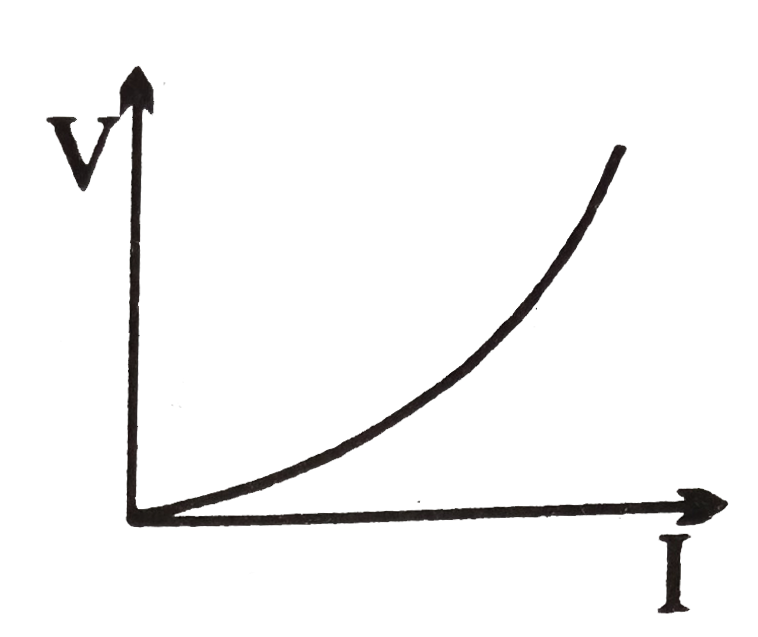
The variation of current (I) and voltage (V) is as shown in figure A. The variation of power P with current I is best shown by which of the following graph
 A
A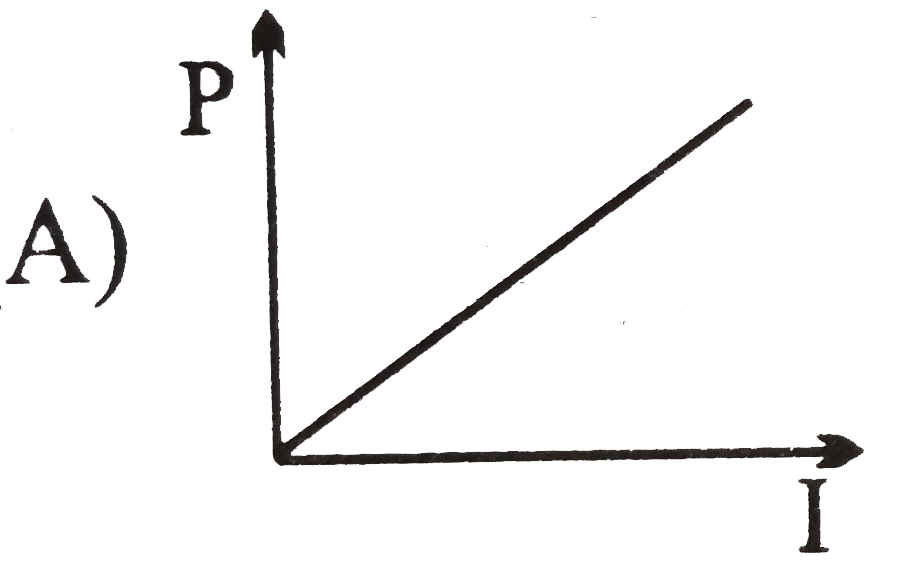 B
B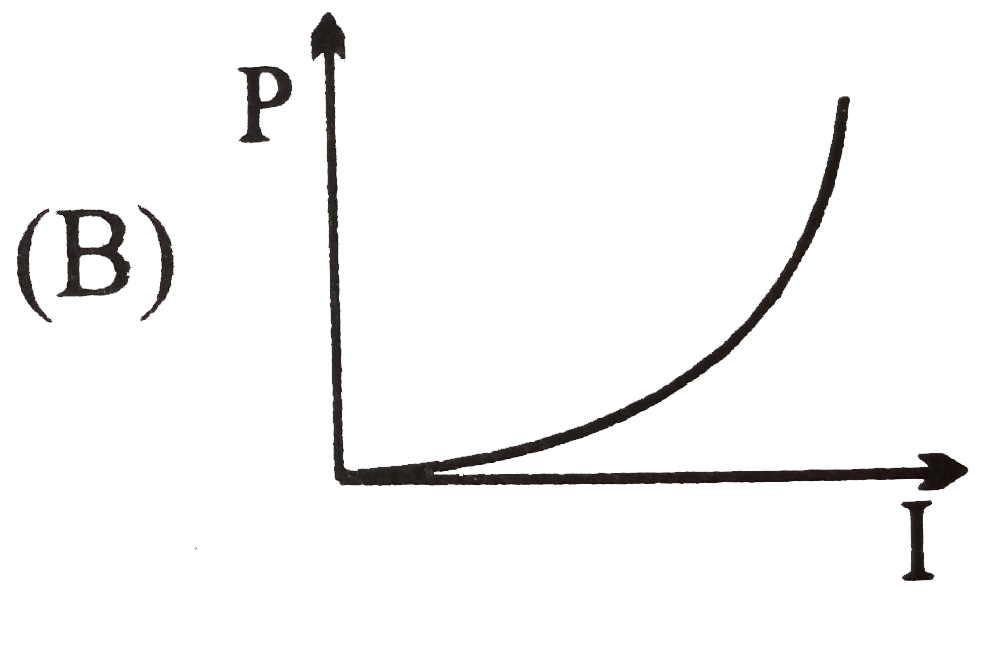 C
C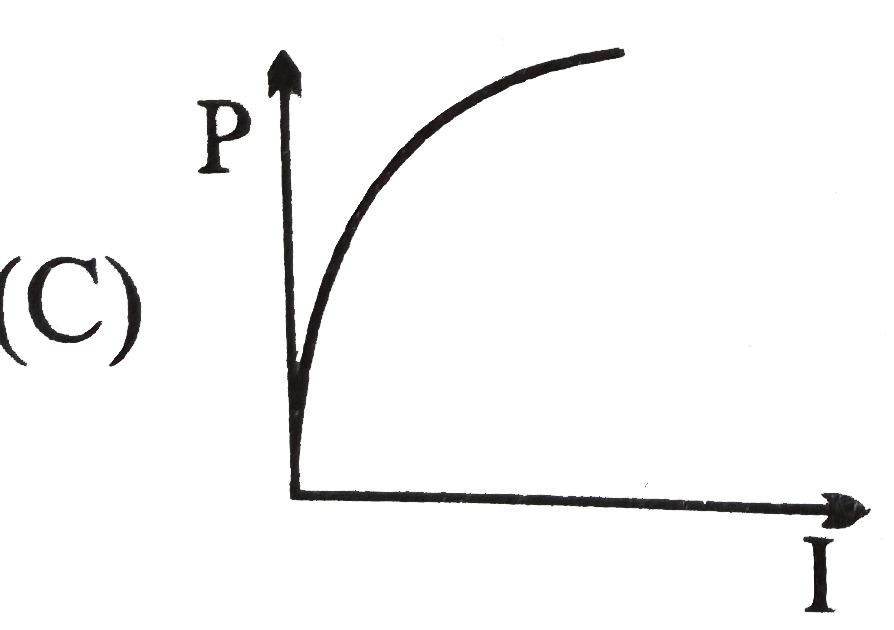 D
D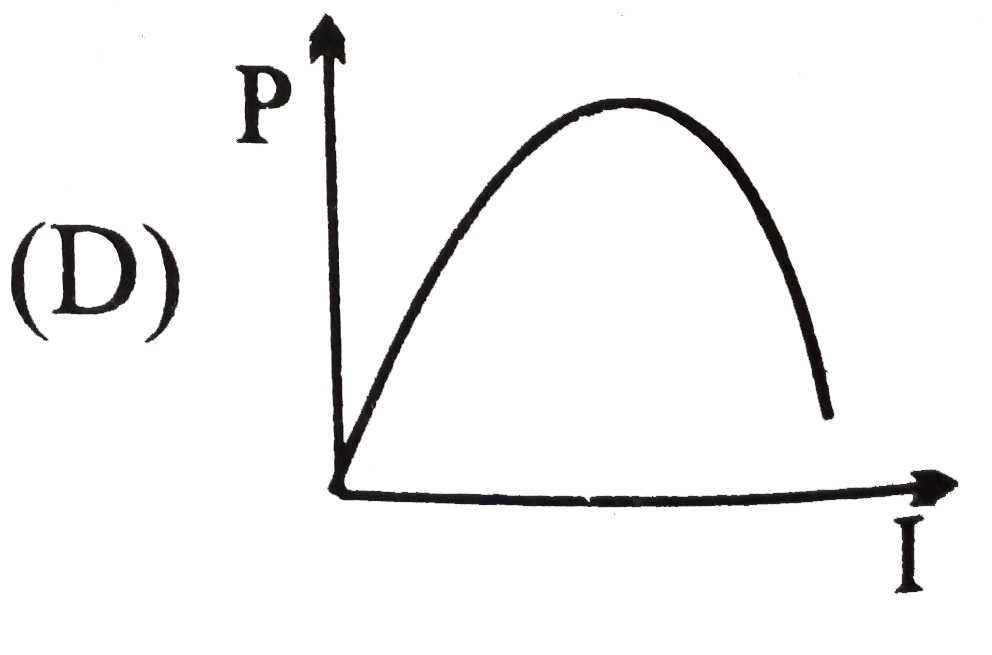
The slope of the graph showing the variation of potential difference V on X-axis and current Y-axis gives conductor
AresistanceBresistivityCreciprocal of resistanceDconductivityThe figure below shows a circuit and its input voltage vi as function of time t.
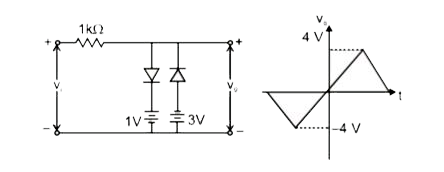
Assuming the diodes to be ideal, which of the following graphs depicts the output voltage v0 as function of time t ?A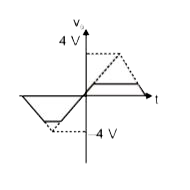 B
B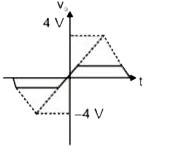 C
C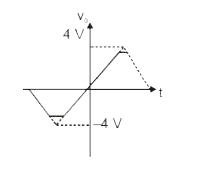 D
D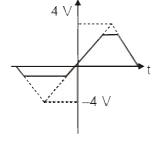
The variation of current (I) and voltage (V) is as shown in figure A. The variation of power P with current I is best shown by which of the following graph

View SolutionFigure shows the velocity of a particle moving on x-axis.
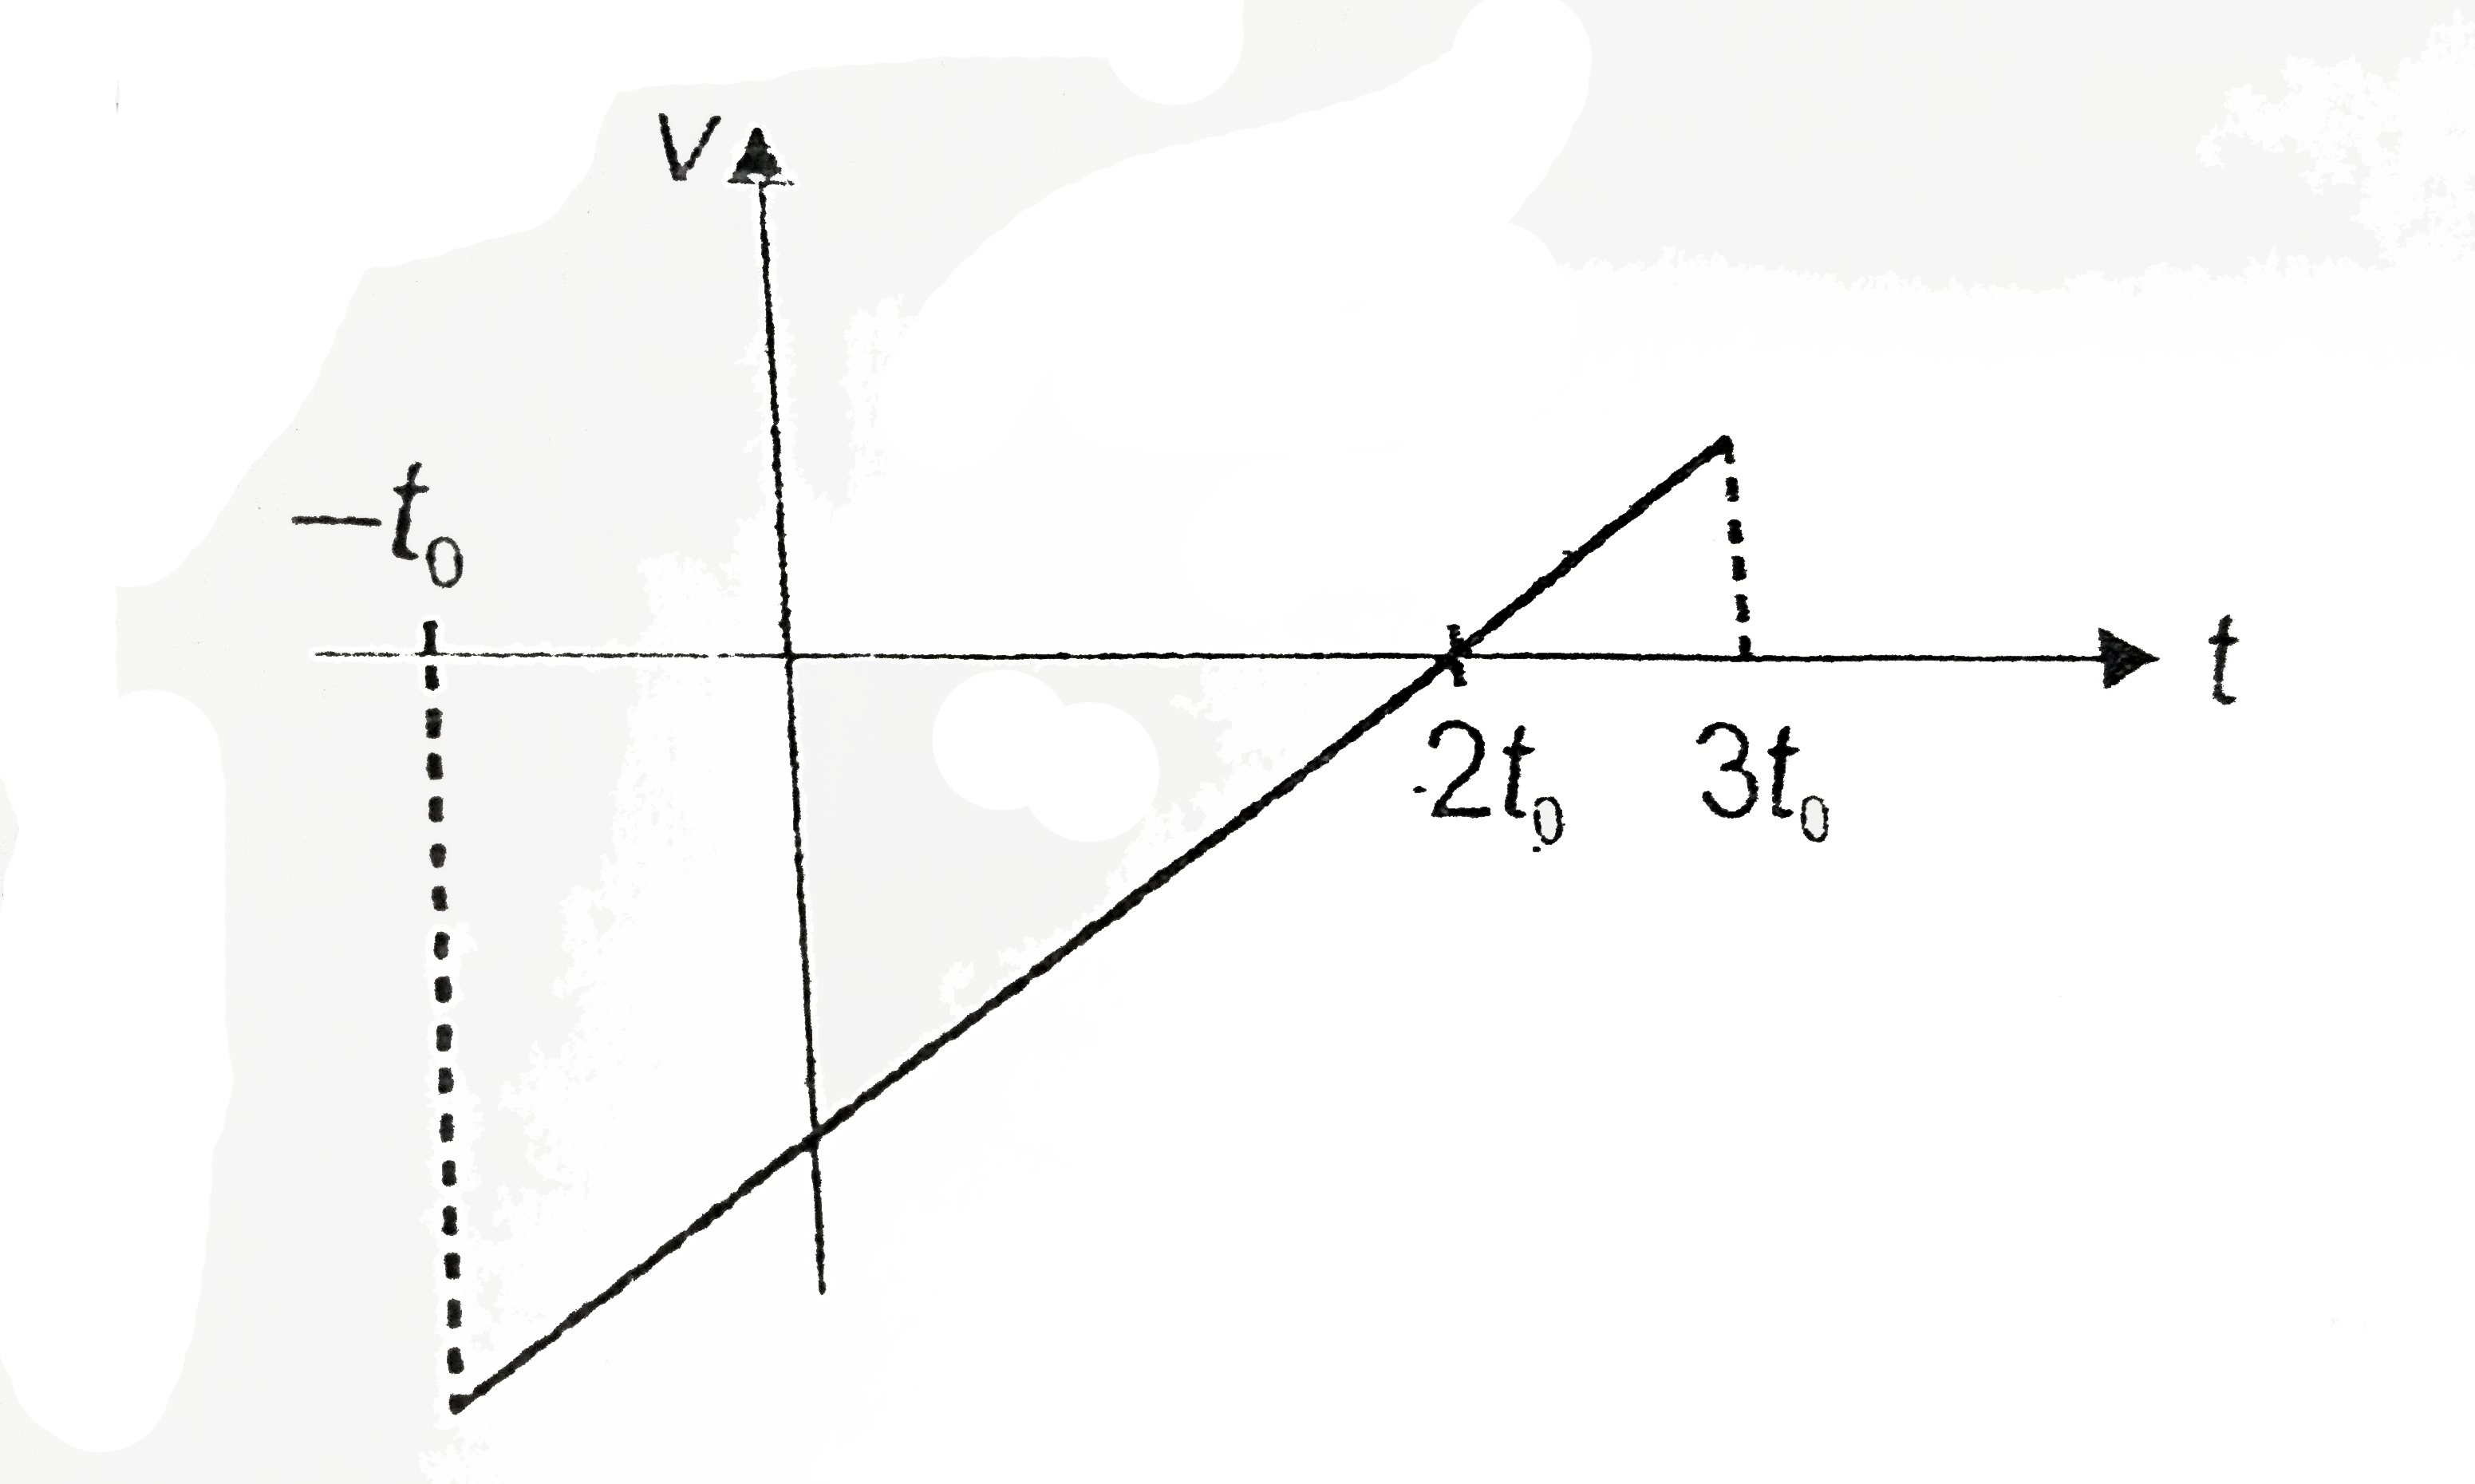
Which of the following statement is correct for the interval shown in graph?
View SolutionFigure shows the velocity of a particle moving on x-axis.

Which of the following statement is correct for the interval shown in graph?
View SolutionThe slope of the graph showing the variation of potential difference V on X-axis and current Y-axis gives conductor
View SolutionFor a photoelectric cell the graph showing the variation of cut of voltage (V0) with frequency (v) of incident light is best represented by

View Solution
