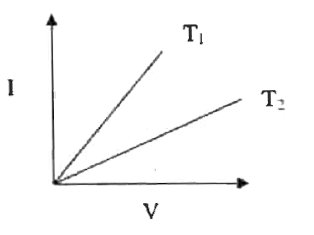
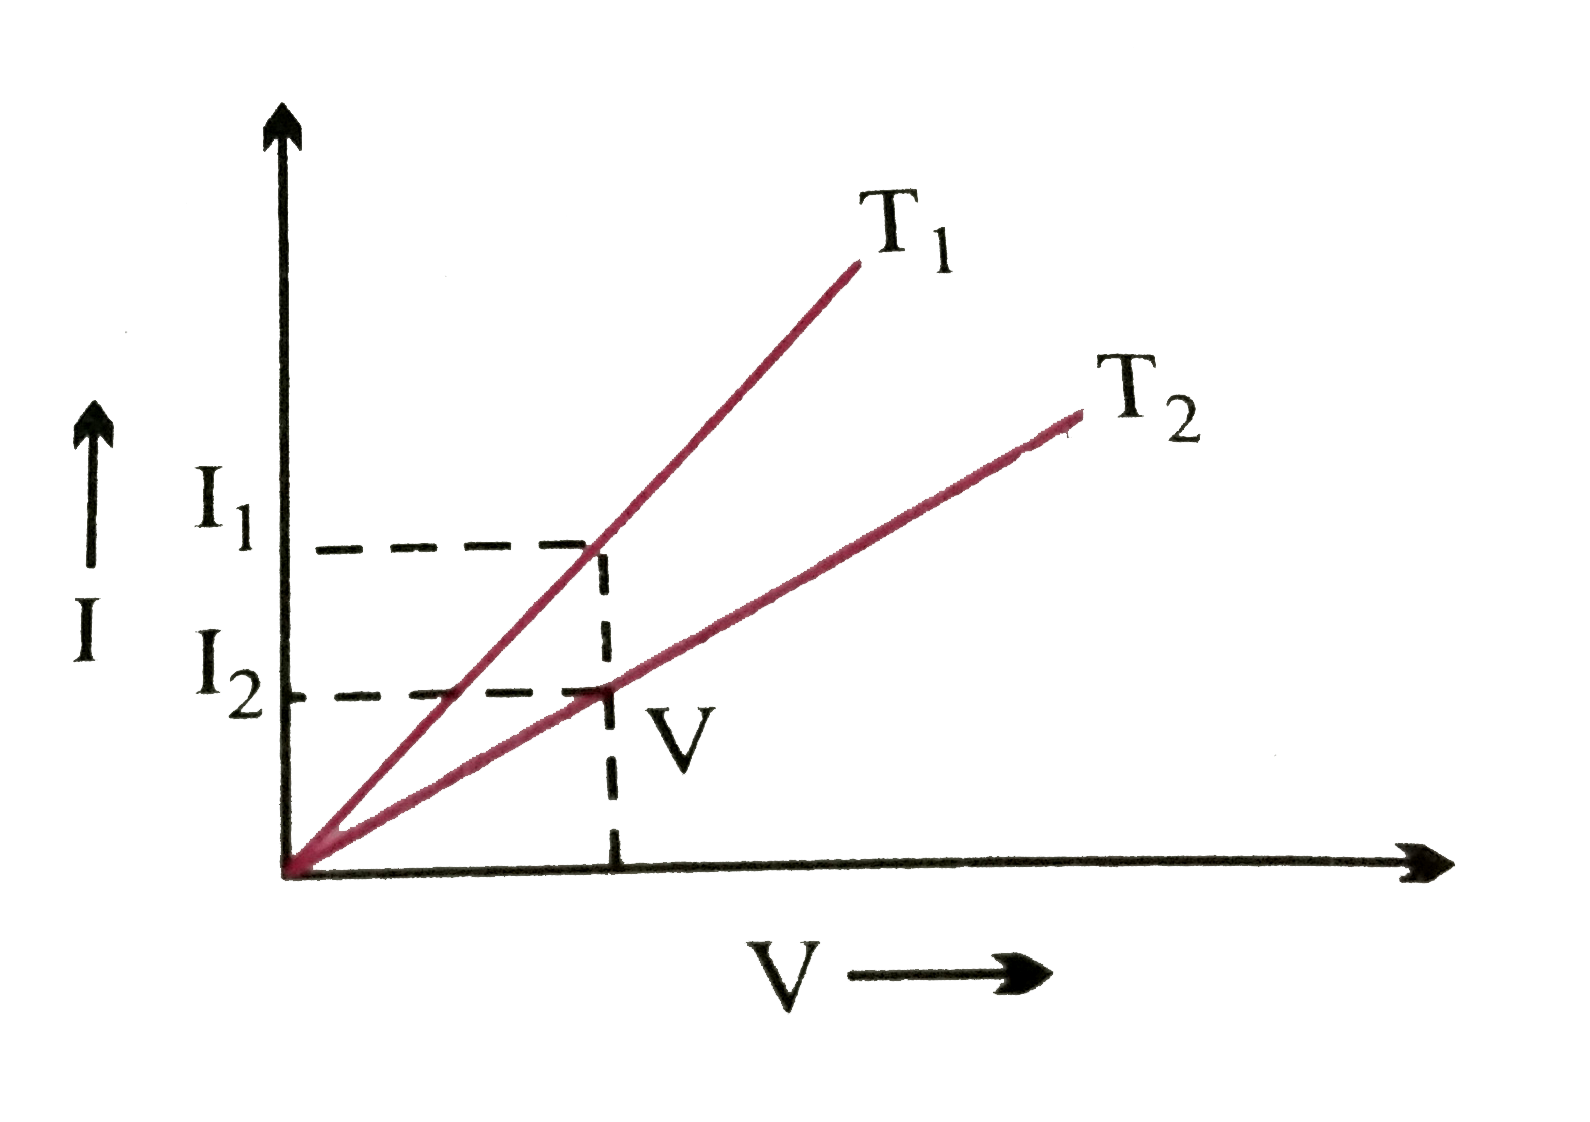
The I-V characteristics of a metal wire at two different temperatures ( T1 and T2 ) are given in the adjoining figure. Here, we can conclude that
 Solution in Bengali
T1>T2
T1<T2
T1=T2
T1=2T2
Step by step video & image solution for The I-V characteristics of a metal wire at two different temperatures ( T_(1) and T_(2) ) are given in the adjoining figure. Here, we can conclude that by Physics experts to help you in doubts & scoring excellent marks in Class 12 exams.
Updated on:21/07/2023Topper's Solved these Questions
- QUESTION PAPER 2012BOOK - WB JEE PREVIOUS YEAR PAPERCHAPTER - QUESTION PAPER 2012EXERCISE - Subject: Physics
38 Videos
- QUESTION PAPER 2011BOOK - WB JEE PREVIOUS YEAR PAPERCHAPTER - QUESTION PAPER 2011EXERCISE - PHYSICS
39 Videos
- QUESTION PAPER 2013BOOK - WB JEE PREVIOUS YEAR PAPERCHAPTER - QUESTION PAPER 2013EXERCISE - Category-III
5 Videos
Similar Questions
A train approaching a railway platform with a speed of 20ms−1 starts blowing the whistle. Speed of sound in air is 340ms−1. If the frequency of the emitted sound from the whistle is 640 Hz, the frequency of sound to a person standing on the platform will appear to be
View SolutionGiven →A=2ˆi+3ˆjand→B=ˆi+ˆj . The component of vector →A along vector →B is
View SolutionIf E and B are the magnitudes of electric and magnetic fields respectively in some region of space, then the possibilities for which a charged particle may move in that space with a uniform velocity of magnitude v are
View SolutionV- I graph for a metallic wire at two different temperature T1 and T2 is shown in figure. Which of the two temperature is higher and why?
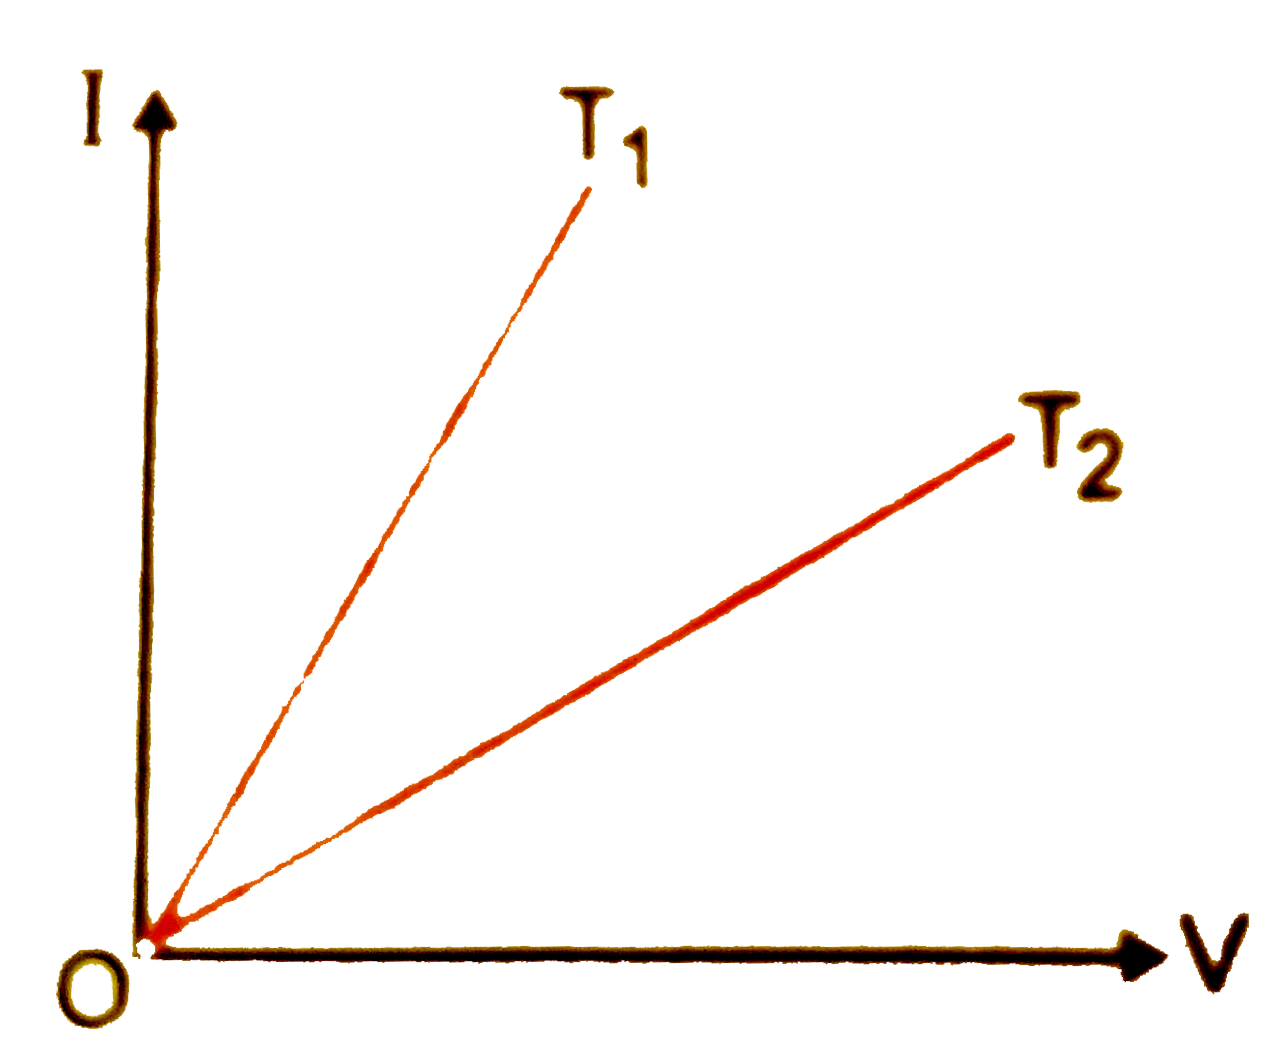
View SolutionThe figure shows the variation of V with i at temperatures T_(1) and T_(2) . Then T_(1)-T_(2) is proportional to
View SolutionThe current (I) and voltage (V) graphs for a given metallic wire at two different temperature (T1) and (T2) are shown in fig. It is concluded that
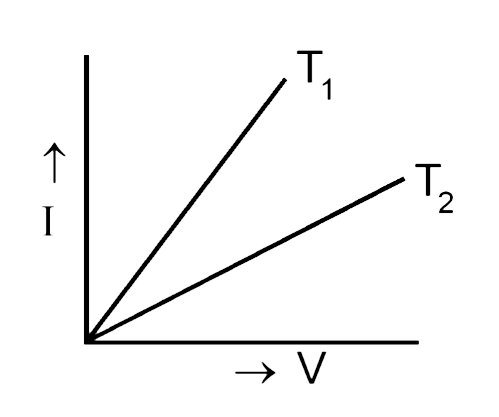
View SolutionThe V - i graph for a conductor at temperature T_(1) and T_(2) are as shown in the figure. ( T_(2) - T_(1)) is proportional to
View SolutionThe current (I) and voltage (V) graphs for a given metallic wire at two different temperature (T1) and (T2) are shown in fig. It is concluded that

View SolutionThe stress-strain graph for a metallic wire is shown at two different temperature, T_(1) and T_(2) which temperature is high T_(1) or T_(2) ?
View SolutionI-V graph for a metallie wire at two different tempearture, T1andT2 is as shown in the figure. Which of the two temperatures is lower and why ?

View Solutionएक दिये हुए धातु के तार के लिये दो विभिन्न तापों T1 व T2 पर धारा वोल्टेज ग्राफ संलग्न चित्र की भाँति हैं । इनमें कौन - सा ताप अधिक है ?
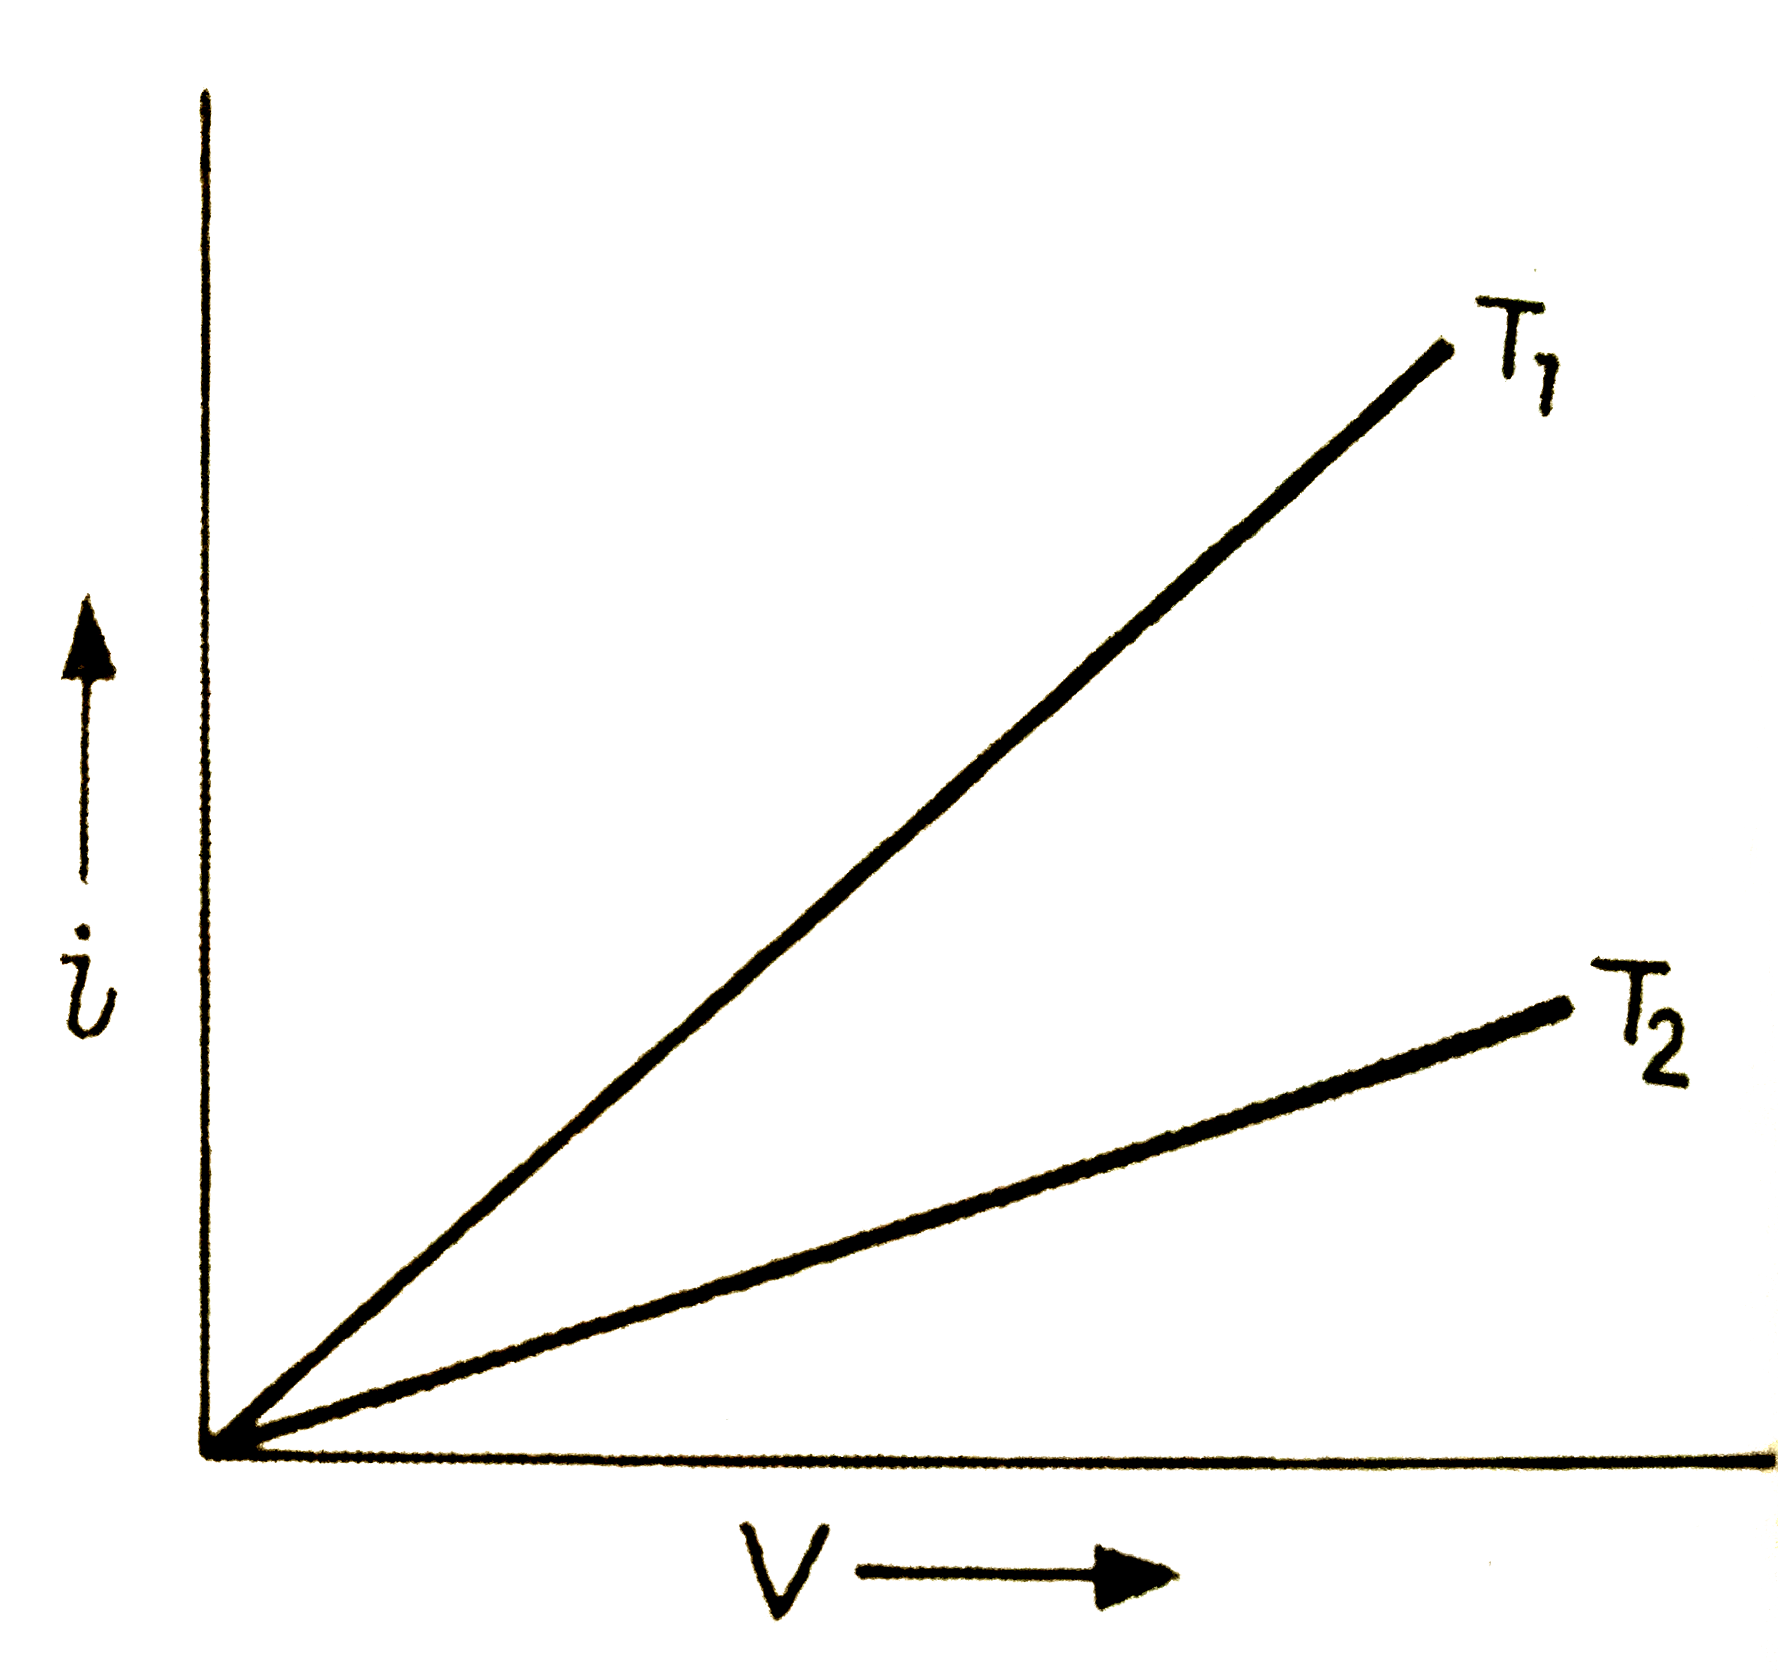
View Solutionएक धात्विक तार के लिए निम्न चित्र में ताप T1 और T2 पर V - I ग्राफ प्रदर्शित किये गये है । ताप T1और T2 में से कौन-सा ताप उच्च है और क्यों ?
View Solutionएक तार को खींचकर उसकी लम्बाई 3 गुनी कर दी जाती है उसका प्रतिरोध कितने गुना हो जायेगा
View SolutionThe current-voltage graph for a given metallic conductor at two different temperature T1andT2 are as shown in the figure. Then
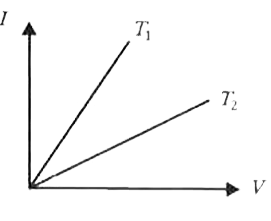
View SolutionI-V graph for a metallie wire at two different tempearture, T1andT2 is as shown in the figure. Which of the two temperatures is lower and why ?

View Solution
