The nature of graph of P versus (1V) for given mass of gas at constant temperature is .........Solution in Tamil
straight line
Topper's Solved these Questions
- THERMAL PHYSICS Book:FULL MARKSChapter:THERMAL PHYSICS Exercise:ADDITION QUESTIONS III ( True or False. If false correct it)
Explore 7 Videos
- THERMAL PHYSICS Book:FULL MARKSChapter:THERMAL PHYSICS Exercise:ADDITION QUESTIONS IV (Match the following)
Explore 1 Video
- THERMAL PHYSICS Book:FULL MARKSChapter:THERMAL PHYSICS Exercise:ADDITION QUESTIONS I (Choose the correct answer)
Explore 15 Videos
- SAMPLE PAPER-9Book:FULL MARKSChapter:SAMPLE PAPER-9Exercise:PART-IV
Explore 6 Videos
Similar Questions
According to Avogadro's law equal volumes of all gases under same pressure have equal numbers of molecules.-
View Solution1Heat−(a)Joule2Thermometer−(b)Heating3The SI of heat−(c)Temperature4Cool a cup of cofee, adding cold milk−(d)Energy5gain by heat by a body−(e)thermal equilibrium
1Boyle's Law−(a)KB=Rn2Absolute Scale−(b)V∝t3Charle's Law−(c)P∝1V4Boltzmann constant−(d)V∝n5Avagadro's Law−(e)OK (zero kelvin)
View SolutionAt constant temperature volume is inversely proportional to pressure of a gas is known as
View SolutionDefine one roentgen.
View SolutionFor a given mass of a gas what is the shape of (p) versus (1V) graph at constant temperature ?
View SolutionFor a given mass of a gas at a fixed temperature, what is the nature of graph between pressure P and volume V?
View SolutionWhat is the nature of graph of PV versus P for a given mass of a gas at constant temperature?
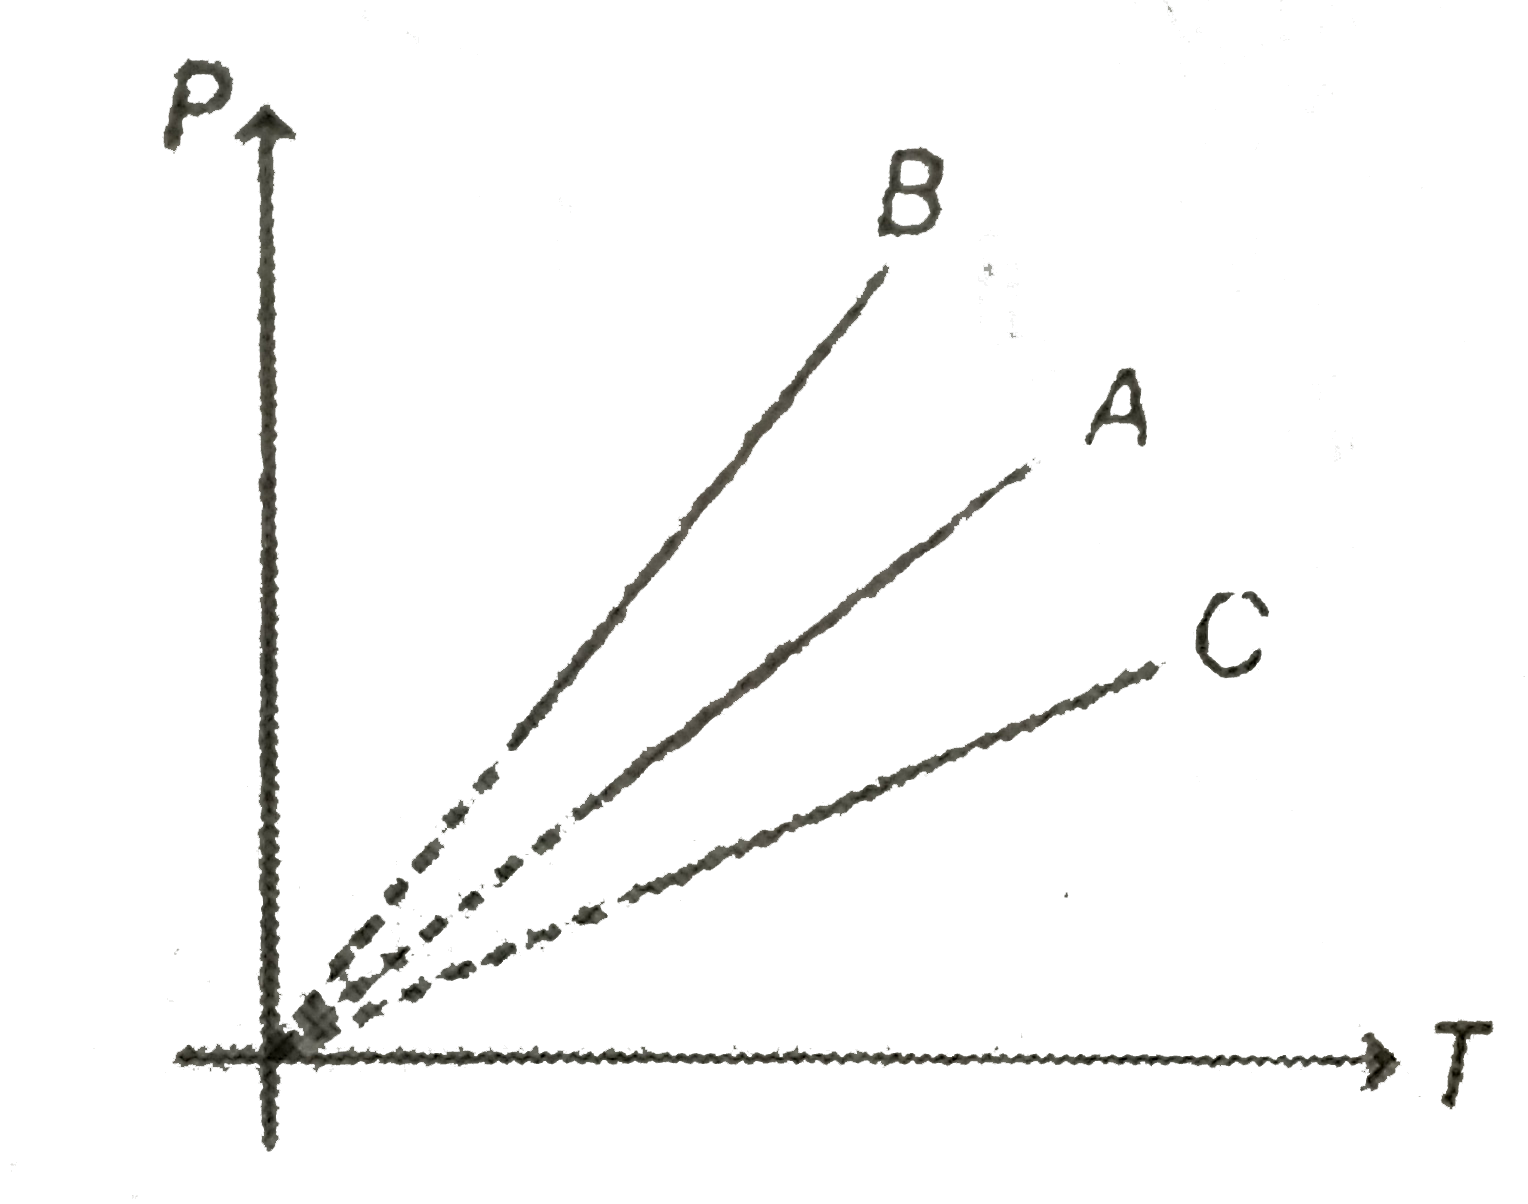
View SolutionPressure versus temperature graph of an ideal gas at constant volume V is shown by the straight line A. Now mass of the has is doubled and the volume is halved, then the corresponding pressure versus temperature graph will be shown by the line

View SolutionWill the nature of the following graphical presentations for a given mass of gas be the same? (i) P vs V at a constant temperature (ii) V vs T at constant pressure.
View Solutionfor a given mass of an ideal gas at constant temperature draw and explain the graphs (i) PV^(2) vs V (ii) P^(2)V vs V.
View SolutionWhat is the type of graph between log P and log(1V) at constant temperature for a given amount of gas ?
View SolutionThe slope of the graph between log P and log V at constant temperature for a given mass of gas is
View SolutionWhat is the nature of graph between pressure (P) and volume(V)for a given mass of a gas at a fixed temperature ?
View SolutionWhat is the nature of graph of P versus (1/V) for a given mass of gas at constant temperature ?
View SolutionWhich of the two graphs will be a straight line at constant temperature ? P versus V or P versus 1/V ? Explain.
View Solution
