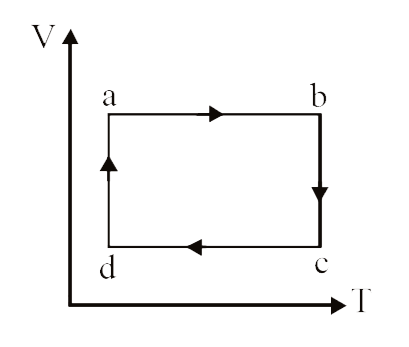
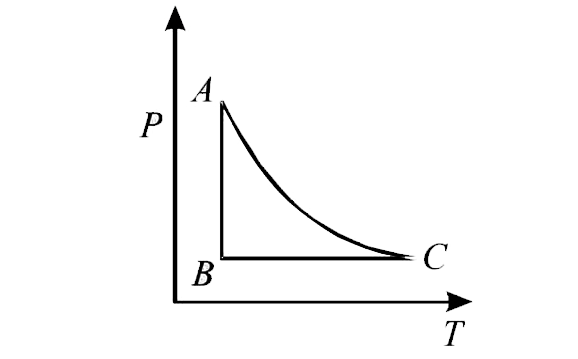
The process on an ideal gas, shown in figure,is <br><imga≤ocr_imageload∈g=lazysrc=https://d10lpgp6xz60nq.cloudfront.net/physics_imagesHCV_VOL2_C24_E01_027_Q01.pngwh=80%mx-autosty≤=background:white;>
(a)isothermal
(b)isobaric
(c)isochoric
(d)none of these.
The correct Answer is:C
Step by step video, text & image solution for The process on an ideal gas, shown in figure,is by Physics experts to help you in doubts & scoring excellent marks in Class 11 exams.
Topper's Solved these Questions
- BOOK - HC VERMACHAPTER - KINETIC THEORY OF GASESEXERCISE - Objective 27videos
KINETIC THEORY OF GASES
- BOOK - HC VERMACHAPTER - KINETIC THEORY OF GASESEXERCISE - Exercises62videos
KINETIC THEORY OF GASES
- BOOK - HC VERMACHAPTER - KINETIC THEORY OF GASESEXERCISE - Short Answer14videos
KINETIC THEORY OF GASES
- BOOK - HC VERMACHAPTER - INTRODUCTION TO PHYSICSEXERCISE - Exercises19videos
INTRODUCTION TO PHYSICS
- BOOK - HC VERMACHAPTER - LAWS OF THERMODYNAMICSEXERCISE - Short Answer15videos
LAWS OF THERMODYNAMICS
Similar Questions
Knowledge Check
- Question 1 - Select One
A cyclic process for an ideal gas is shown in figure . Given WAB=+700J,WBC=+400J,QCA=−100J.
_E01_230_Q01.png)
Find ΔUBCA−700JB−400JC−100JD400J - Question 2 - Select One
A cyclic process for an ideal gas is shown in figure . Given WAB=+700J,WBC=+400J,QCA=−100J.
_E01_231_Q01.png)
Find WCAA−500JB500JC400JD−400J - Question 3 - Select One
A cyclic process for an ideal gas is shown in figure . Given WAB=+700J,WBC=+400J,QCA=−100J.
_E01_232_Q01.png)
The efficiency of the cycle is -A100%B83.44%C85.71%D81.11%
V-T graph of a process of monoatomic ideal gas is shown in figure.
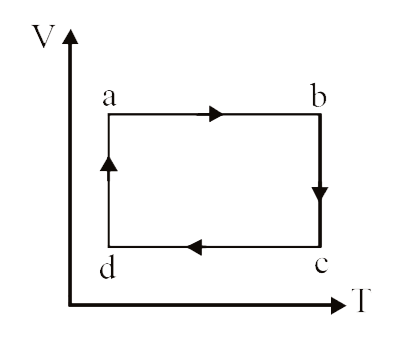
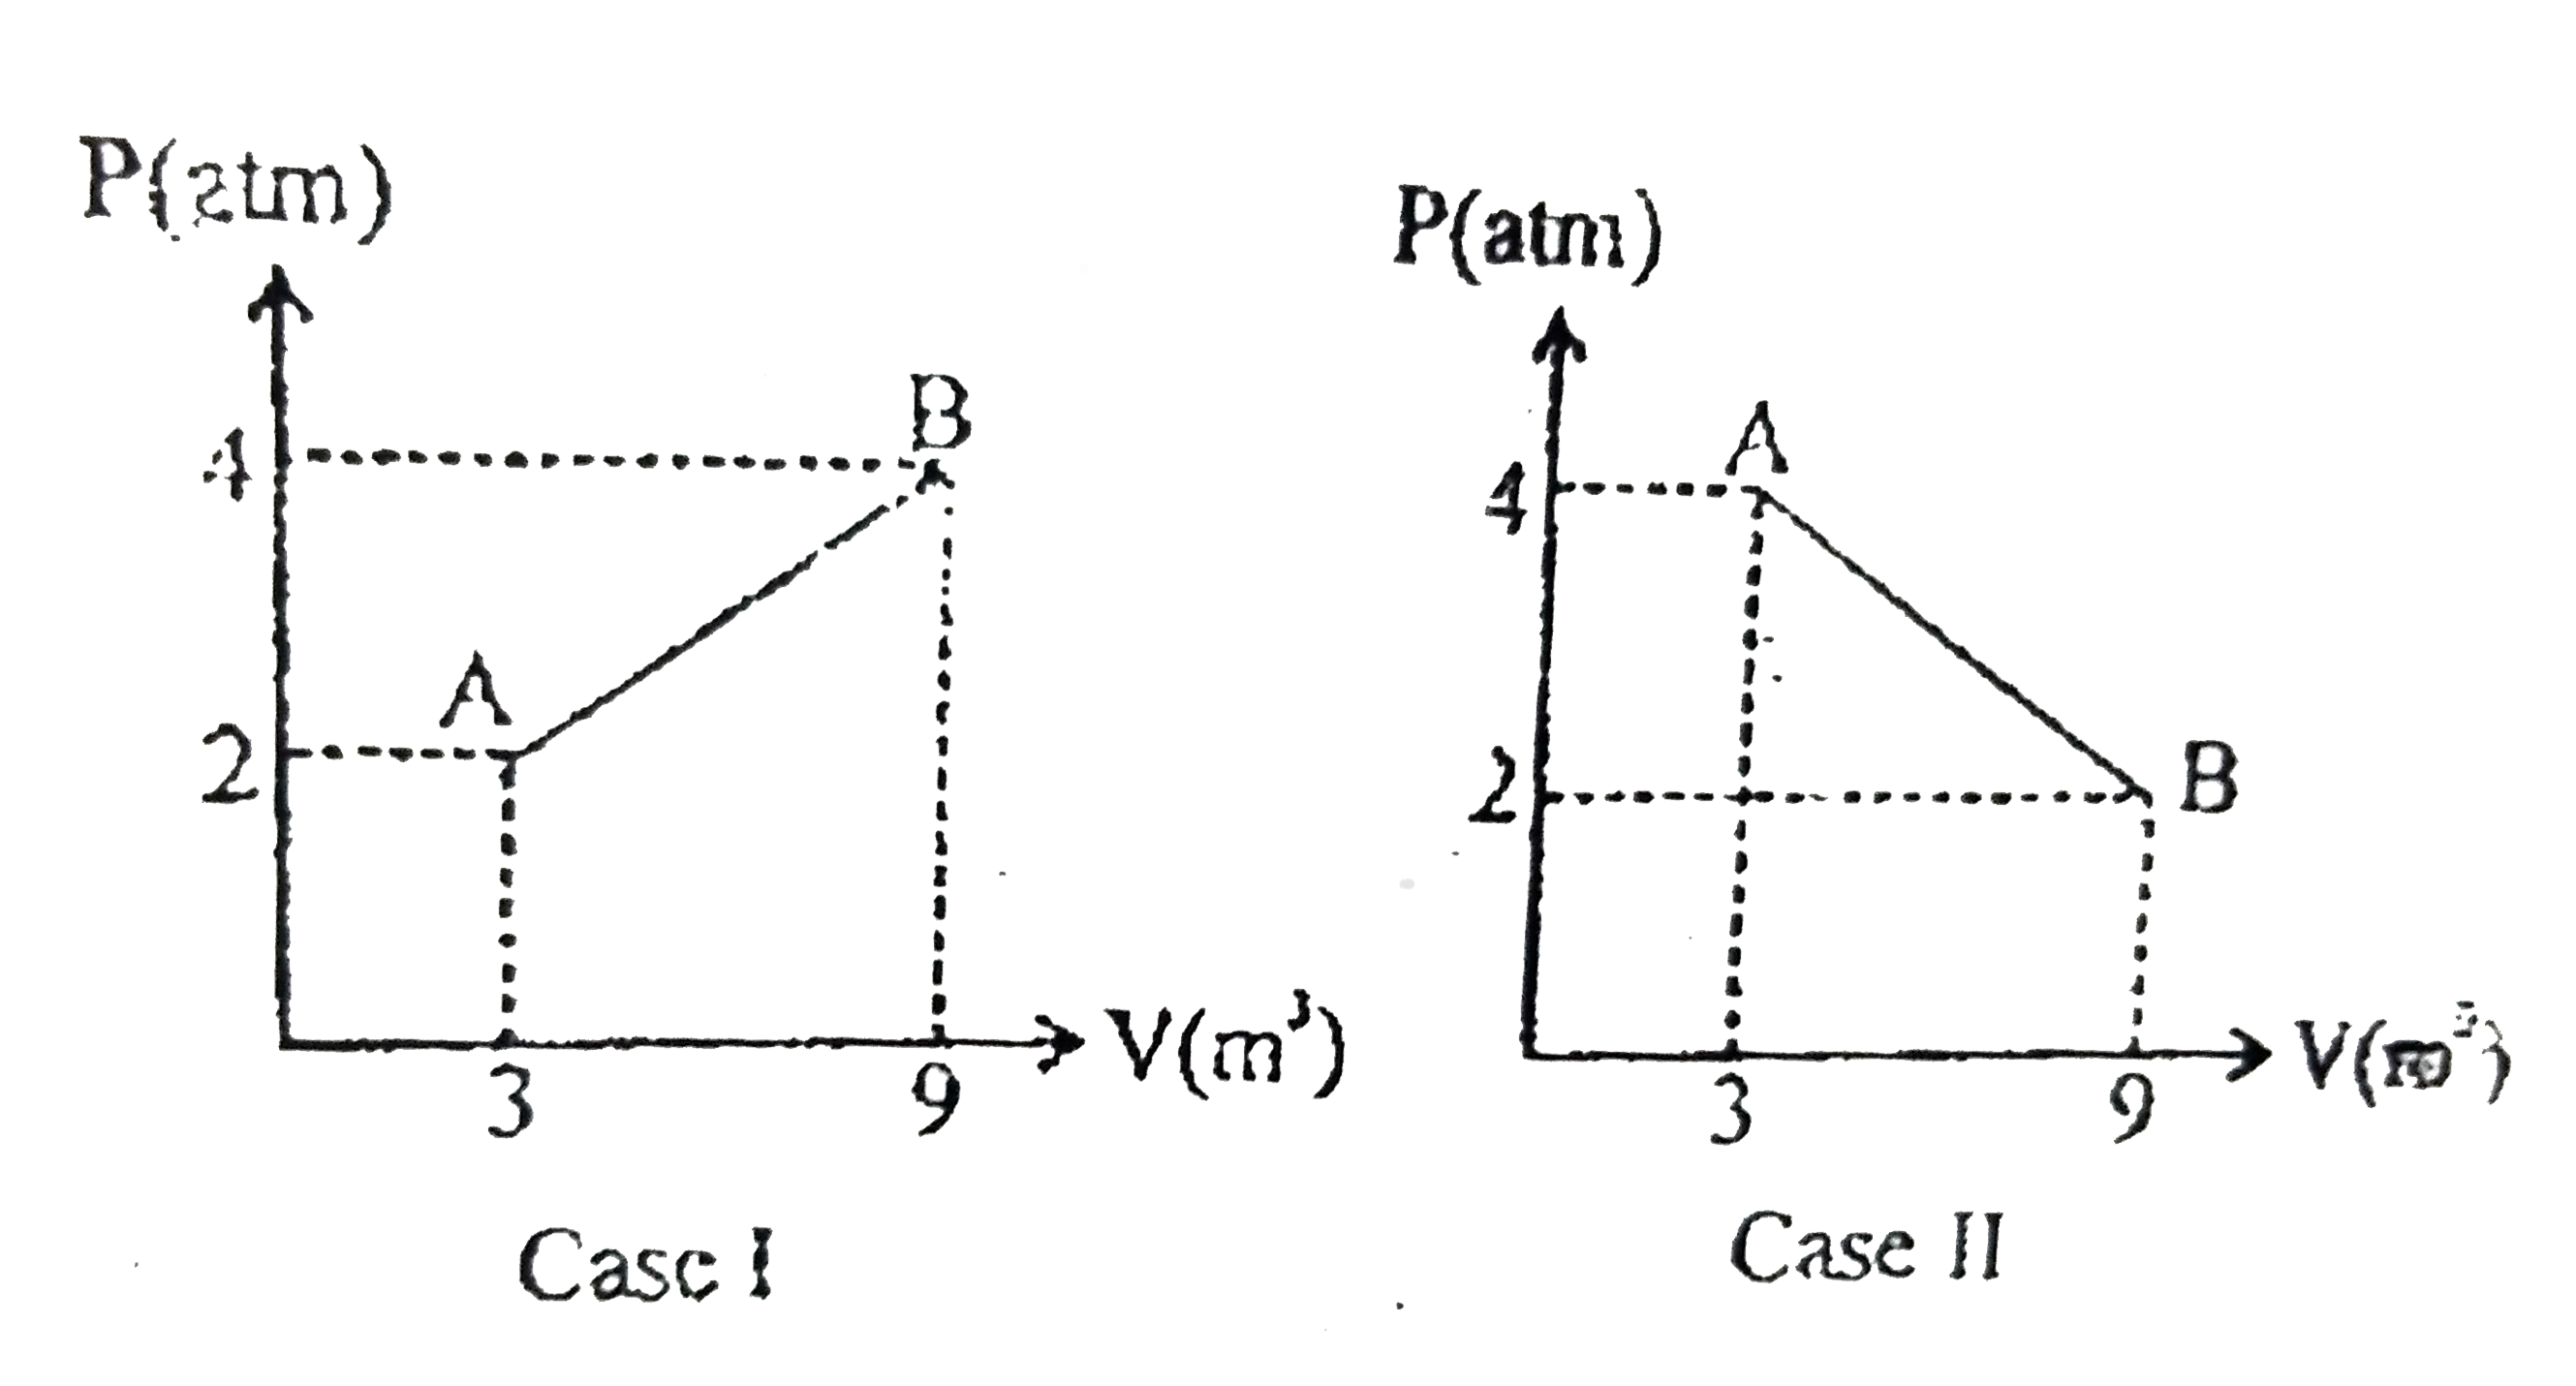
Change in internal energy of the gas is zero in process(s)-View SolutionPressure verus Volume graphs for two process for ideal gas is shown in figure. In each case state of a system is changed from A to B along the straight lines shown. In which case, will the heat added to the system be more?
 View Solution
The P−T graph for the given mass of an ideal gas is shown in figure. Then the volume
_E01_022_Q01.png) View Solution
View SolutionThe PT diagram for an ideal gas is shown in the figure, where AC is an adiabatic process, find the corresponding PV diagram.
 View Solution
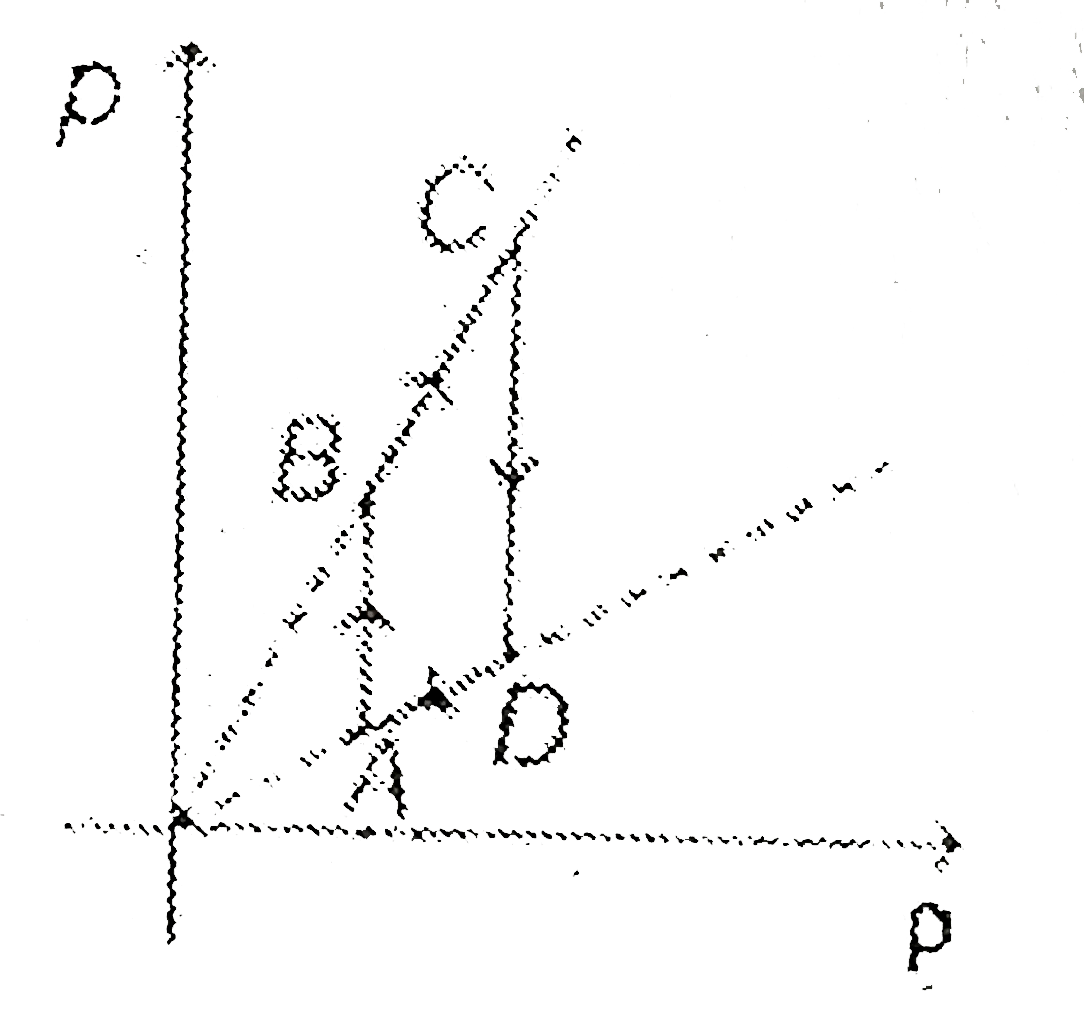
Pressure versus density graph of an ideal gas is shown in figure
 View Solution


