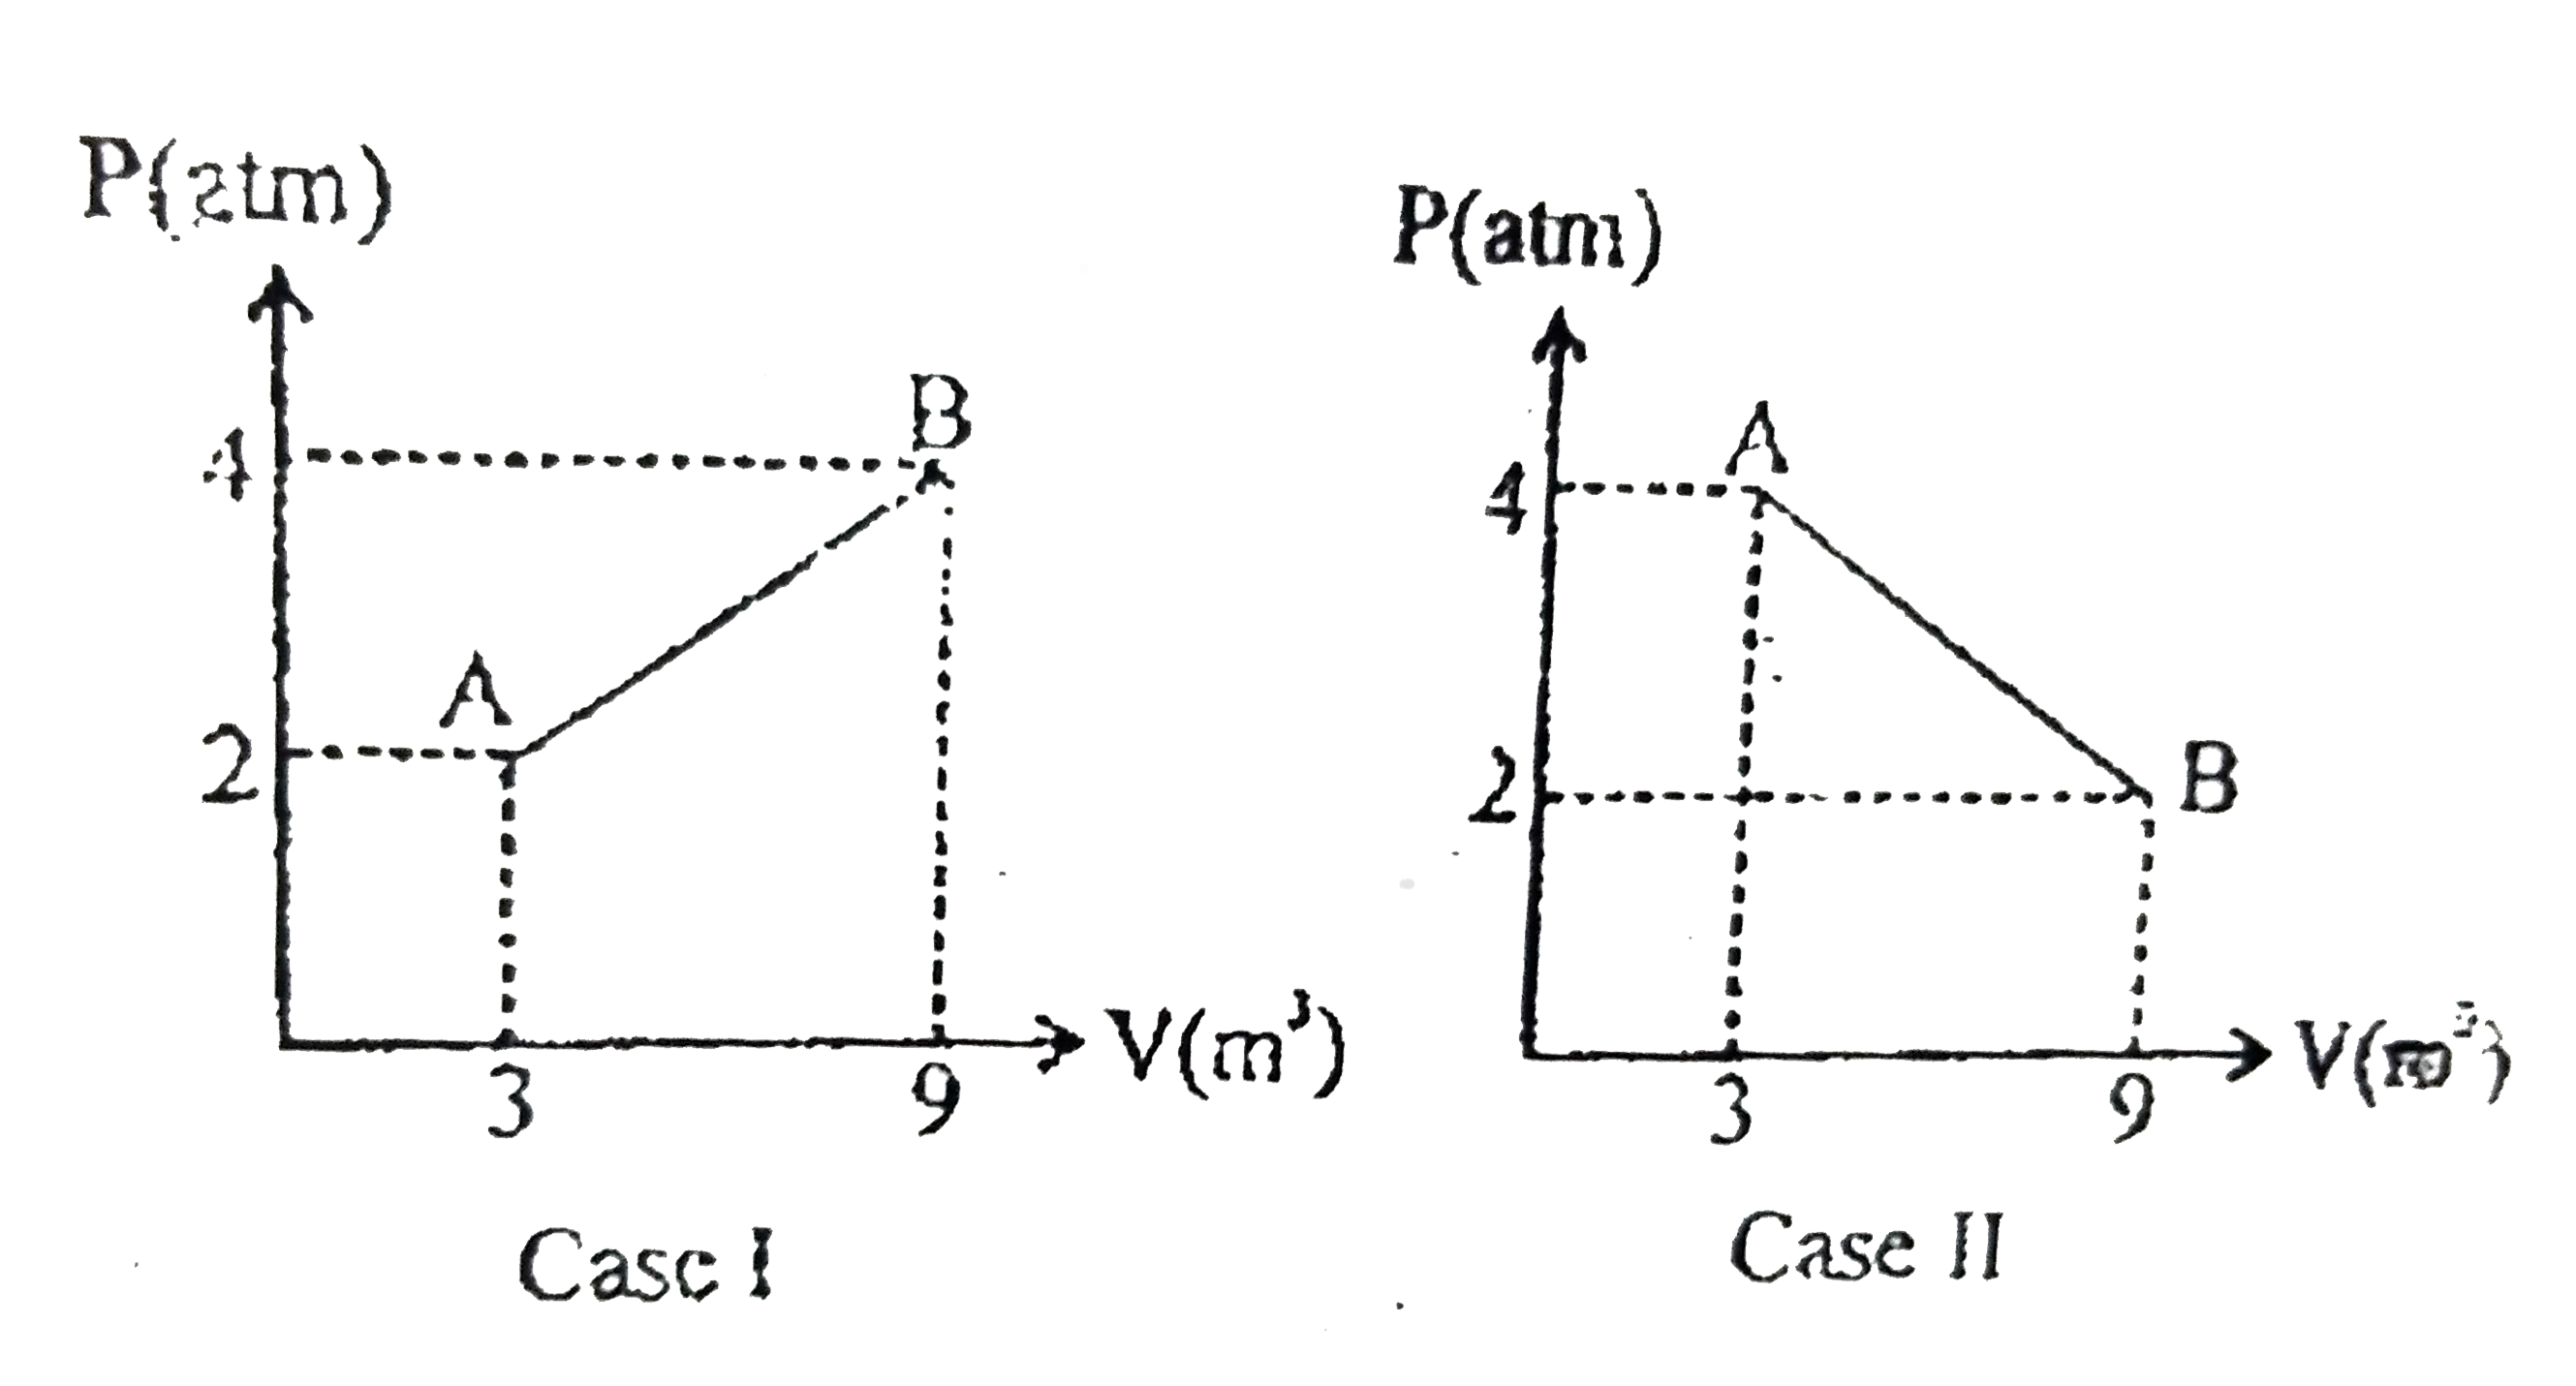
Pressure verus Volume graphs for two process for ideal gas is shown in figure. In each case state of a system is changed from A to B along the straight lines shown. In which case, will the heat added to the system be more?
Case I
Case II
Is non-zero but the same in both cases
Is zero in both cases
ΔQ=Δu+w
Heat added would depend on change in internal energy as work done by the gas is same in both cases.
As, T∝PV, we find ΔT is more in case 1 & hence change in internal energy will be more in case 1. This Heat added will be more in case 1.
Topper's Solved these Questions
- BOOK - BANSALCHAPTER - TEST PAPERSEXERCISE - PHYSICS PART (A)32videos
TEST PAPERS
- BOOK - BANSALCHAPTER - TEST PAPERSEXERCISE - PHYSICS PART (B)3videos
TEST PAPERS
- BOOK - BANSALCHAPTER - TEST PAPERSEXERCISE - PHYSICS PART- C4videos
TEST PAPERS
- BOOK - BANSALCHAPTER - SEMICONDUCTORSEXERCISE - CBSE Question32videos
SEMICONDUCTORS
Similar Questions
Knowledge Check
- Question 1 - Select One
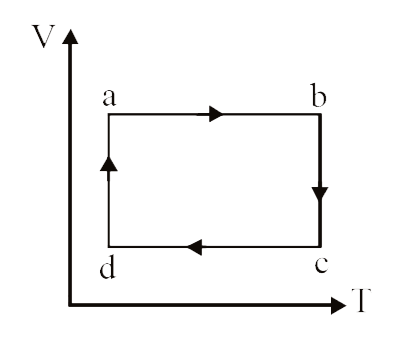
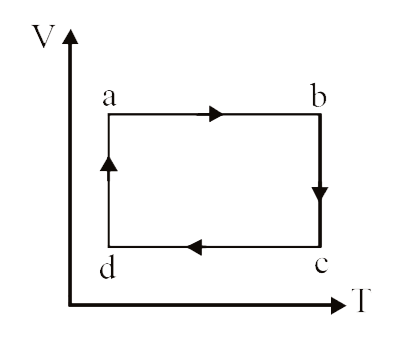
graph of an ideal gas is as shown in figure.
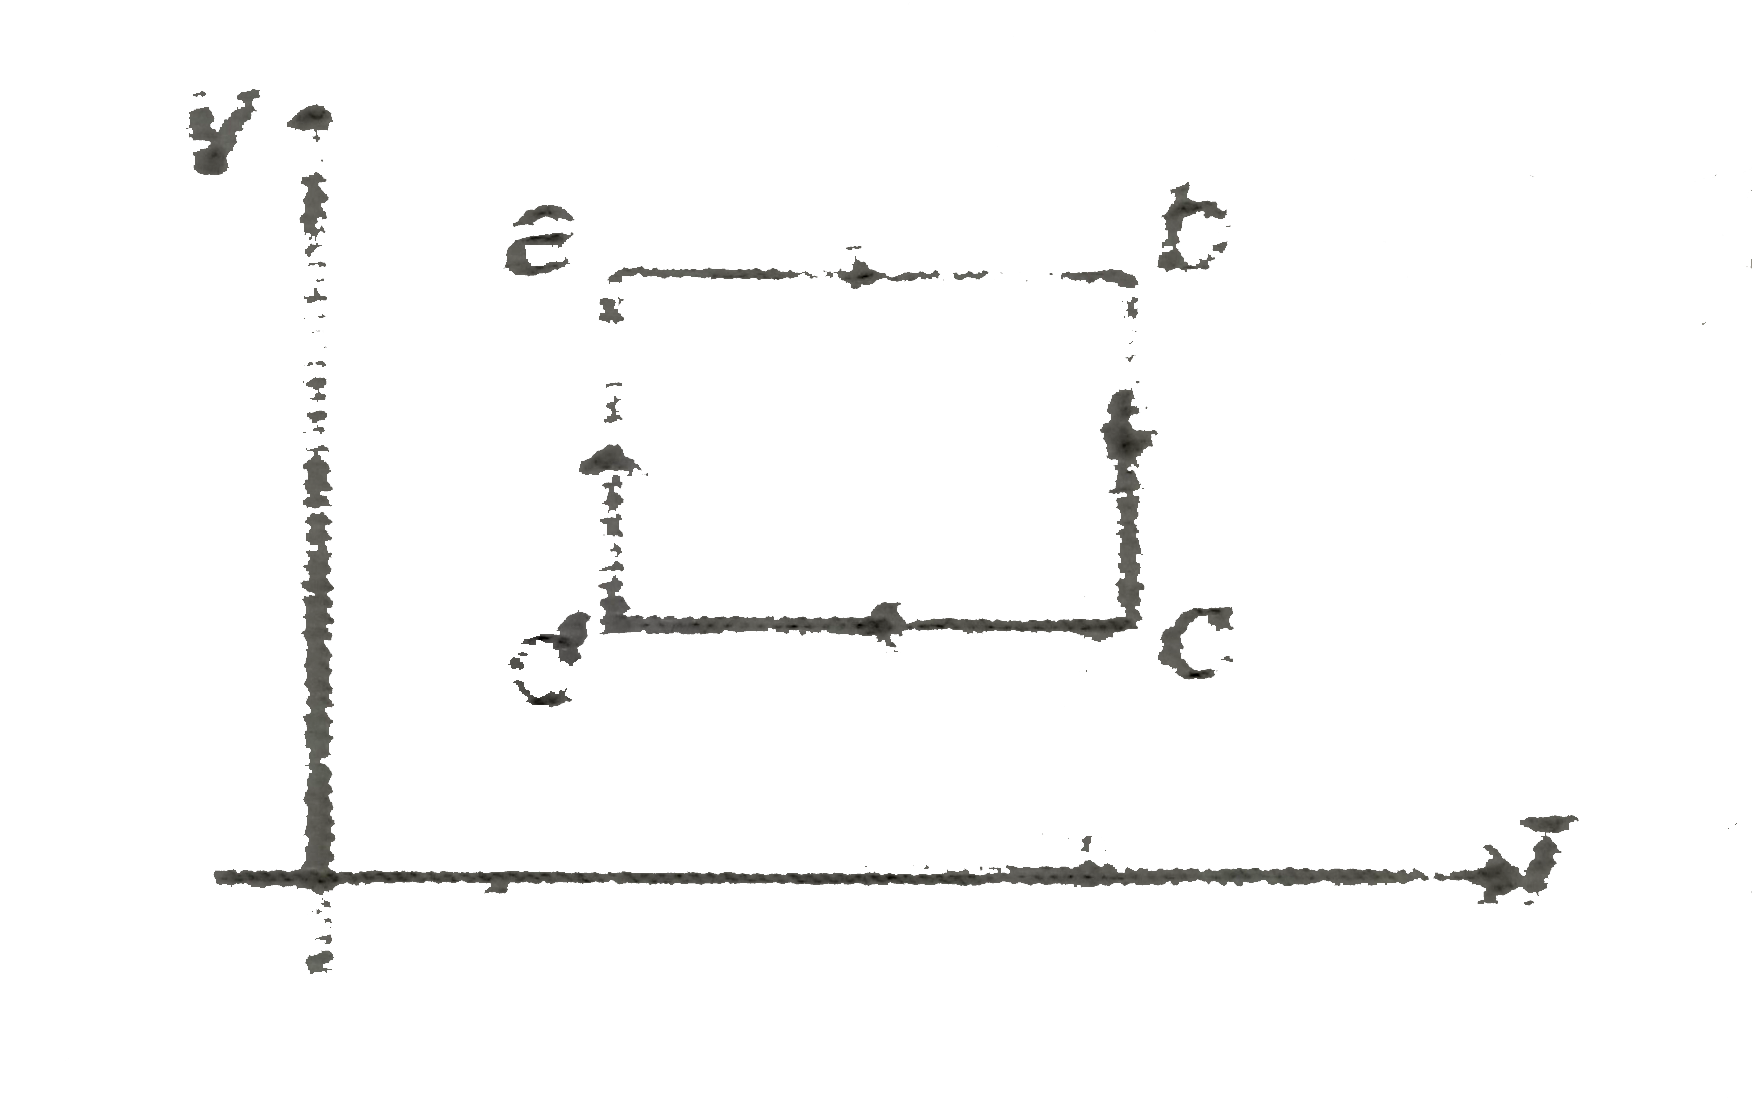
Heat is supplied to the gas in process (s).Ada, ab and bcBda and abCda onlyDab and bc - Question 2 - Select One
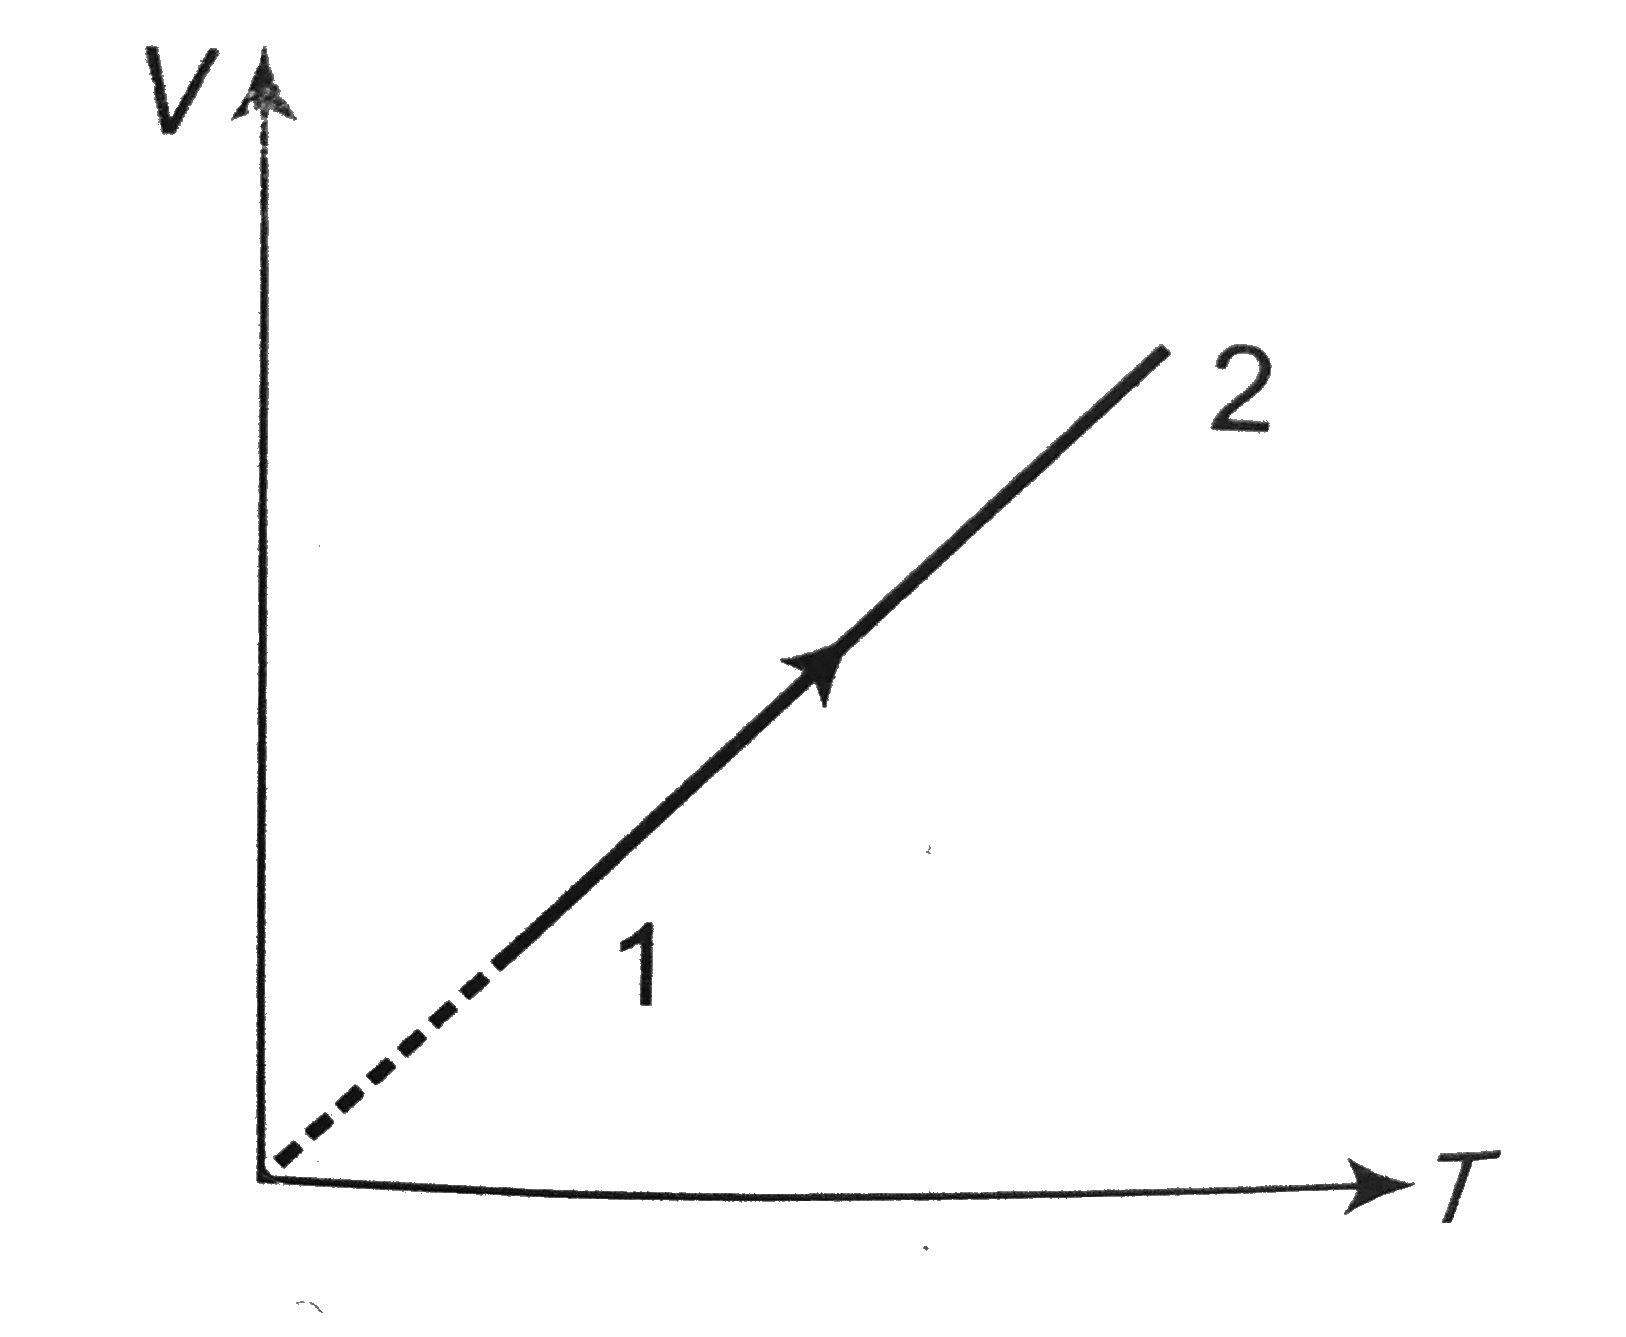
Volume versus temperature graph of two moles of helium gas is as shown in figure. The ratio of heat absorbed and the work done by the gas in process 1−2 is
 A3B52C53D72
 - Question 3 - Select One
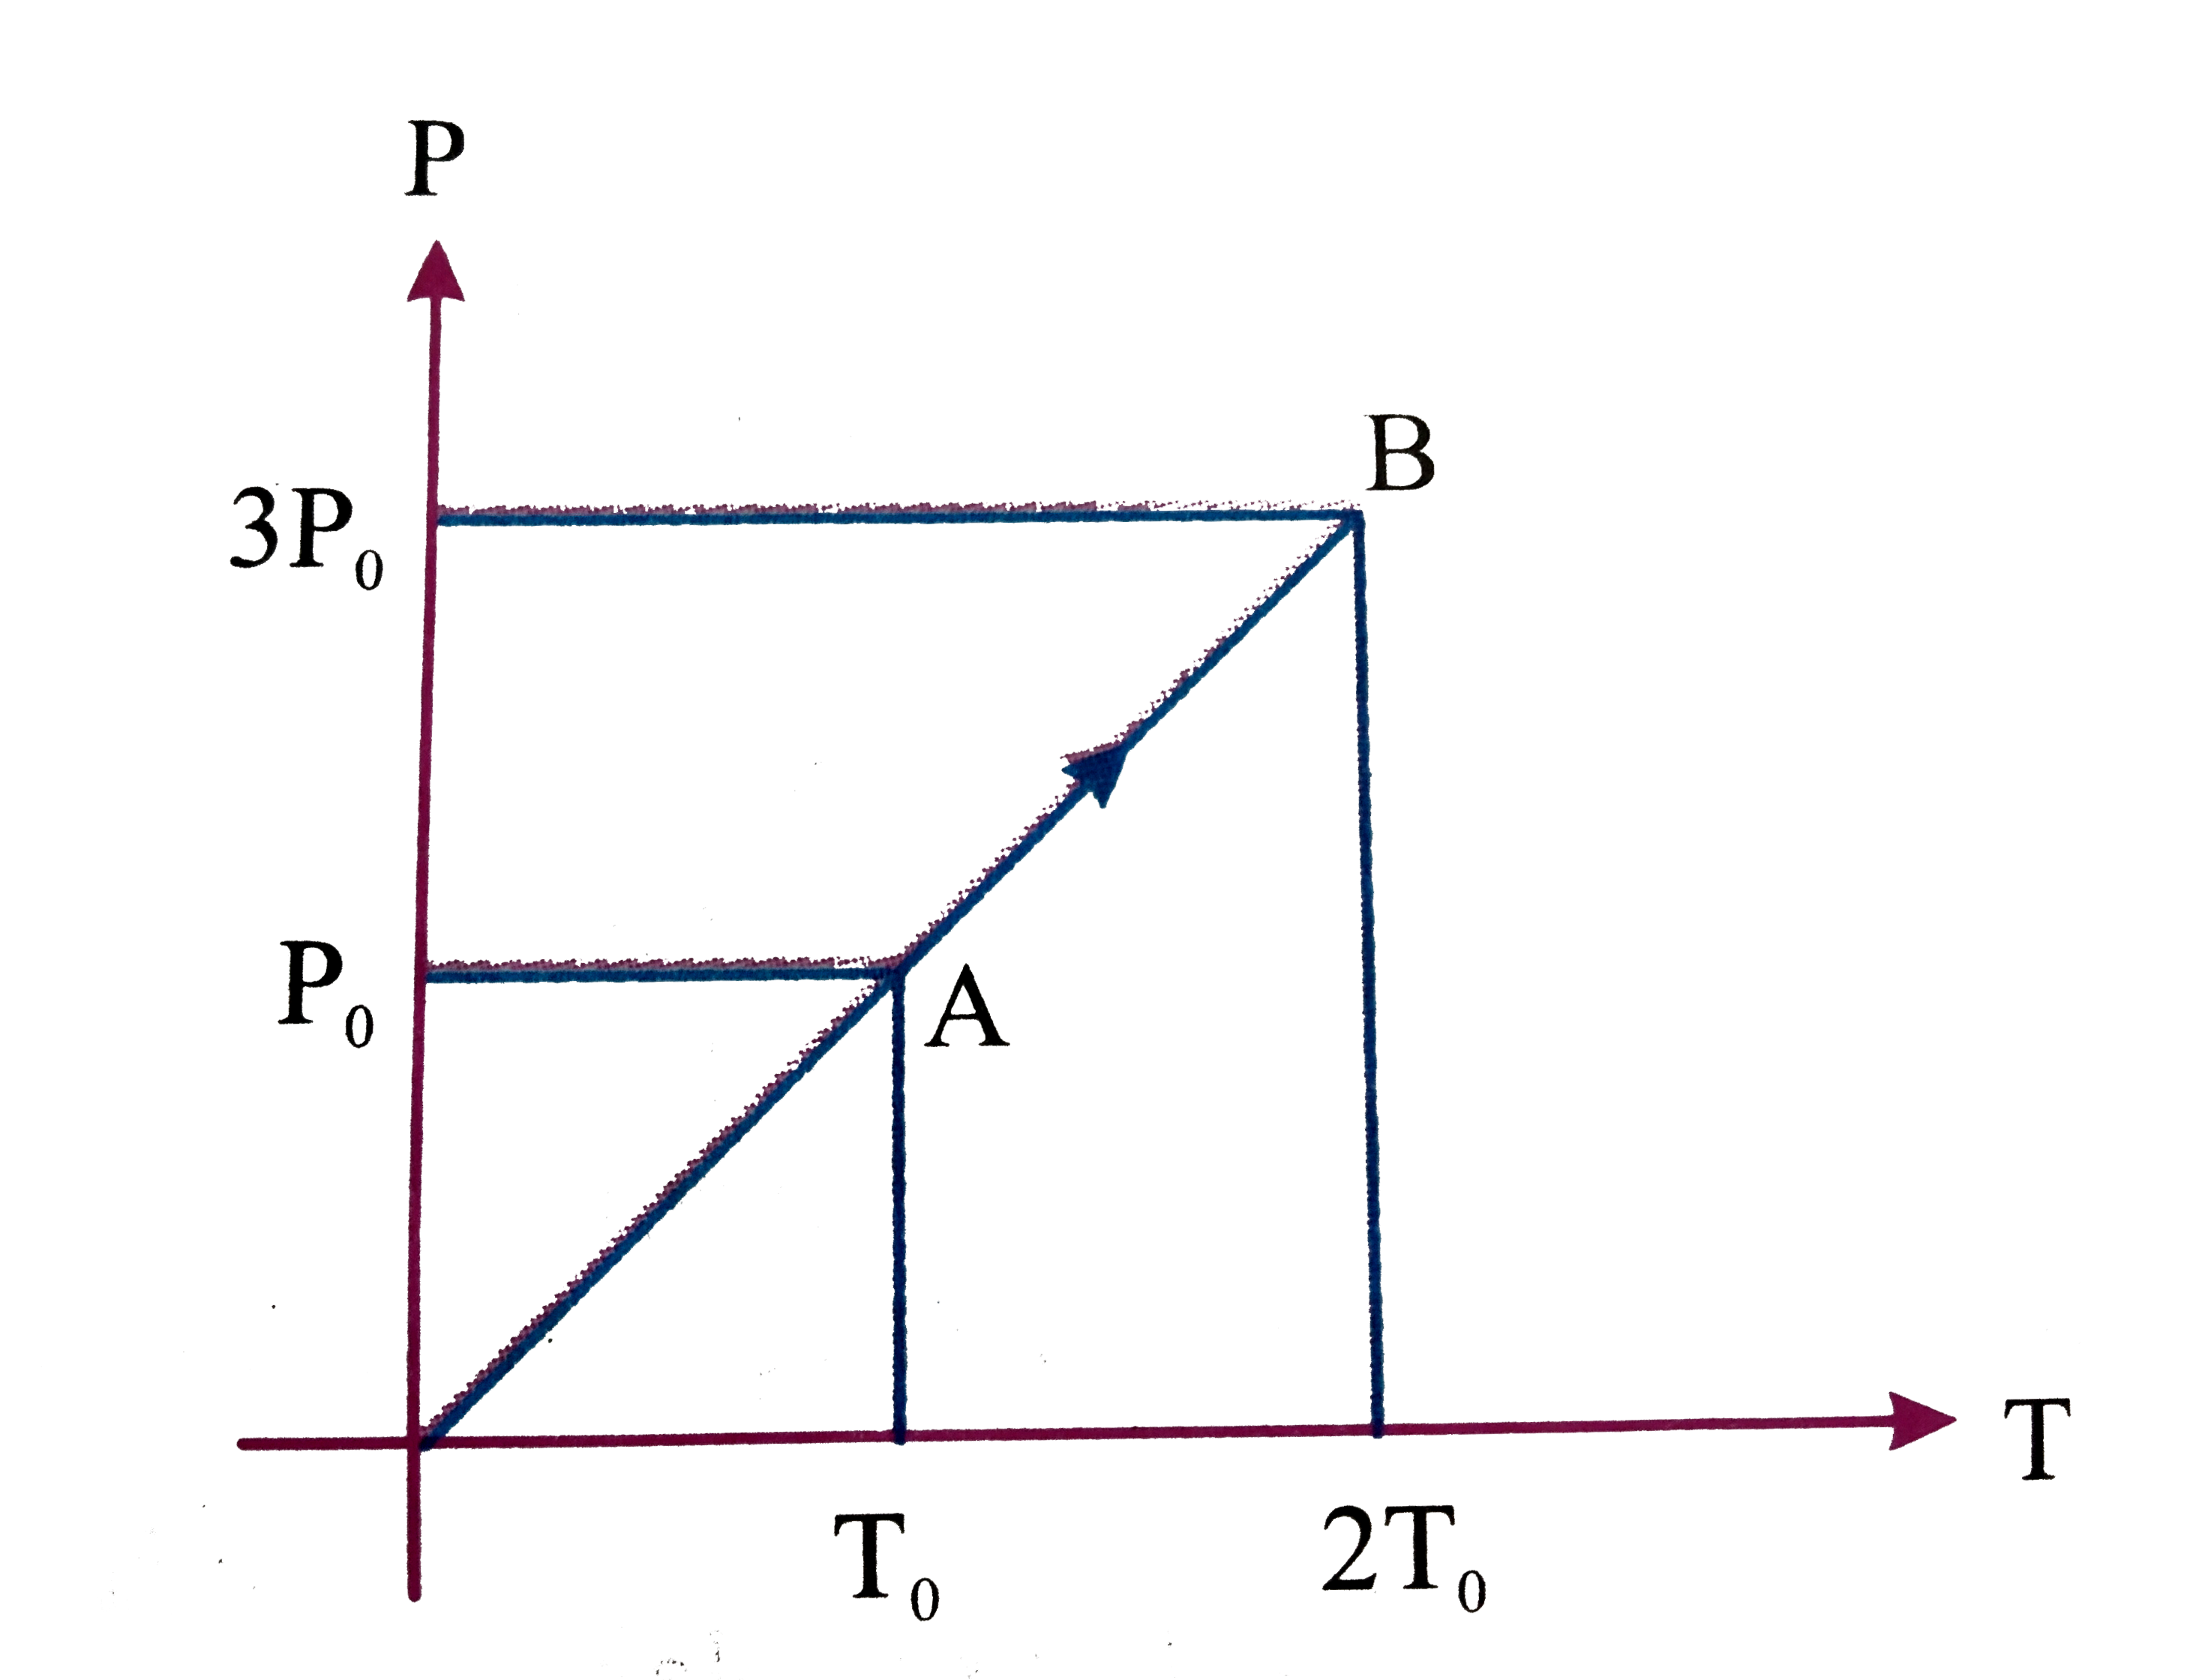
Pressure versus temperature graph of an ideal gas is shown in figure. Density of the gas at point A is P0. Density at B will be
 A34ρ0B32ρ0C43ρ0D2ρ0
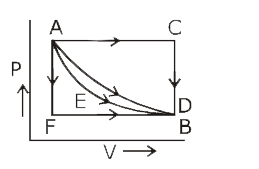
An ideal system can be brought from stage A to B through four paths as shown in the figure. The heat energy given to the system is minimum in :
 View Solution
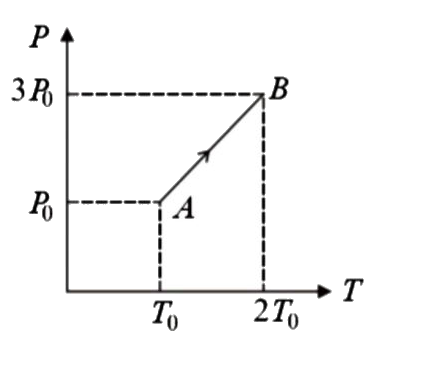
Pressure versus temperature graph of an ideal gas is as shown in figure. Density of the gas at point A is ρ0. Density at point B will be :-
 View Solution
An ideal gas change from state a to state b as shown in Fig. what is the work done by the gas in the process?
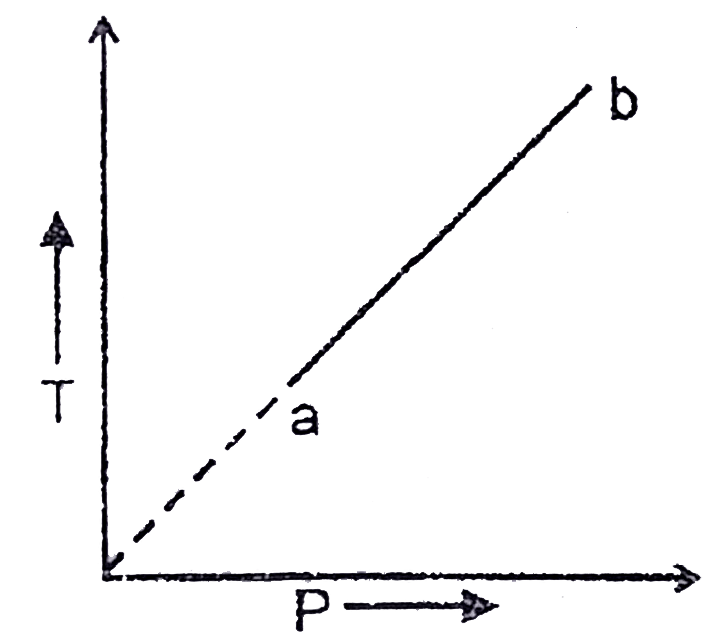 View Solution
An ideal gas change from state a to state b as shown in Fig. what is the work done by the gas in the process?
 View Solution
An ideal system can be brought from stage A to B through Four paths as shown in the figure. The energy given to the system is minimum is:
 View Solution


