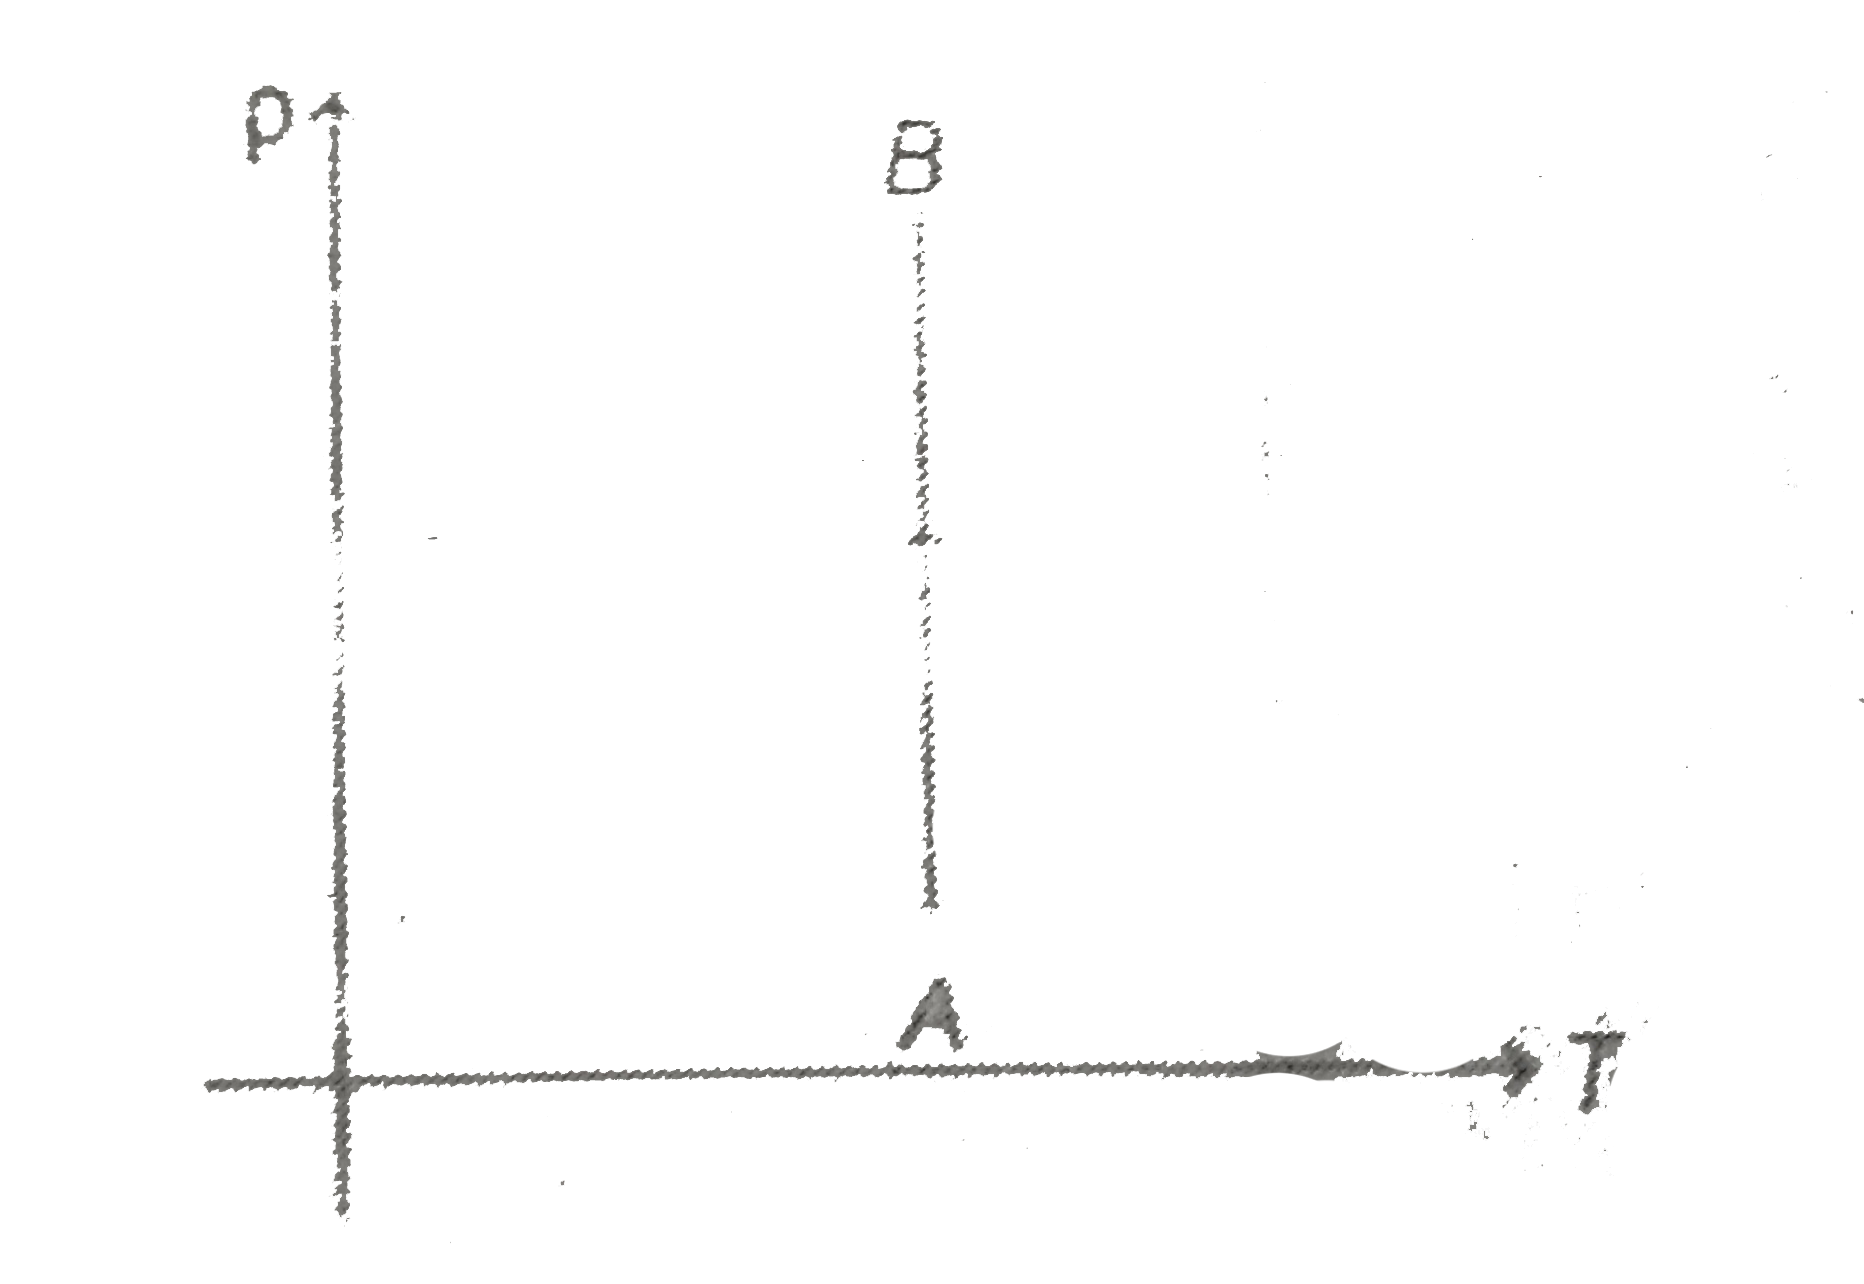
The resistance R of a conductor varies with temperature t as shown in the figure. If the variation is represented by Rt=R0[1+αt+βt2], then
![The resistance R of a conductor varies with temperature t as shown in the figure. If the variation is represented by R(t) = R(0)[1+ alphat +betat^(2)], then](https://d10lpgp6xz60nq.cloudfront.net/physics_images/ERRL_PHY_NEET_V02_C19_E01_564_Q01.png)
α and β are both negative
α and β are positive
α is positive and β is negative
α is negative and β is positive
The correct Answer is:B
Step by step video & image solution for The resistance R of a conductor varies with temperature t as shown in the figure. If the variation is represented by R_(t) = R_(0)[1+ alphat +betat^(2)], then by Physics experts to help you in doubts & scoring excellent marks in Class 12 exams.
Updated on:21/07/2023Topper's Solved these Questions
- ELECTRIC CURRENT & CIRCUITSBOOK - CENGAGE PHYSICS ENGLISHCHAPTER - ELECTRIC CURRENT & CIRCUITSEXERCISE - Combination of Resistance 1
14 Videos
- ELECTRIC CURRENT & CIRCUITSBOOK - CENGAGE PHYSICS ENGLISHCHAPTER - ELECTRIC CURRENT & CIRCUITSEXERCISE - Combination of Resistance 2
14 Videos
- COULOMB LAW AND ELECTRIC FIELDBOOK - CENGAGE PHYSICS ENGLISHCHAPTER - COULOMB LAW AND ELECTRIC FIELDEXERCISE - Single Answer Correct Type
22 Videos
- ELECTRIC CURRENT AND CIRCUITBOOK - CENGAGE PHYSICS ENGLISHCHAPTER - ELECTRIC CURRENT AND CIRCUITEXERCISE - Interger
8 Videos
Similar Questions
Knowledge Check
Assertion : Current versus potential difference (i-V) graph for a conductor at two different temperatures T1 and T2 is shown in figure. Hence T1>T2.
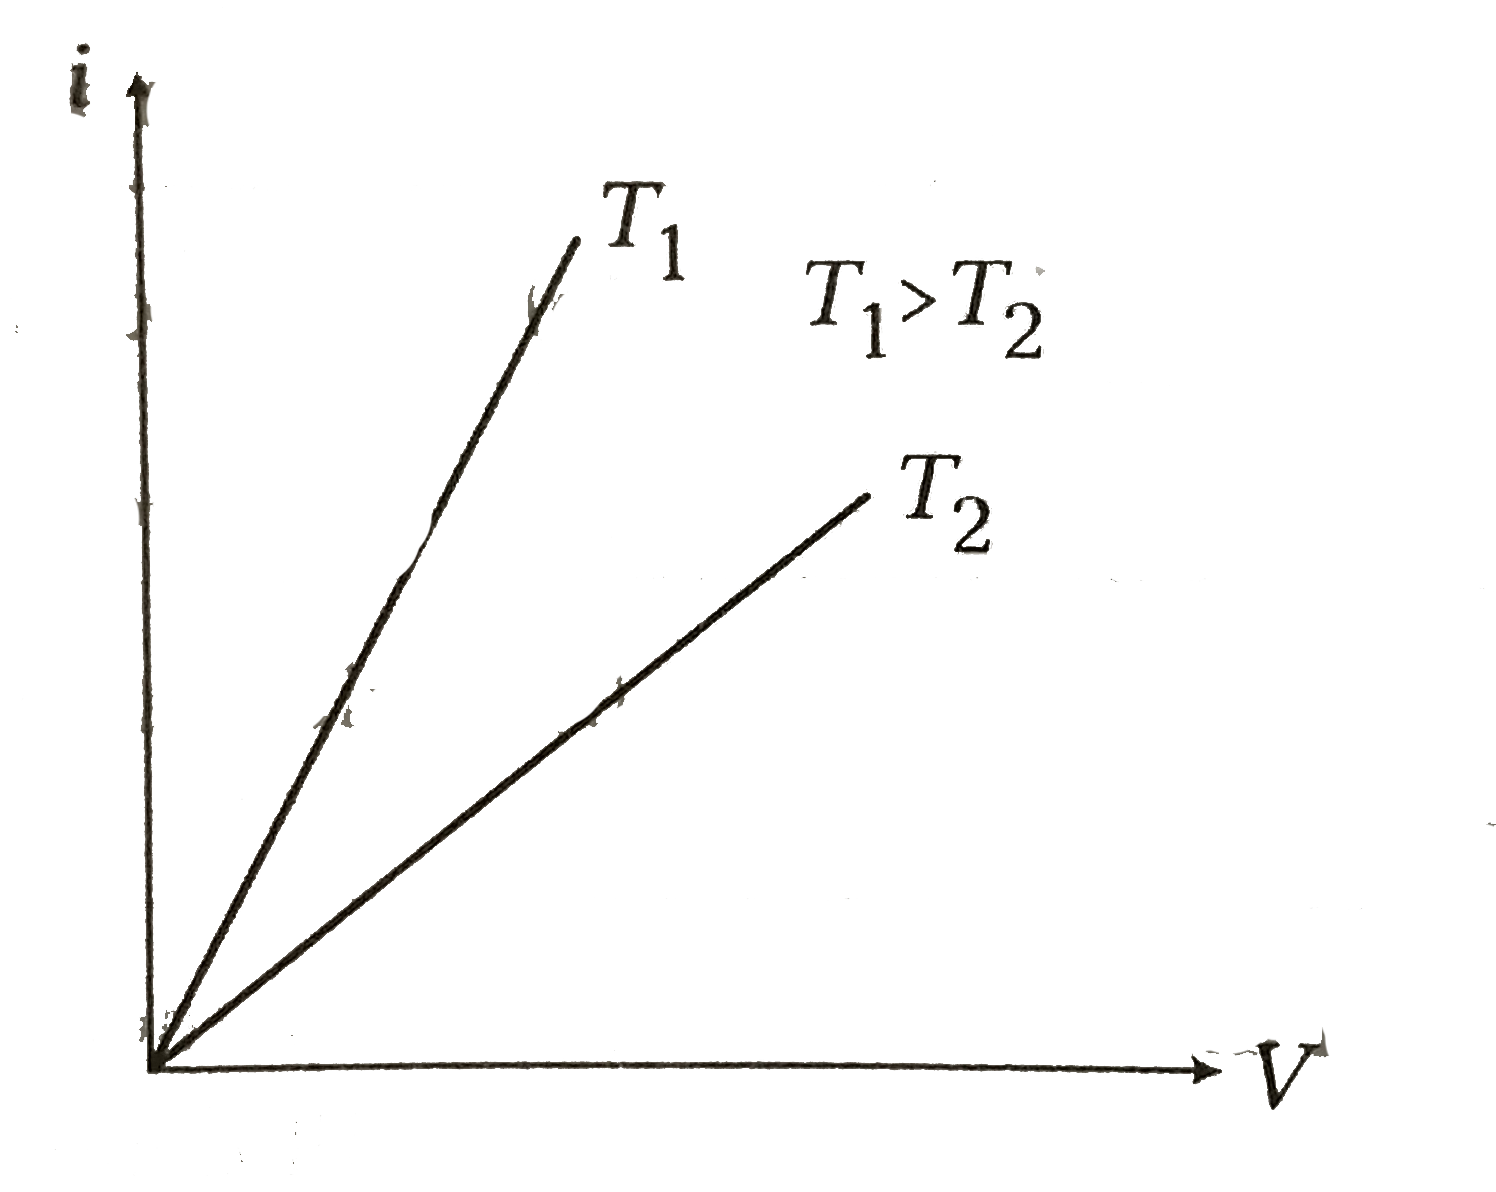
Reason : Resistance of a conductor increases with rise in temperature.Acos2θBsin2θCcot2θDtan2θIn the shown in the given figure, the resistances R1andR2 are respectively
 A14Ωand40ΩB40Ωand44ΩC40Ωand30ΩD14Ωand30Ω
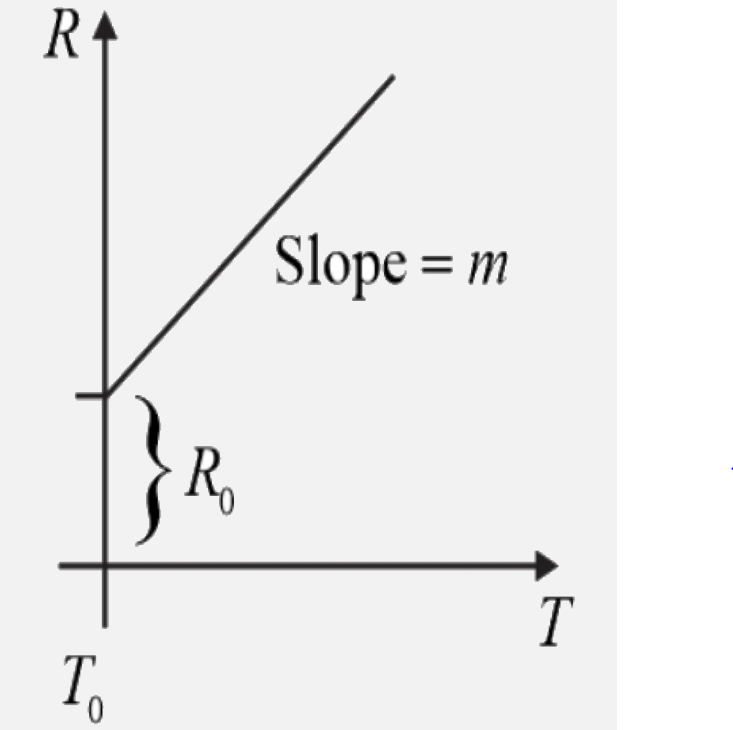
Variation of resistance of the conductor with temperature is shown . Temperature coefficient of the conductor is
View SolutionA cell of emf E having an internal resistance R varies with R as shown in figure by the curve
View SolutionIn an electric circuit shown alongside, find

terminal voltage of the battery
View SolutionThe power dissipated in the resistance R, in the circuit as shown in the figure, is maximum if R is equal to
View Solution(a) Draw graph showing the variation of current versus voltage in an electroyte when an external resistance is also connceted.
(b) (i) The graph between resistance (R ) and temperature (T) for Hg is shown in the figure (a). Explain the behaviour of Hg near 4k.
(ii) In which region of the graph shown in the figure (b) is the resistance negative and why?

View SolutionA platinum resistance thermometer is constructed which reads ,00 at ice point and 1000 at steam point. Let tp denote temperature on this scale and let t denote the temperature on a mercury on a mercury thermometer scale. The resistance of the platinum coil varies with t as R1=R0(1+αt+βt2). Derive an expression for the resistance as a function of Tp.
View Solution

