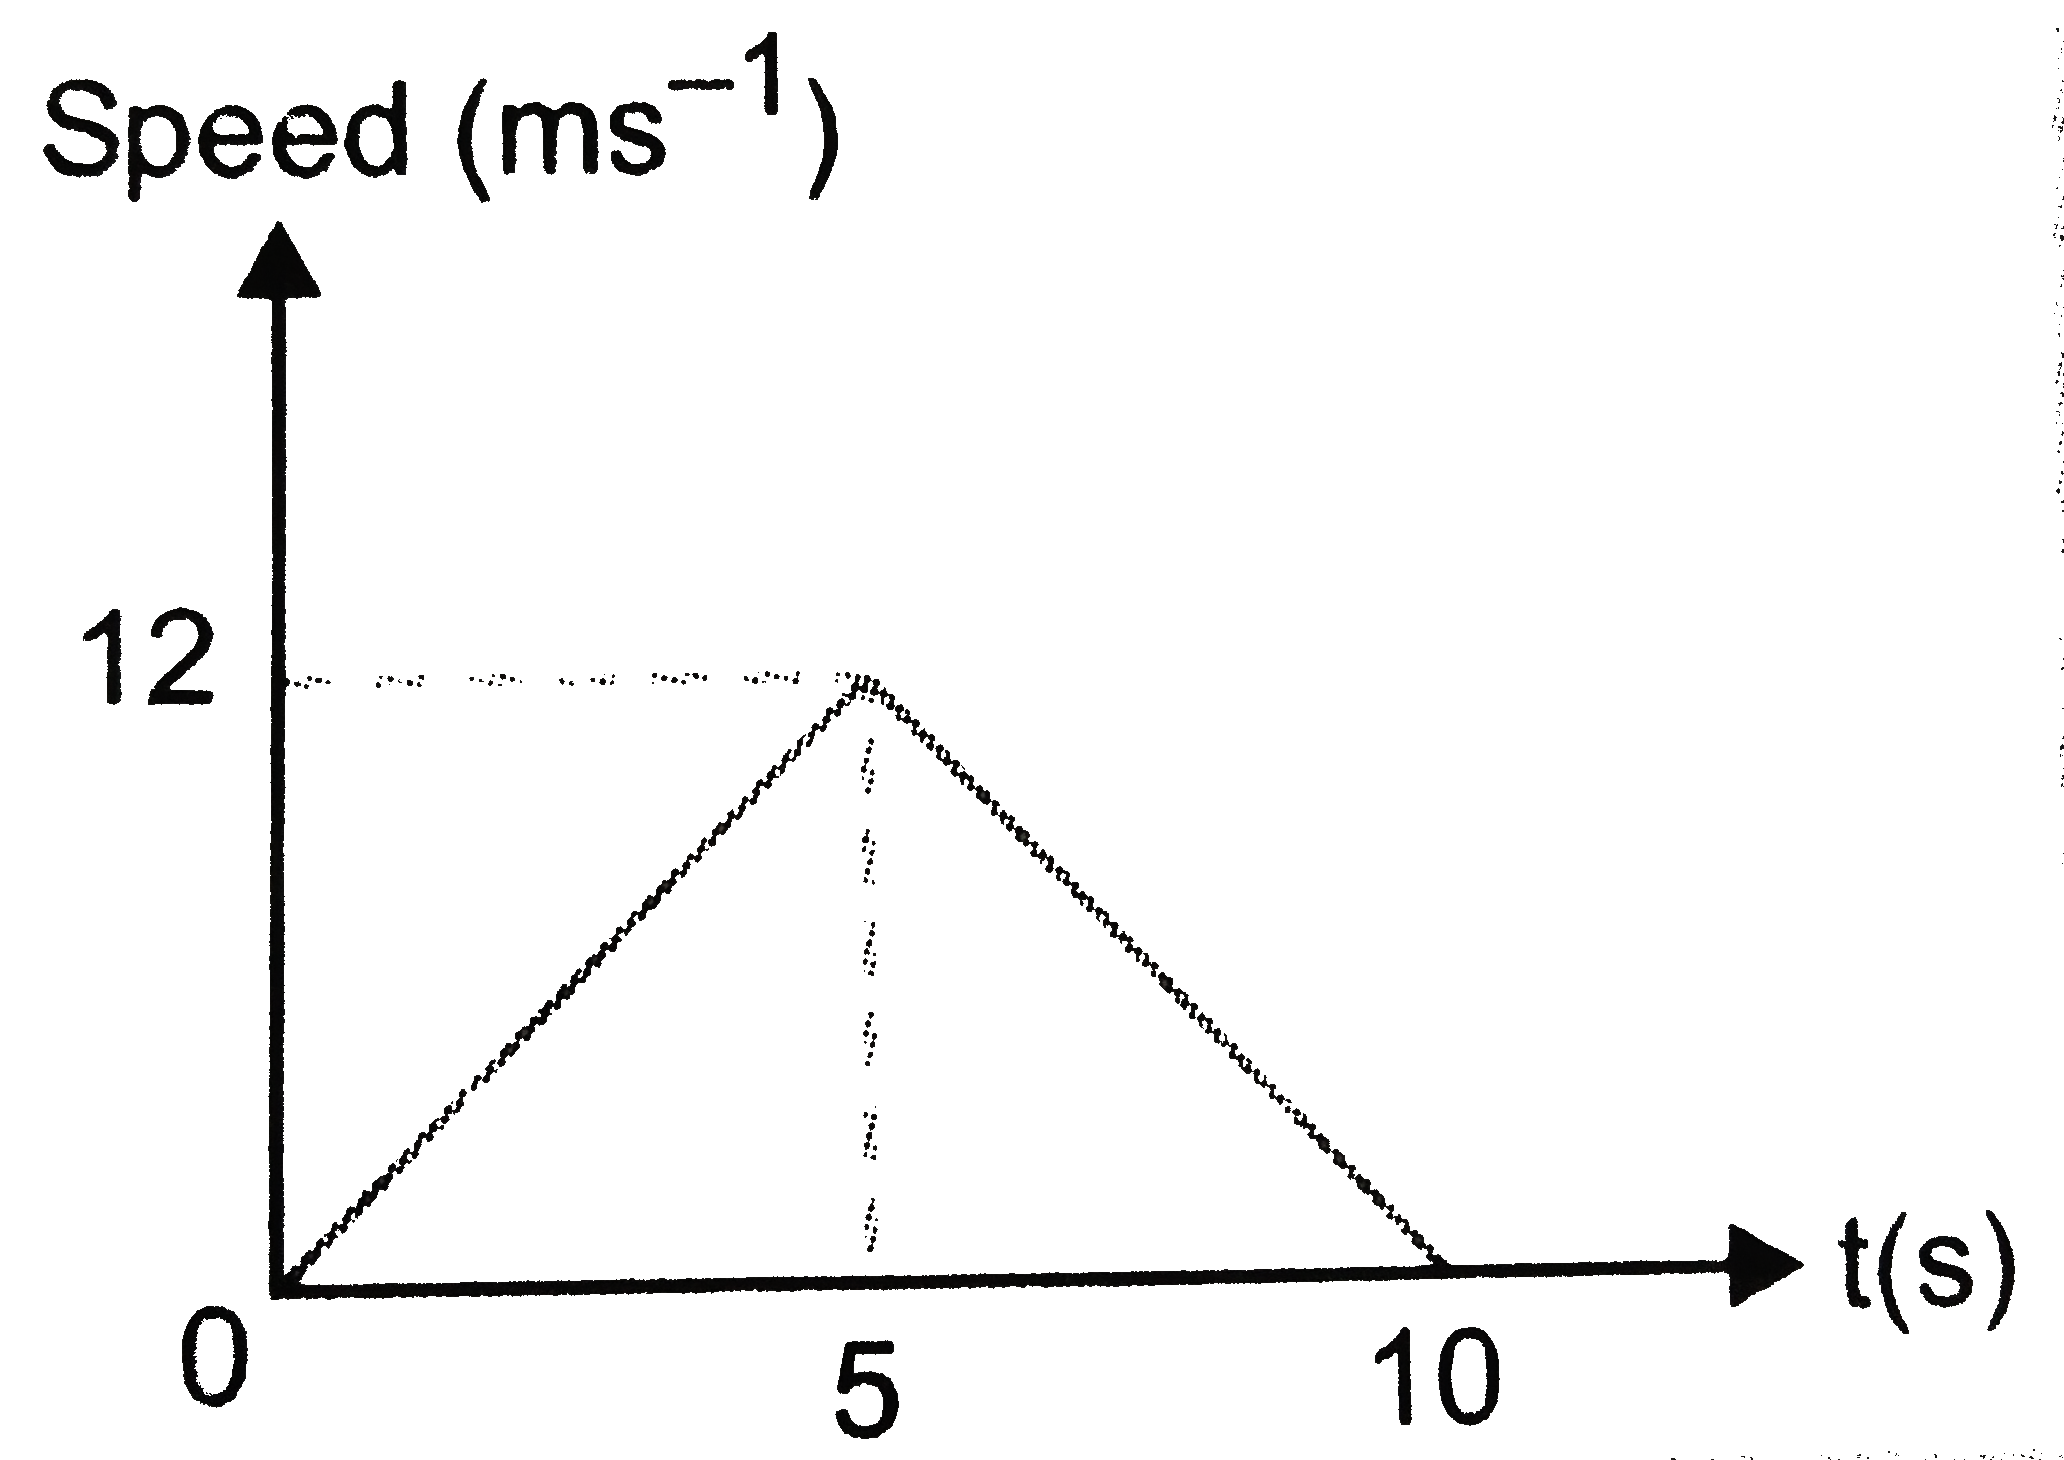
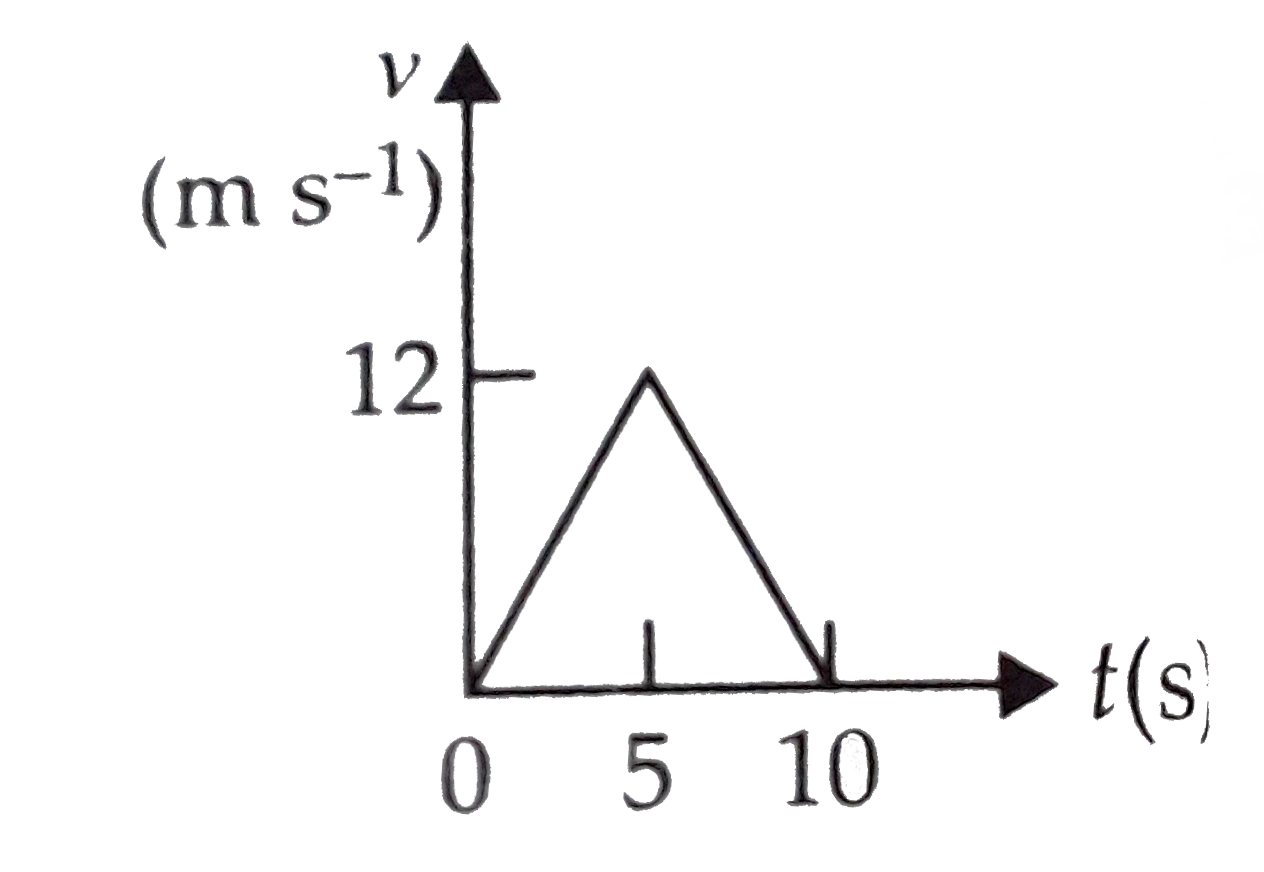
The speed -time graph of a particle moving along a fixed direction id shown ifn Fig. 2 (b) . 31. Fid (i) distance travelled by the particle between 0sec to 10sec (ii) average speed between thid interval (iii) the time when the speed was minimum (iv) the time when the speed was maximum.
 .
.
(i) Distance trvallled by particle in time interval 0 to 10 seconds is
S=area under velocity-time graph ltBrgt 12×(10−0)×(12−0)=60m
(ii) Average speed ,
vav=Totaldistancetravel≤d→taltimetaken=6010=6ms−1 ltbRgt (ii) Speed of particle is minimum at t=0s and t=10s
(iv) Speed of particle is maximum at t=5s.
Topper's Solved these Questions
- KINEMATICSBOOK - PRADEEPCHAPTER - KINEMATICSEXERCISE - 3 Problems for practice
67 Videos
- KINEMATICSBOOK - PRADEEPCHAPTER - KINEMATICSEXERCISE - 4 Problems for practice
45 Videos
- KINEMATICSBOOK - PRADEEPCHAPTER - KINEMATICSEXERCISE - 1 Problems for practice
25 Videos
- GRAVIATIONBOOK - PRADEEPCHAPTER - GRAVIATIONEXERCISE - Assertion-Reason Type Questions
19 Videos
- LAWS OF MOTIONBOOK - PRADEEPCHAPTER - LAWS OF MOTIONEXERCISE - Assertion- Reason Type Questions
17 Videos
Similar Questions
The speed-time graph of a particle moving along a fixed direction is shown in figure. Obtain the distance traversed by the particle between (a)t=0s to 10s(b)t=2s to 6s
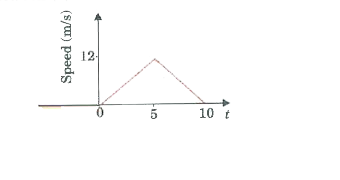
What is the average speed of the particle over the intervals in a and b?
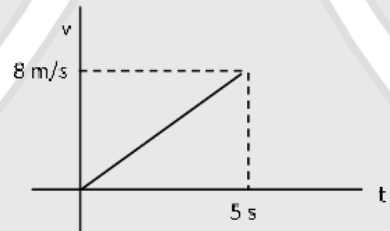
View SolutionSpeed time graph of a particle shown in figure. Find distance travelled by particle in 5second.
View Solution
Knowledge Check
The speed-time graph of a particle moving along a fixed direction is shown in the Fig. 2 (CF) . 15. The distance traversed by the particle between t=2s 6s is .
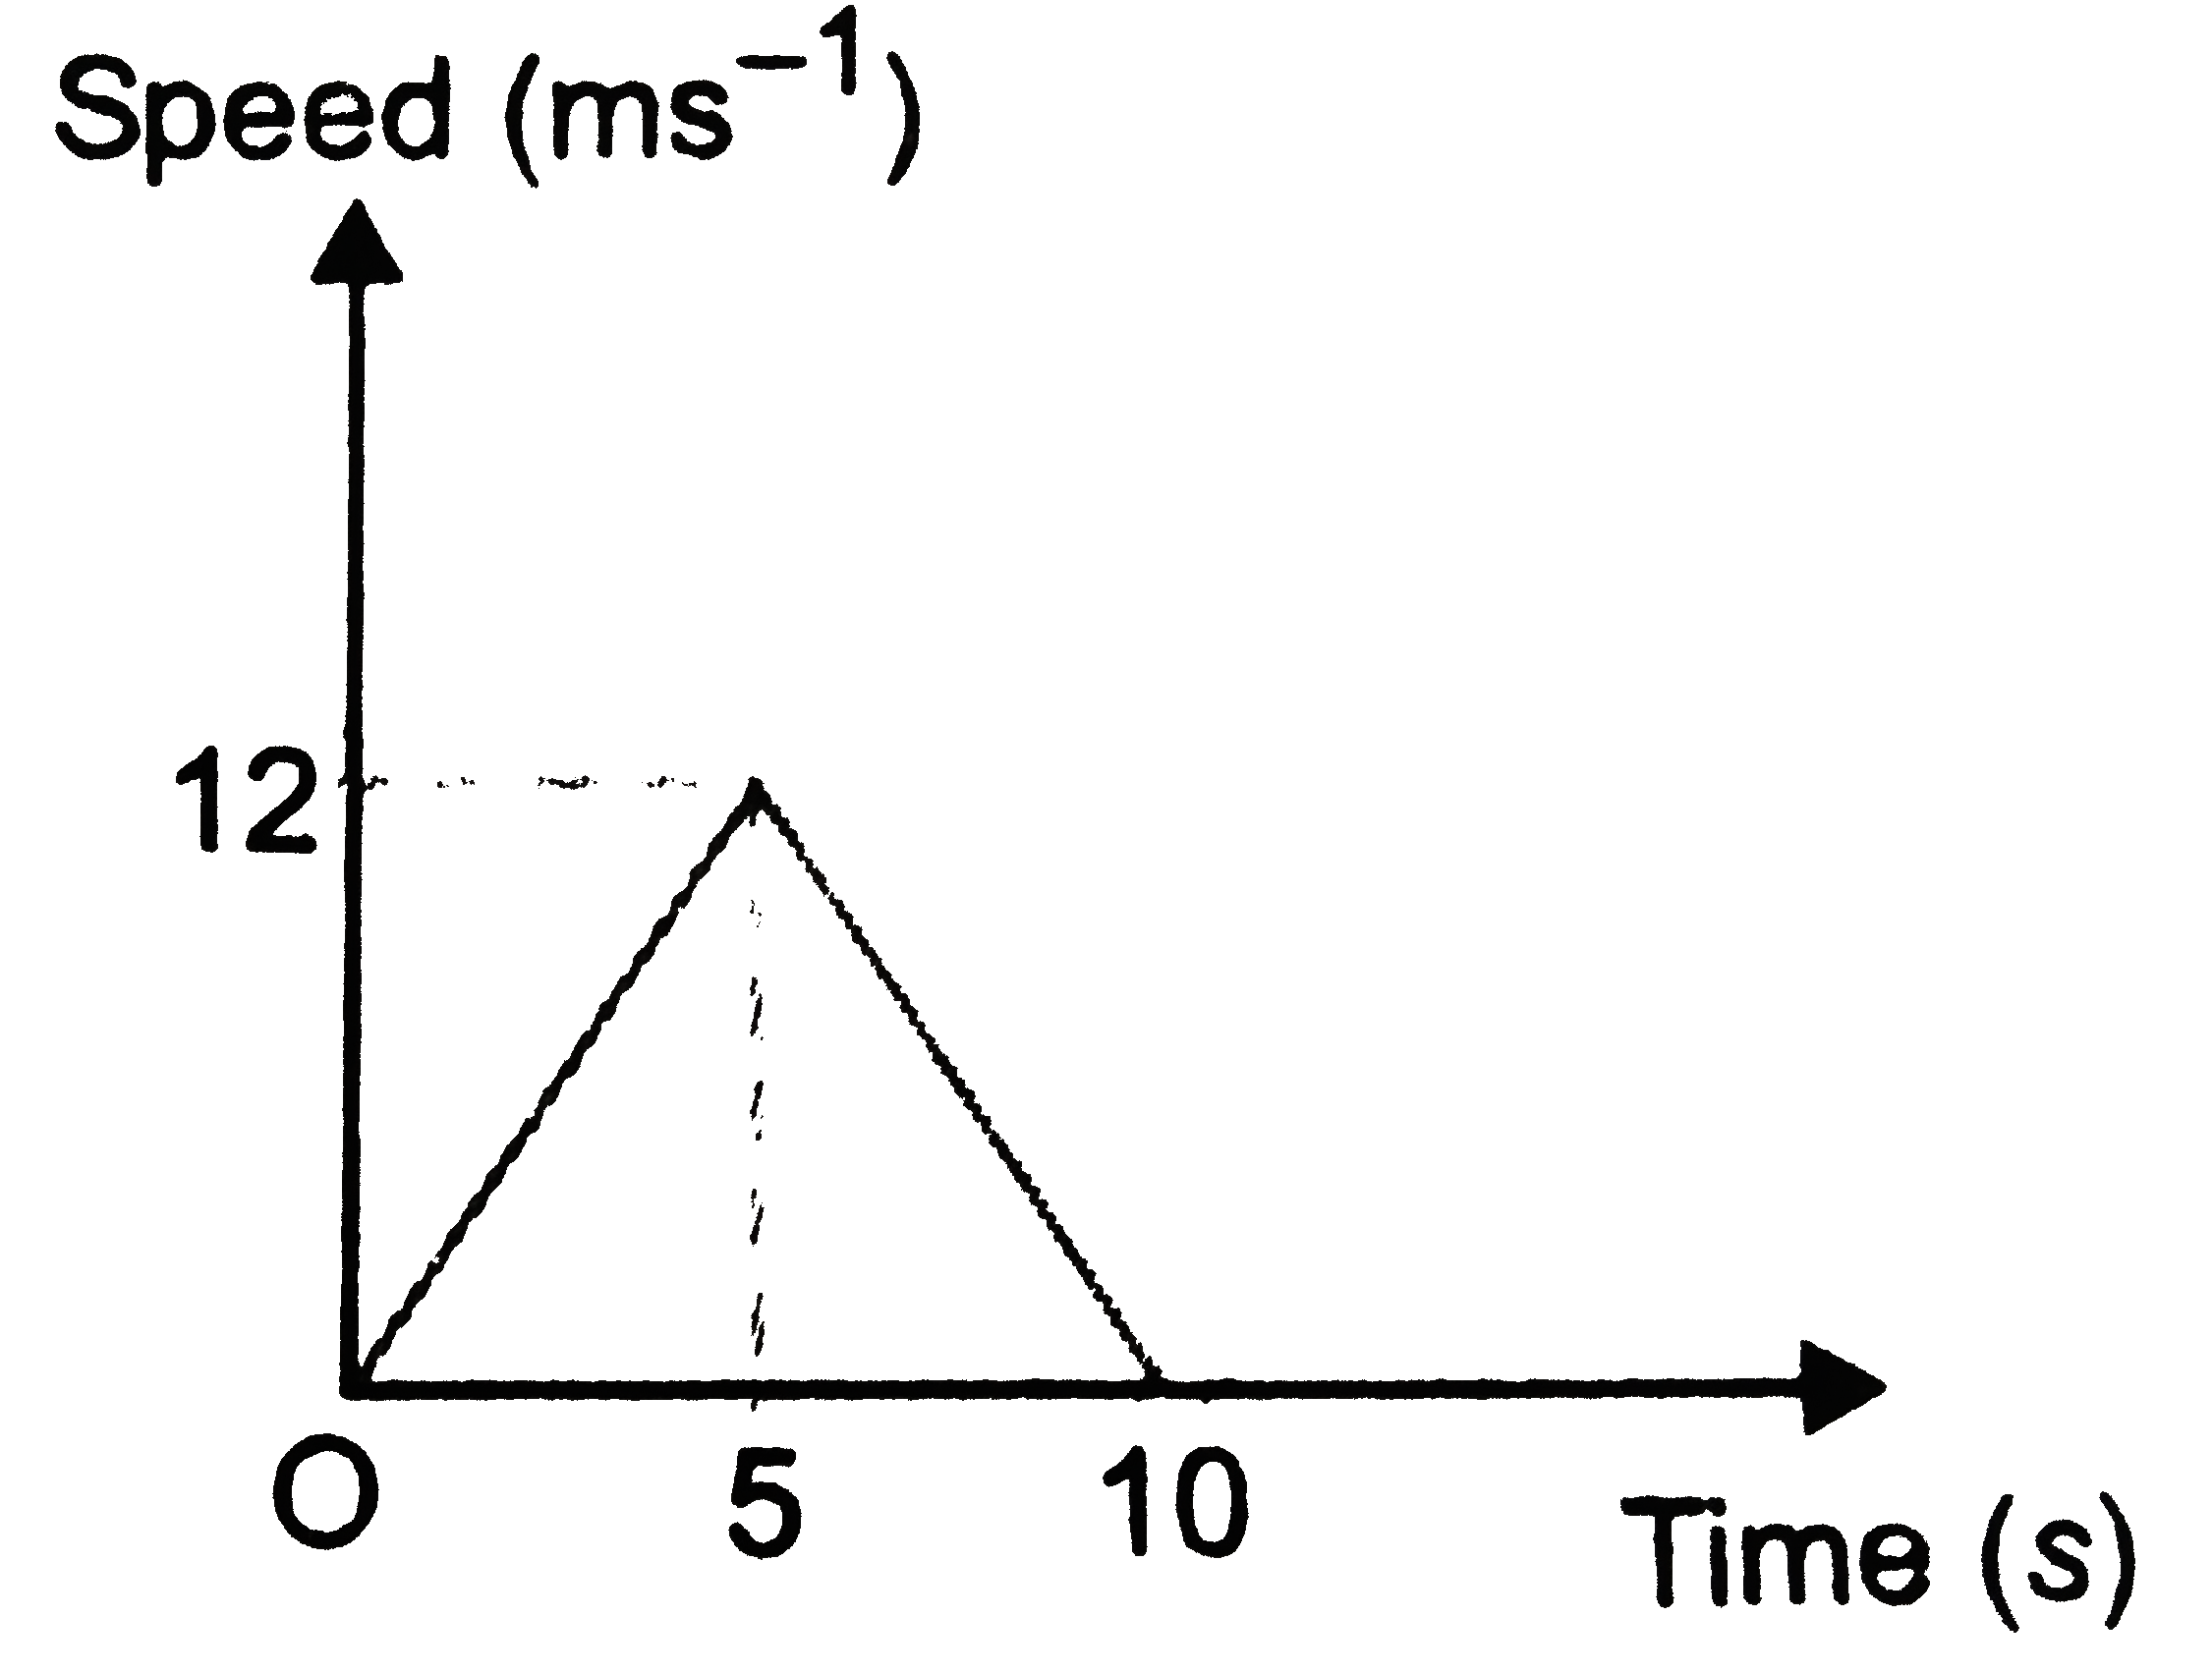 .A26mB36mC46mD56m
The speed-time graph of a particle moving along a fixed direction as shown in the figure. The distance travelled by the particle between t = 0 s to t = 10 s is
 A20 mB40 mC60 mD80 m
The speed-time graph of an object moving in a fixed direction is shown in Figure 2.E4.
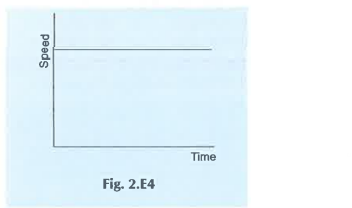
The objectAis at restBmovies with fluctuating speedCmoves with a constant speedDmoves with a nonzero acceleration
The velocity-time graph of a particle moving along a straight line is shown id Fig. 2 (b) . 33. Calculate the distance covered between t=0 to t=10seconds. Also find displacement tn time 0→10seconds.
 .
.
View SolutionThe speed-time graph of an object moving in a fixed direction is shown in figure 2.E3.
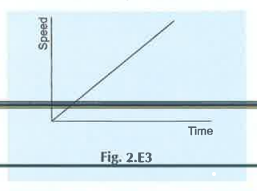
The object
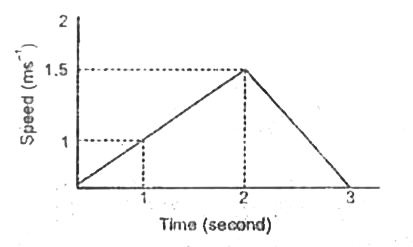
View SolutionThe speed - time graph of a particle moving along a solid curve is shown below. The distance traversed by the particle from t = 0 to t = 3 is
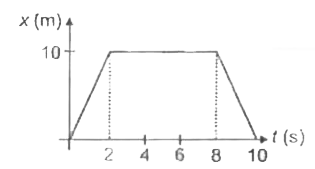
View SolutionThe position - time graph for a particle moving along a straight line is shown in figure. The total distance travelled by it in time t = 0 to t = 10 s is
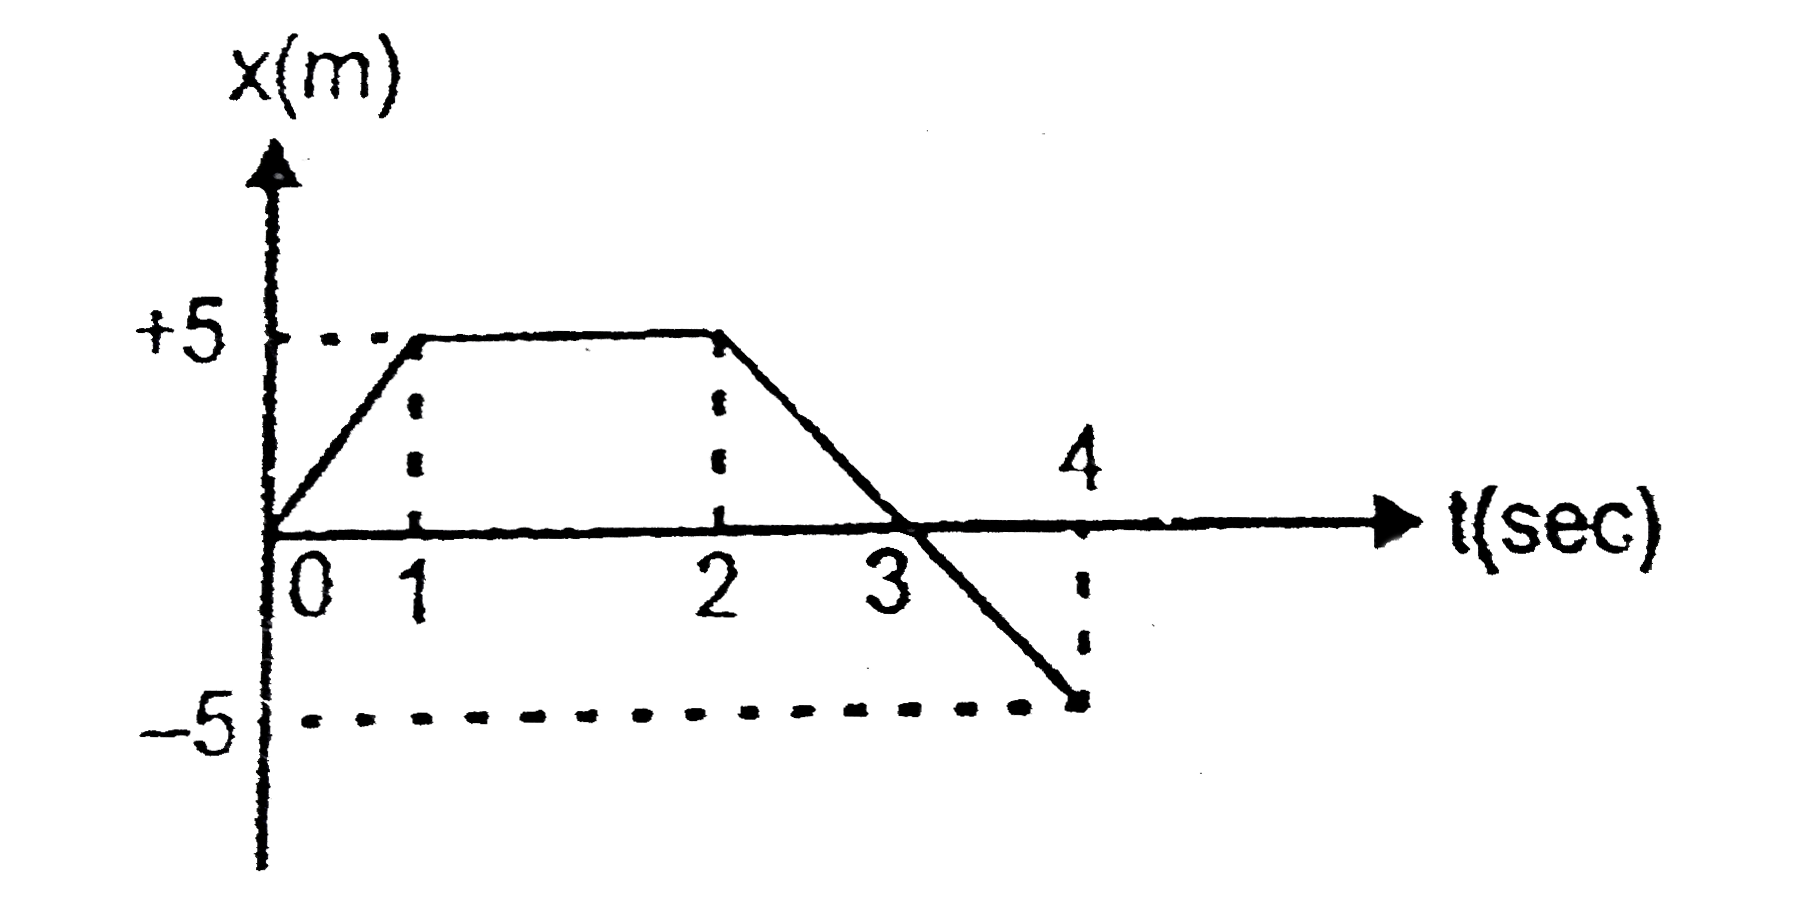
View SolutionPosition-time graph for a particle moving along x− direction is as shown in the figure. Average speed of the particle from t=0 to t=4 is :
View Solution
