The speed-time graph of a particle moving along a fixed direction is shown in the Fig. The distance traversed by the particle between (a) t=0s→10s, (b) t=2s to 6s.
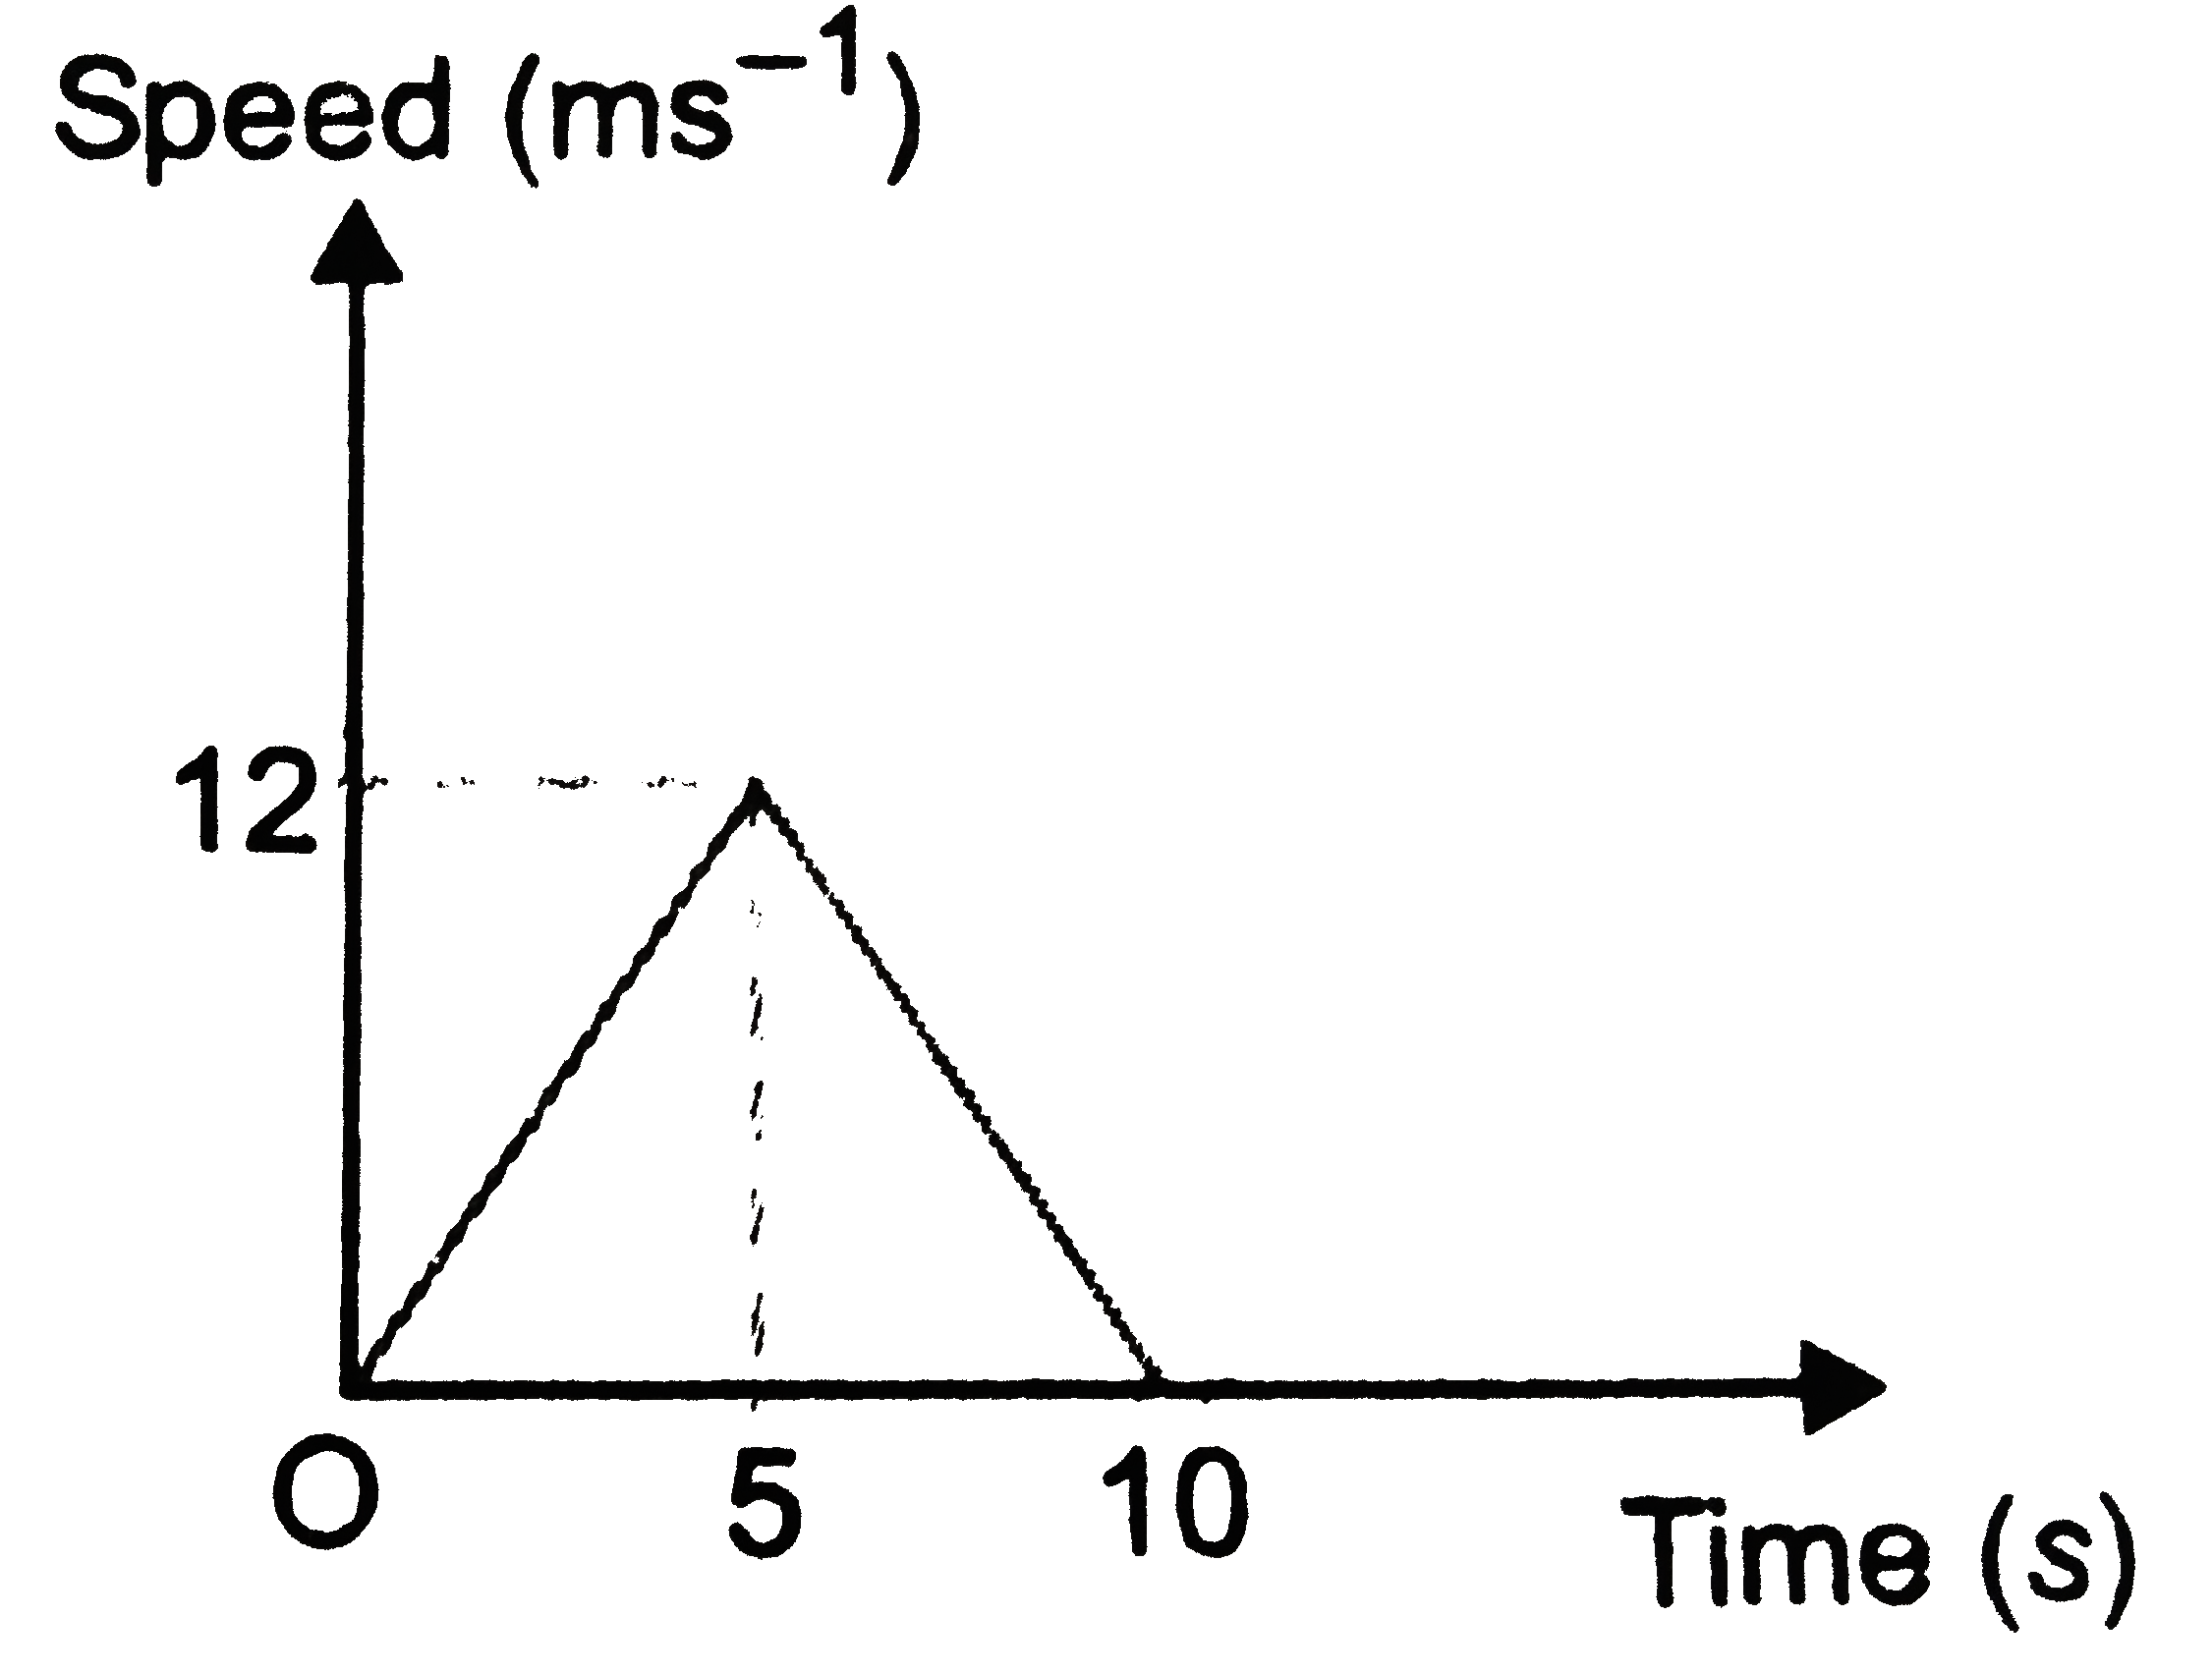 . what is the average speed of the particle over the intervals in (a) and (b)?
(a) Distance travelled by the particle = Area under the given graph
=12×(10−0)×(12−0)=60 m
Average speed =DistanceTime=6010 =6 m/s
(b) Let s1 and s2 be the distances covered by the particle between time t = 2 s to 5 s and t = 5 s to 6 s respectively.
Total distance (s) covered by the particle in time t = 2 s to 6 s
s=s1+s2…(i)
For distance s1:
Let u′ be the velocity of the particle after 2 s and a′ be the acceleration of the particle in t = 0 to t = 5 s.
Since the particle undergoes uniform acceleration in the interval t = 0 to t = 5 s, from first equation of motion, acceleration can be obtained as:
v = u + at
Where, v = Final velocity of the particle
12 = 0 + a′ × 5
d'=125=2.4m/s2
Again, from first equation of motion, we have
v = u + at
= 0 + 2.4 × 2 = 4.8 m/s
Distance travelled by the particle between time 2 s and 5 s i.e., in 3 s
s1=u't+12a't2
=4.8×3+12×2.4×(3)2
=25.2 m ....(ii)
For distance s2:
Let a'' be the acceleration of the particle between time t=5 s and t=10 s.
From first equation of motion,
v = u + at (where v = 0 as the particle finally comes to rest)
0 = 12 + a″ × 5
a''=−125
=−2.4m/s2
Distance travelled by the particle in 1s (i.e., between t = 5 s and t = 6 s)
s2=u''t+12at2
=12×a+12(−2.4)×(1)2
=12-1.2=10.8 m .....(iii)
From equation (i),(ii) and (iii) , we get
s = 25.2 + 10.8 = 36 m
∴ Average speed =364=9 m/s
Topper's Solved these Questions
Similar Questions
The speed-time graph of a particle moving along a fixed direction is shown in figure. Obtain the distance traversed by the particle between (a)t=0s to 10s(b)t=2s to 6s
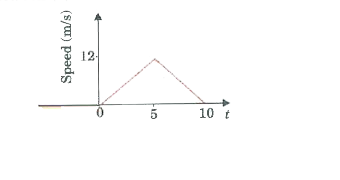
What is the average speed of the particle over the intervals in a and b?View Solutions-t graph of a particle in motion is shown in Fig. Calculate
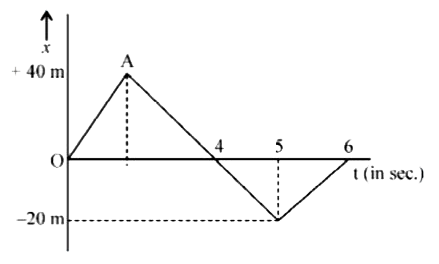
Average speedView Solution
Knowledge Check
- Question 1 - Select One
The speed-time graph of a particle moving along a fixed direction as shown in the figure. The distance travelled by the particle between t = 0 s to t = 10 s is
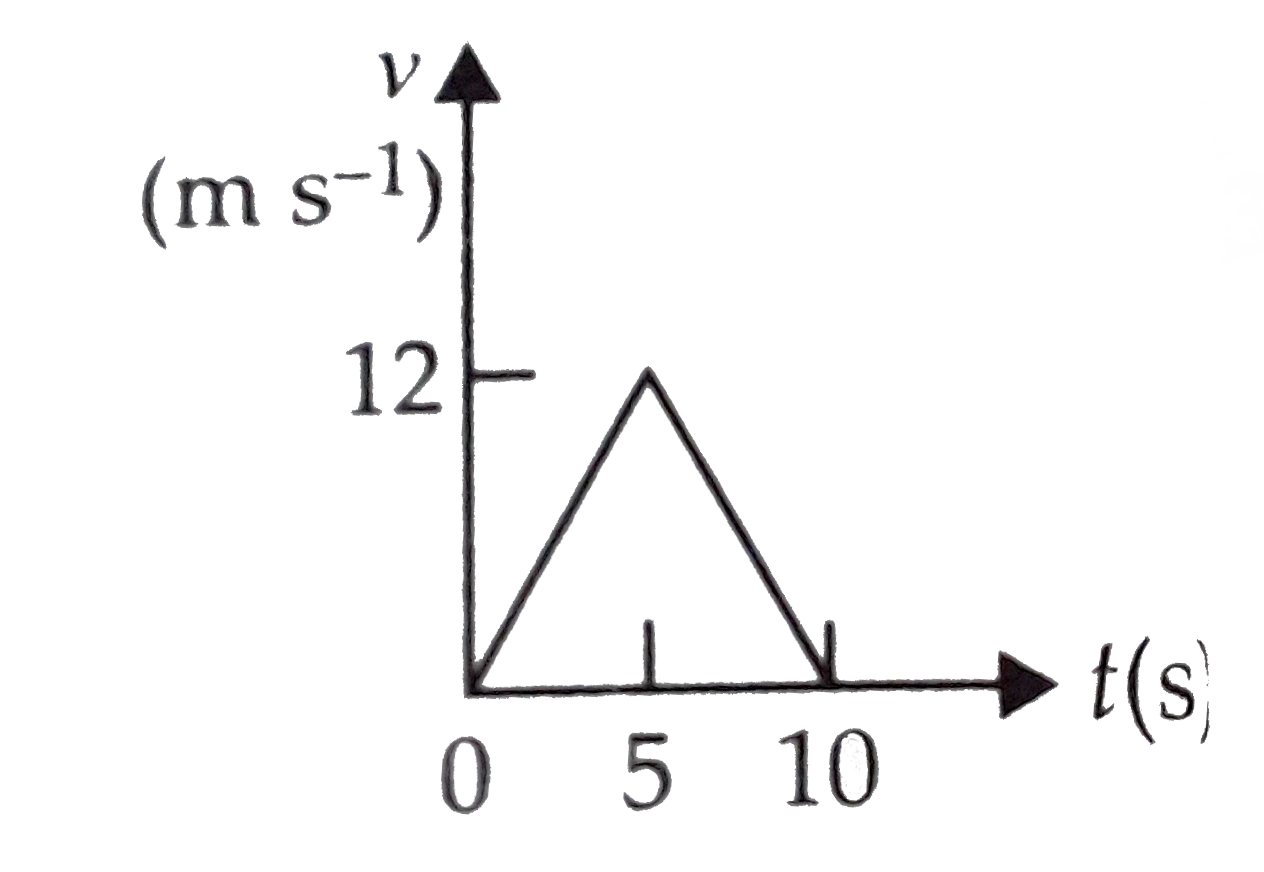 A20 mB40 mC60 mD80 m
 - Question 2 - Select One
The speed-time graph of a particle moving along a fixed direction is shown in the Fig. 2 (CF) . 15. The distance traversed by the particle between t=2s 6s is .
 .A26mB36mC46mD56m
 - Question 3 - Select One
The speed - time graph of a particle moving along a solid curve is shown below. The distance traversed by the particle from t = 0 to t = 3 is
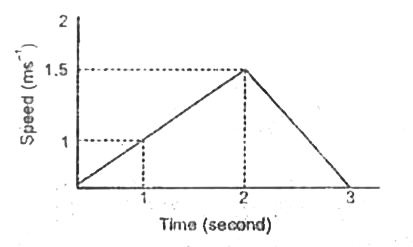 A92mB94mC103mD105m
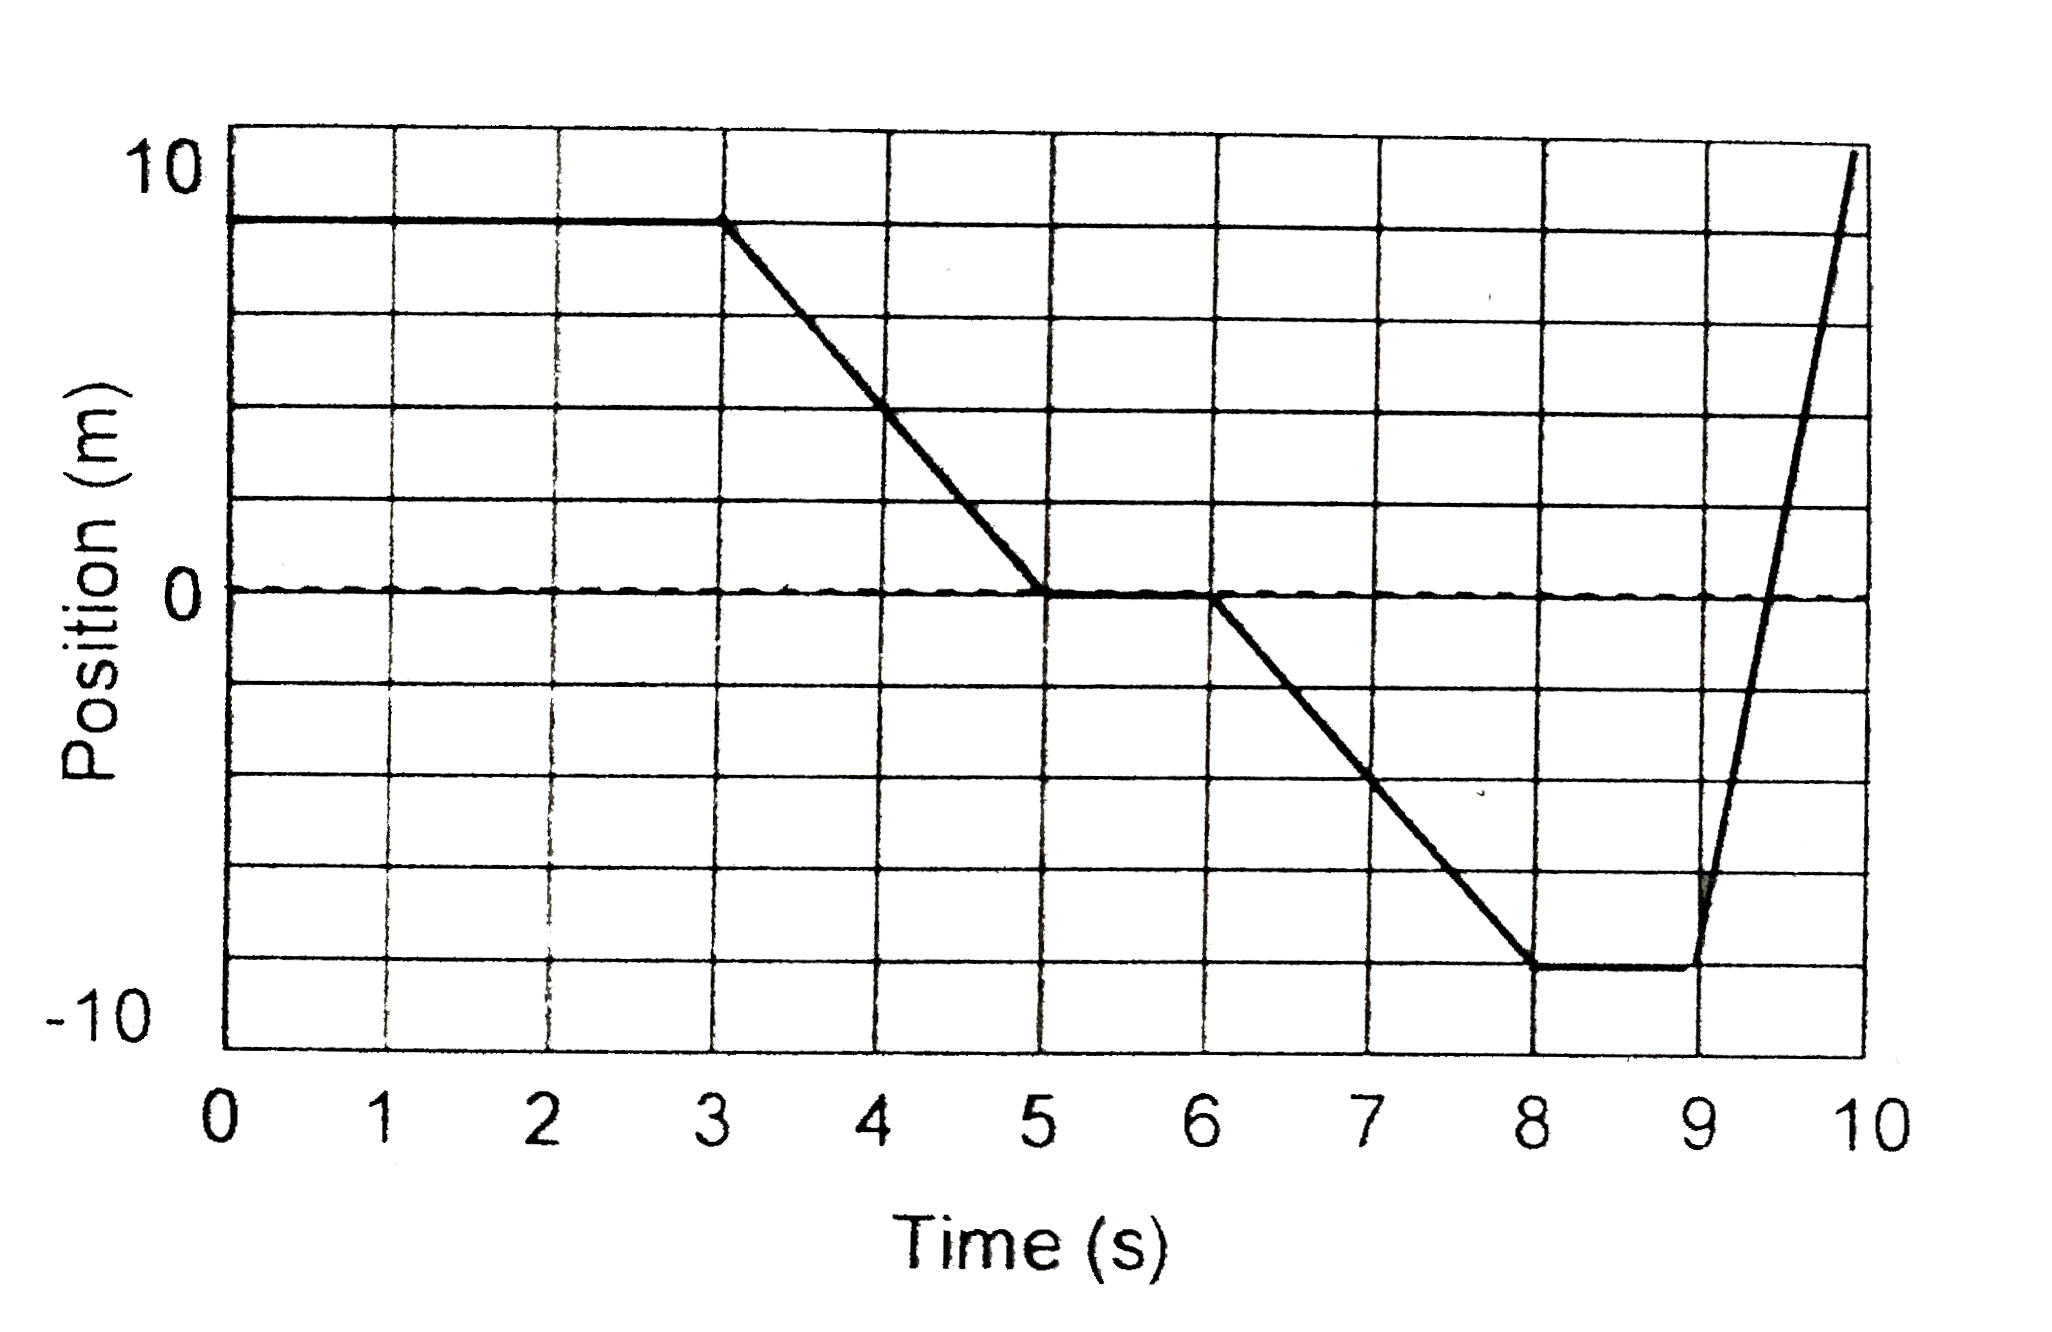
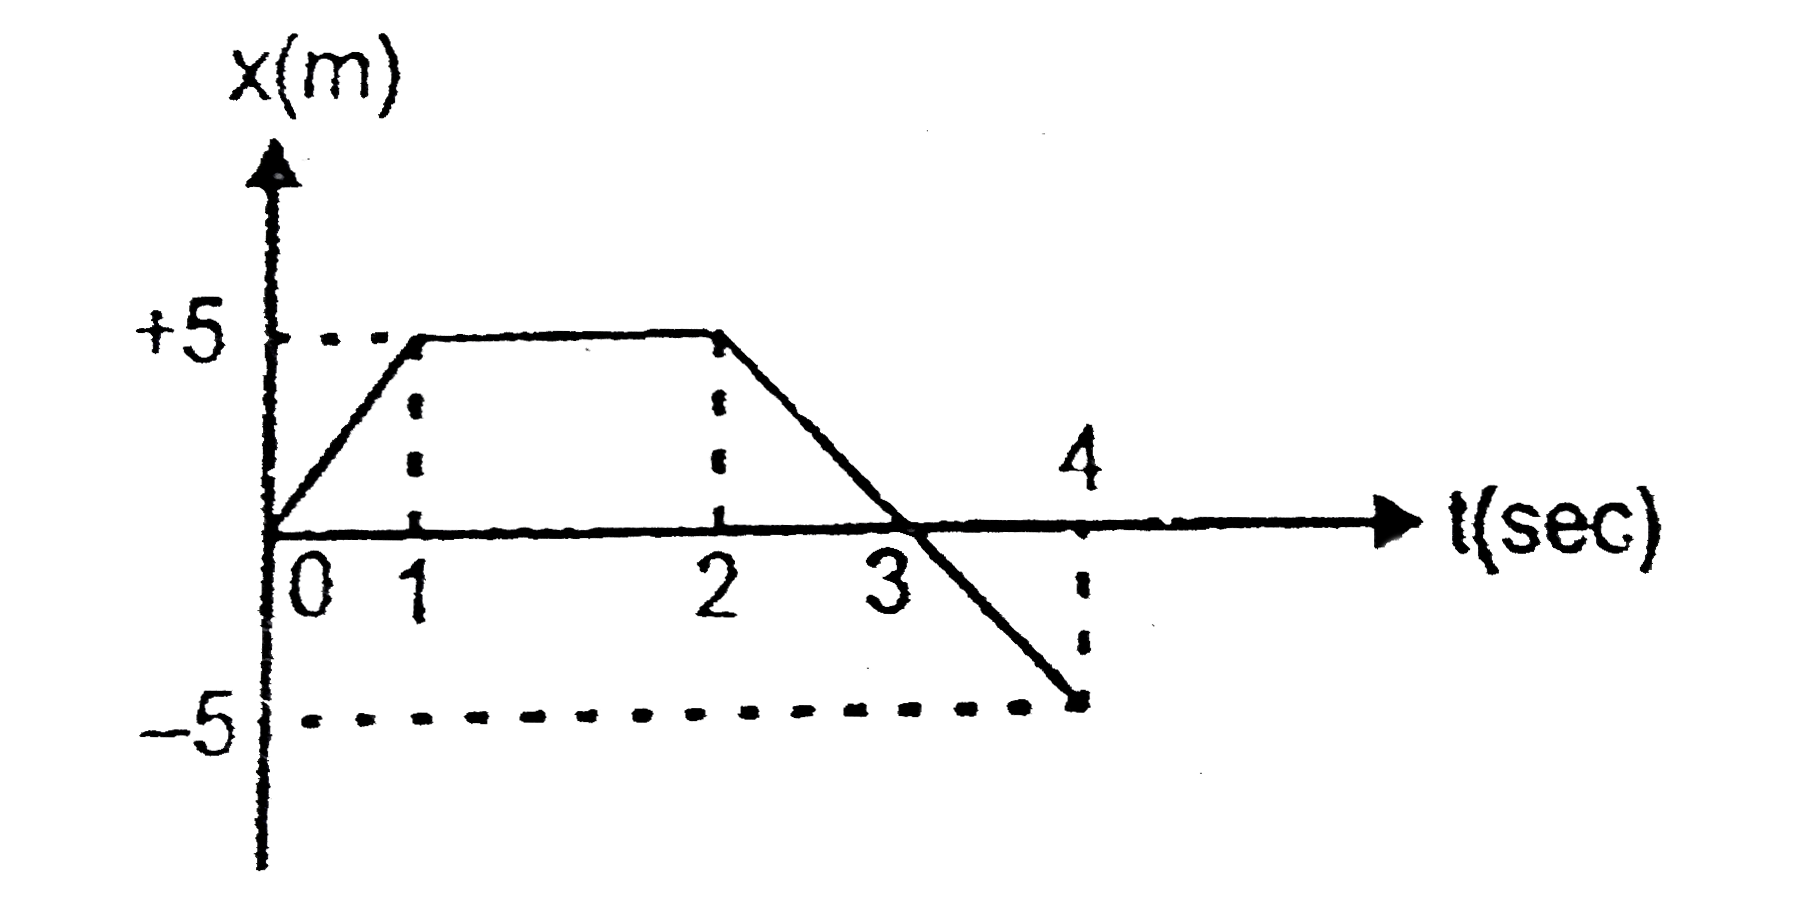
The position versus time graph of a particle moving along a straight line is shown. What is the total distance travelled by the particle from t=0s to t=10s?View SolutionPosition-time graph for a particle moving along x− direction is as shown in the figure. Average speed of the particle from t=0 to t=4 is :
 View Solution
The position - time graph for a particle moving along a straight line is shown in figure. The total distance travelled by it in time t = 0 to t = 10 s is
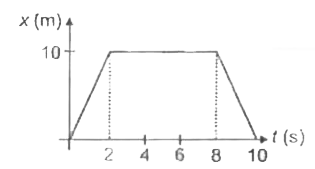 View Solution
The x-t graph of a particle moving along a straight line is shown in figure
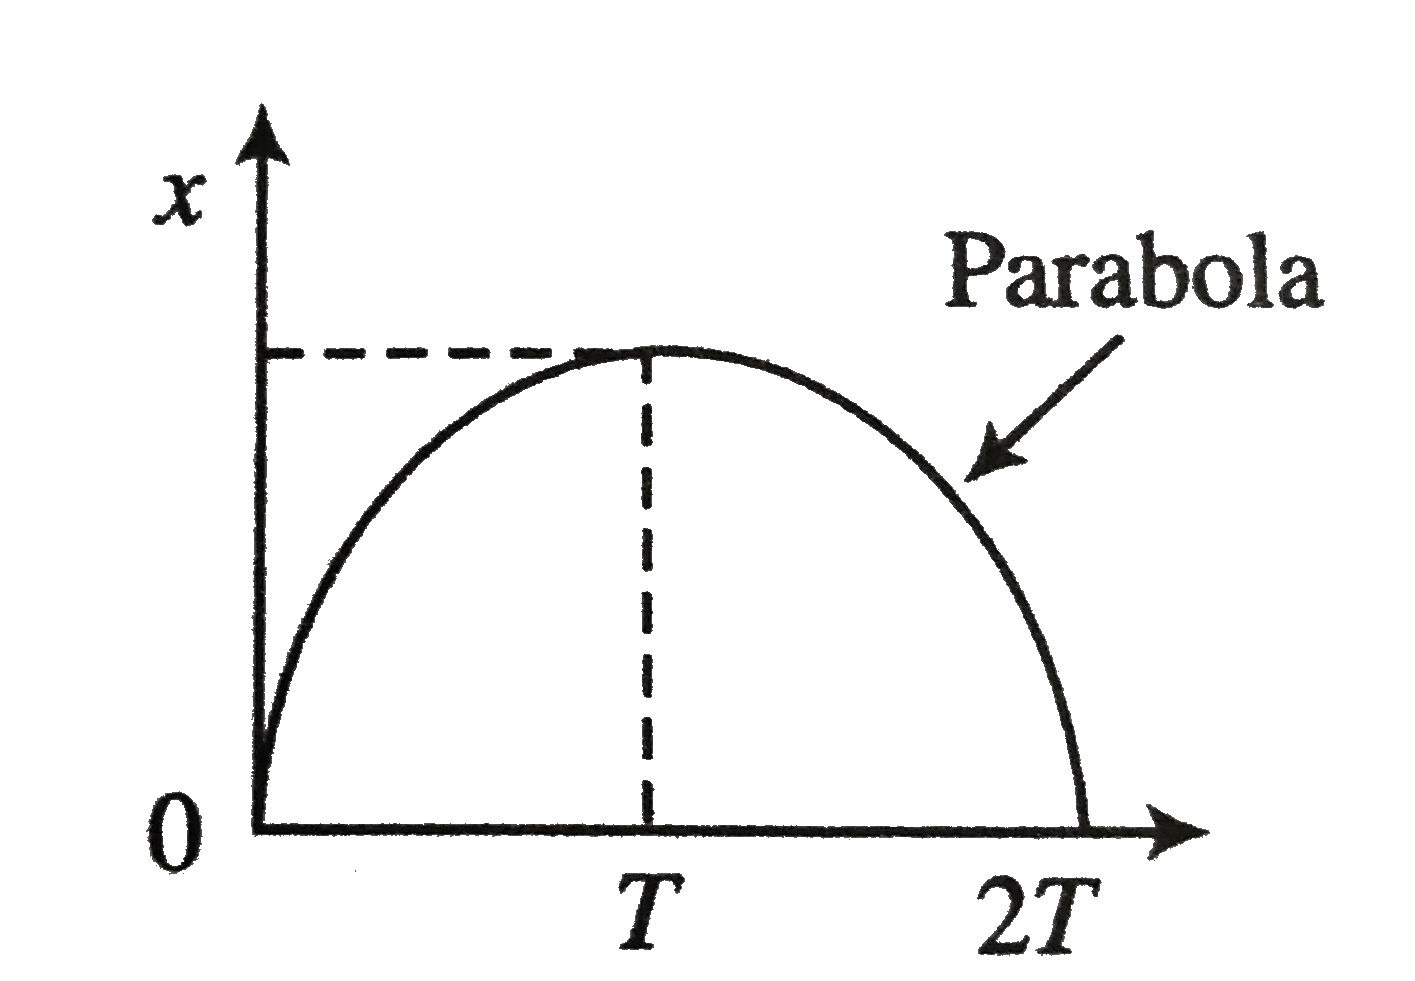
The speed-time graph of the particle is correctly shown byView SolutionThe velovity-time graph of a particle moving in a straitht line is shown in . The acceleration of the particle at t=9s is.
 .View Solution

