The steady flow of (non-viscous) liquid. Which of the two figure is incorrect?why?
To determine which of the two figures representing the steady flow of a non-viscous liquid is incorrect, we can follow these steps:
Step 1: Understand the Principle of Continuity
For a non-viscous liquid flowing steadily, the principle of continuity states that the product of the cross-sectional area (A) and the velocity (V) at any two points in the flow must remain constant. This can be expressed mathematically as:
A1V1=A2V2
Step 2: Analyze the Areas and Velocities
Let’s denote the areas of the two sections as A1 and A2, and their corresponding velocities as V1 and V2. If A1>A2, then according to the continuity equation:
A1A2>1
This implies that:
V2>V1
So, the velocity of the liquid must increase as it moves from a larger area to a smaller area.
Step 3: Apply Bernoulli's Equation
Bernoulli's equation states that for an incompressible, non-viscous fluid, the total mechanical energy along a streamline is constant. It can be expressed as:
P+12ρV2+ρgh=constant
Where P is the pressure, ρ is the density, V is the velocity, g is the acceleration due to gravity, and h is the height.
Step 4: Compare Pressures and Heights
From Bernoulli's equation, we can derive the relationship between pressures and heights at two points:
P1+12ρV21+ρgh1=P2+12ρV22+ρgh2
Rearranging gives:
P1−P2=12ρ(V22−V21)+ρg(h2−h1)
Since V2>V1, it follows that V22>V21, leading to P1−P2>0. This implies:
P1>P2
And since pressure is directly proportional to height in a fluid column:
h1>h2
Step 5: Identify the Incorrect Figure
From our analysis, we conclude that for the correct representation:
- The height h1 (where the pressure is higher) must be greater than h2 (where the pressure is lower).
If one of the figures shows h1<h2, that figure is incorrect. Conversely, if the other figure shows h1>h2, that figure is correct.
Conclusion
Thus, if figure A shows h1<h2, it is the incorrect figure, while figure B, which shows h1>h2, is correct.
Final Answer
Figure A is incorrect because it violates the principle that higher pressure corresponds to a higher height in a non-viscous liquid flow.
---
For a non-viscous liquid flowing steadily, the principle of continuity states that the product of the cross-sectional area (A) and the velocity (V) at any two points in the flow must remain constant. This can be expressed mathematically as:
A1V1=A2V2
Let’s denote the areas of the two sections as A1 and A2, and their corresponding velocities as V1 and V2. If A1>A2, then according to the continuity equation:
A1A2>1
This implies that:
V2>V1
So, the velocity of the liquid must increase as it moves from a larger area to a smaller area.
Bernoulli's equation states that for an incompressible, non-viscous fluid, the total mechanical energy along a streamline is constant. It can be expressed as:
P+12ρV2+ρgh=constant
Where P is the pressure, ρ is the density, V is the velocity, g is the acceleration due to gravity, and h is the height.
From Bernoulli's equation, we can derive the relationship between pressures and heights at two points:
P1+12ρV21+ρgh1=P2+12ρV22+ρgh2
Rearranging gives:
P1−P2=12ρ(V22−V21)+ρg(h2−h1)
Since V2>V1, it follows that V22>V21, leading to P1−P2>0. This implies:
P1>P2
And since pressure is directly proportional to height in a fluid column:
h1>h2
From our analysis, we conclude that for the correct representation:
- The height h1 (where the pressure is higher) must be greater than h2 (where the pressure is lower).
Thus, if figure A shows h1<h2, it is the incorrect figure, while figure B, which shows h1>h2, is correct.
Figure A is incorrect because it violates the principle that higher pressure corresponds to a higher height in a non-viscous liquid flow.
Topper's Solved these Questions
- MECHANICAL PROPERTIES OF FLUIDSBOOK - NCERT ENGLISHCHAPTER - MECHANICAL PROPERTIES OF FLUIDSEXERCISE - EXERCISE
31 Videos
- LAWS OF MOTION BOOK - NCERT ENGLISHCHAPTER - LAWS OF MOTION EXERCISE - EXERCISE
40 Videos
- MECHANICAL PROPERTIES OF SOLIDSBOOK - NCERT ENGLISHCHAPTER - MECHANICAL PROPERTIES OF SOLIDSEXERCISE - EXERCISE
21 Videos
Similar Questions
A spherical ball is dropped in a long column of viscous liquid. Which of the following graphs represent the variation of
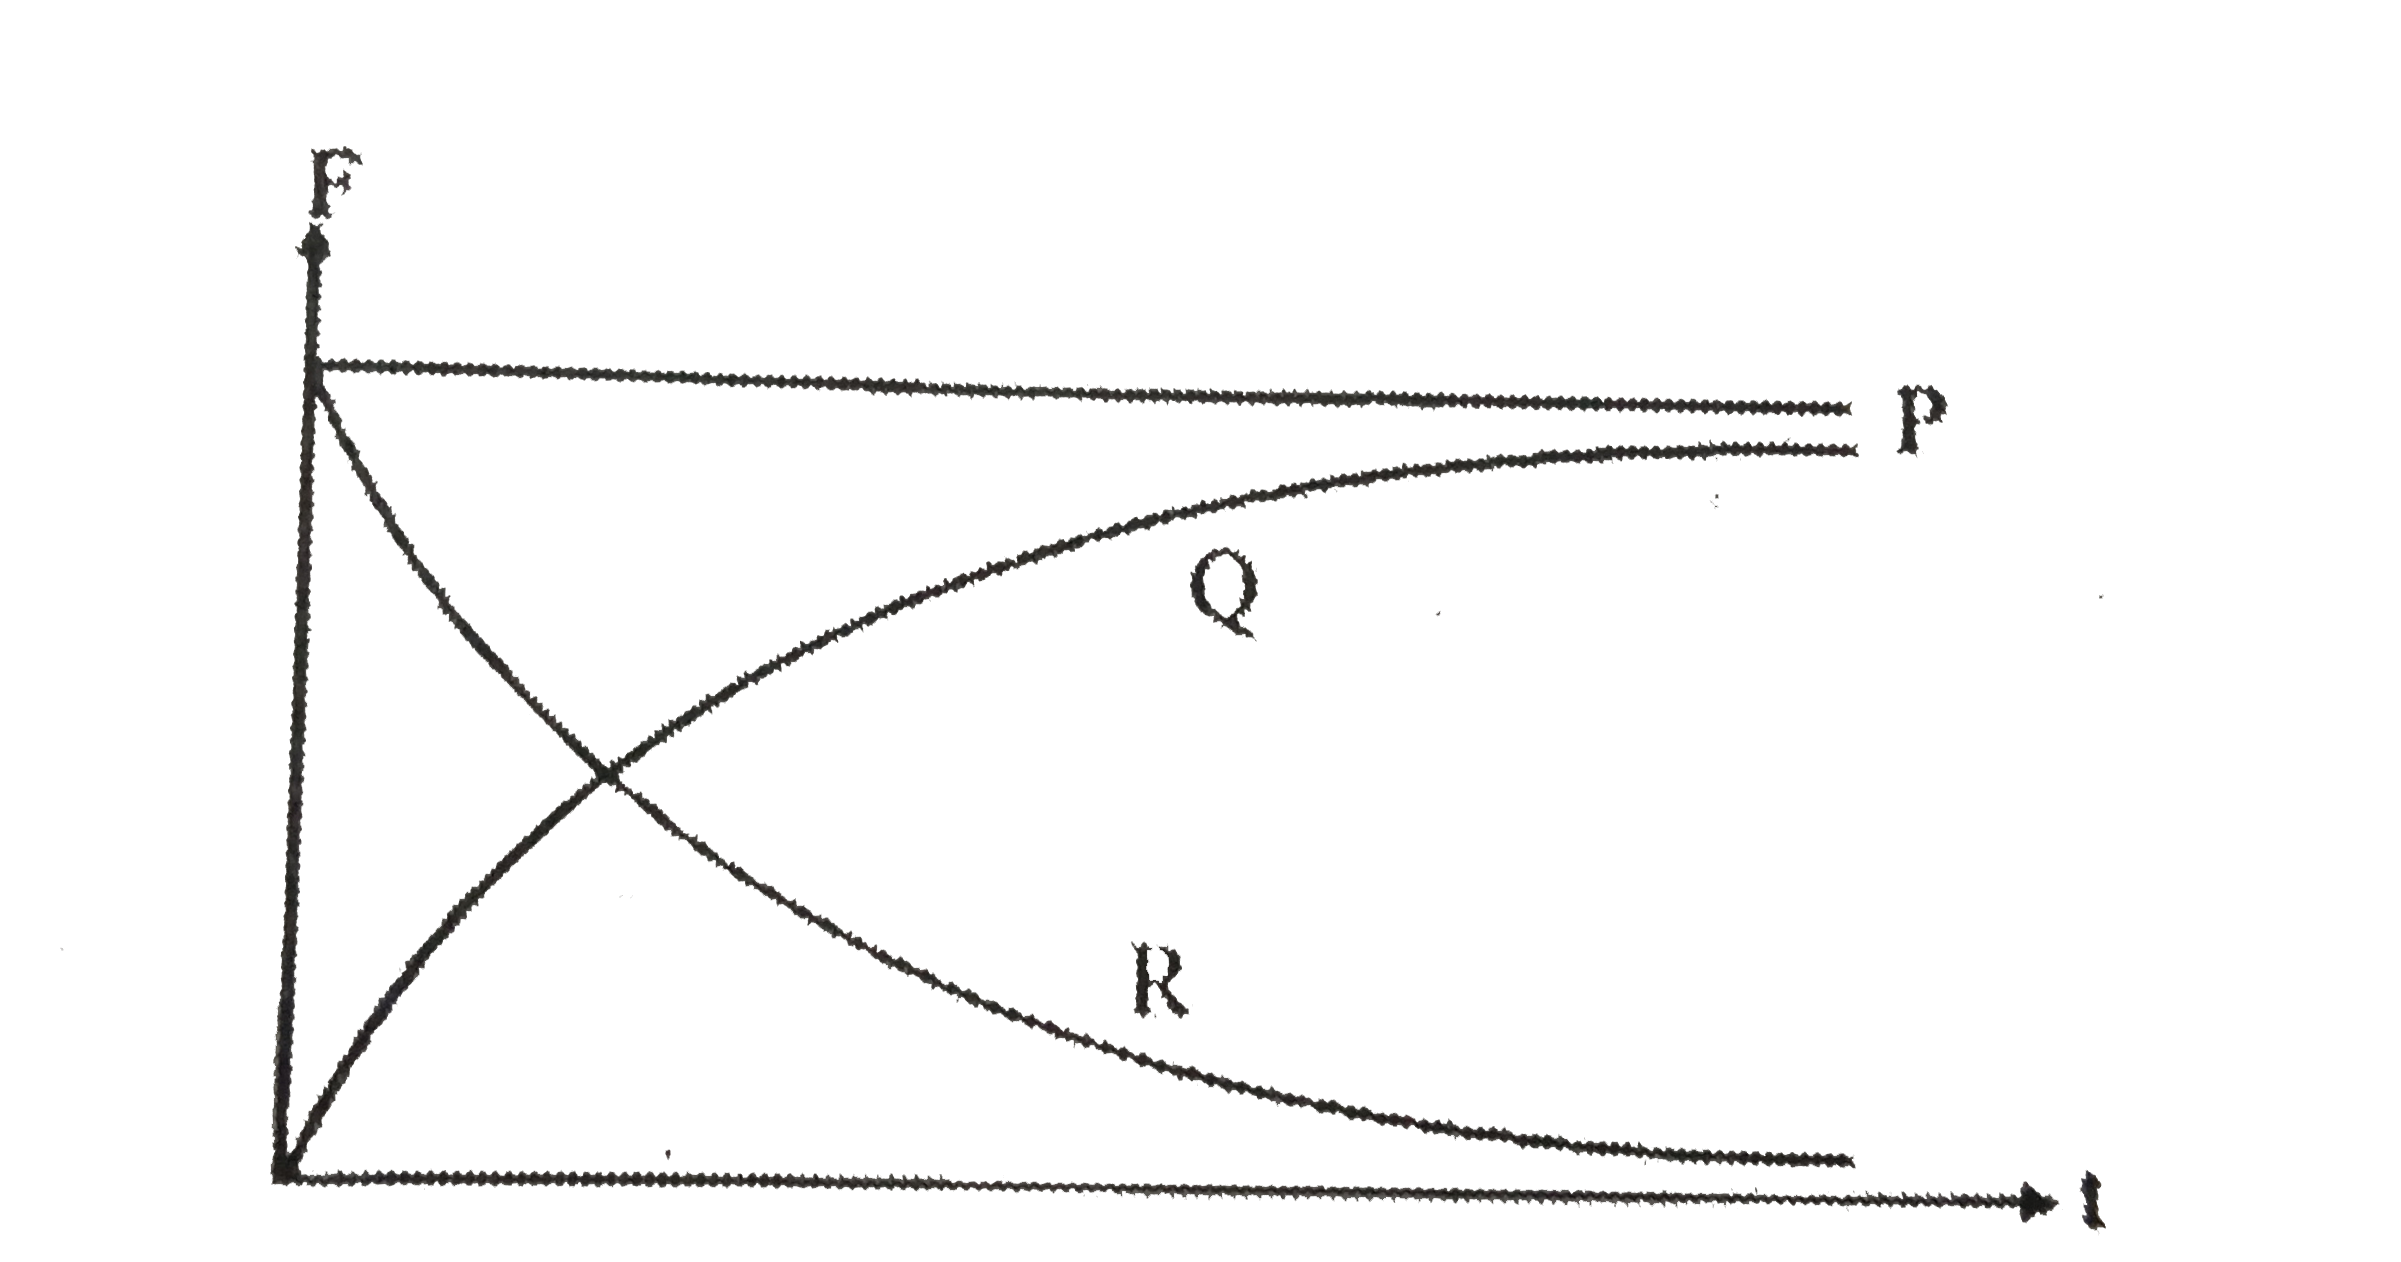
(l) gravitational force with time
(ii) viscous force with time
(iii) net force acting on the ball with time
View Solution_E01_122_Q01.png)
A spherical ball is dropped in a long column of viscous liquid. Which of the following graphs represents the variation of-
(i). Gravitaional force with time
(ii). Viscous force with time
(iii). Net force acting on the ball with time
View Solution
Knowledge Check
Given figure demonstrates the translocation of organic solutes according to pressure flow hypothesis.
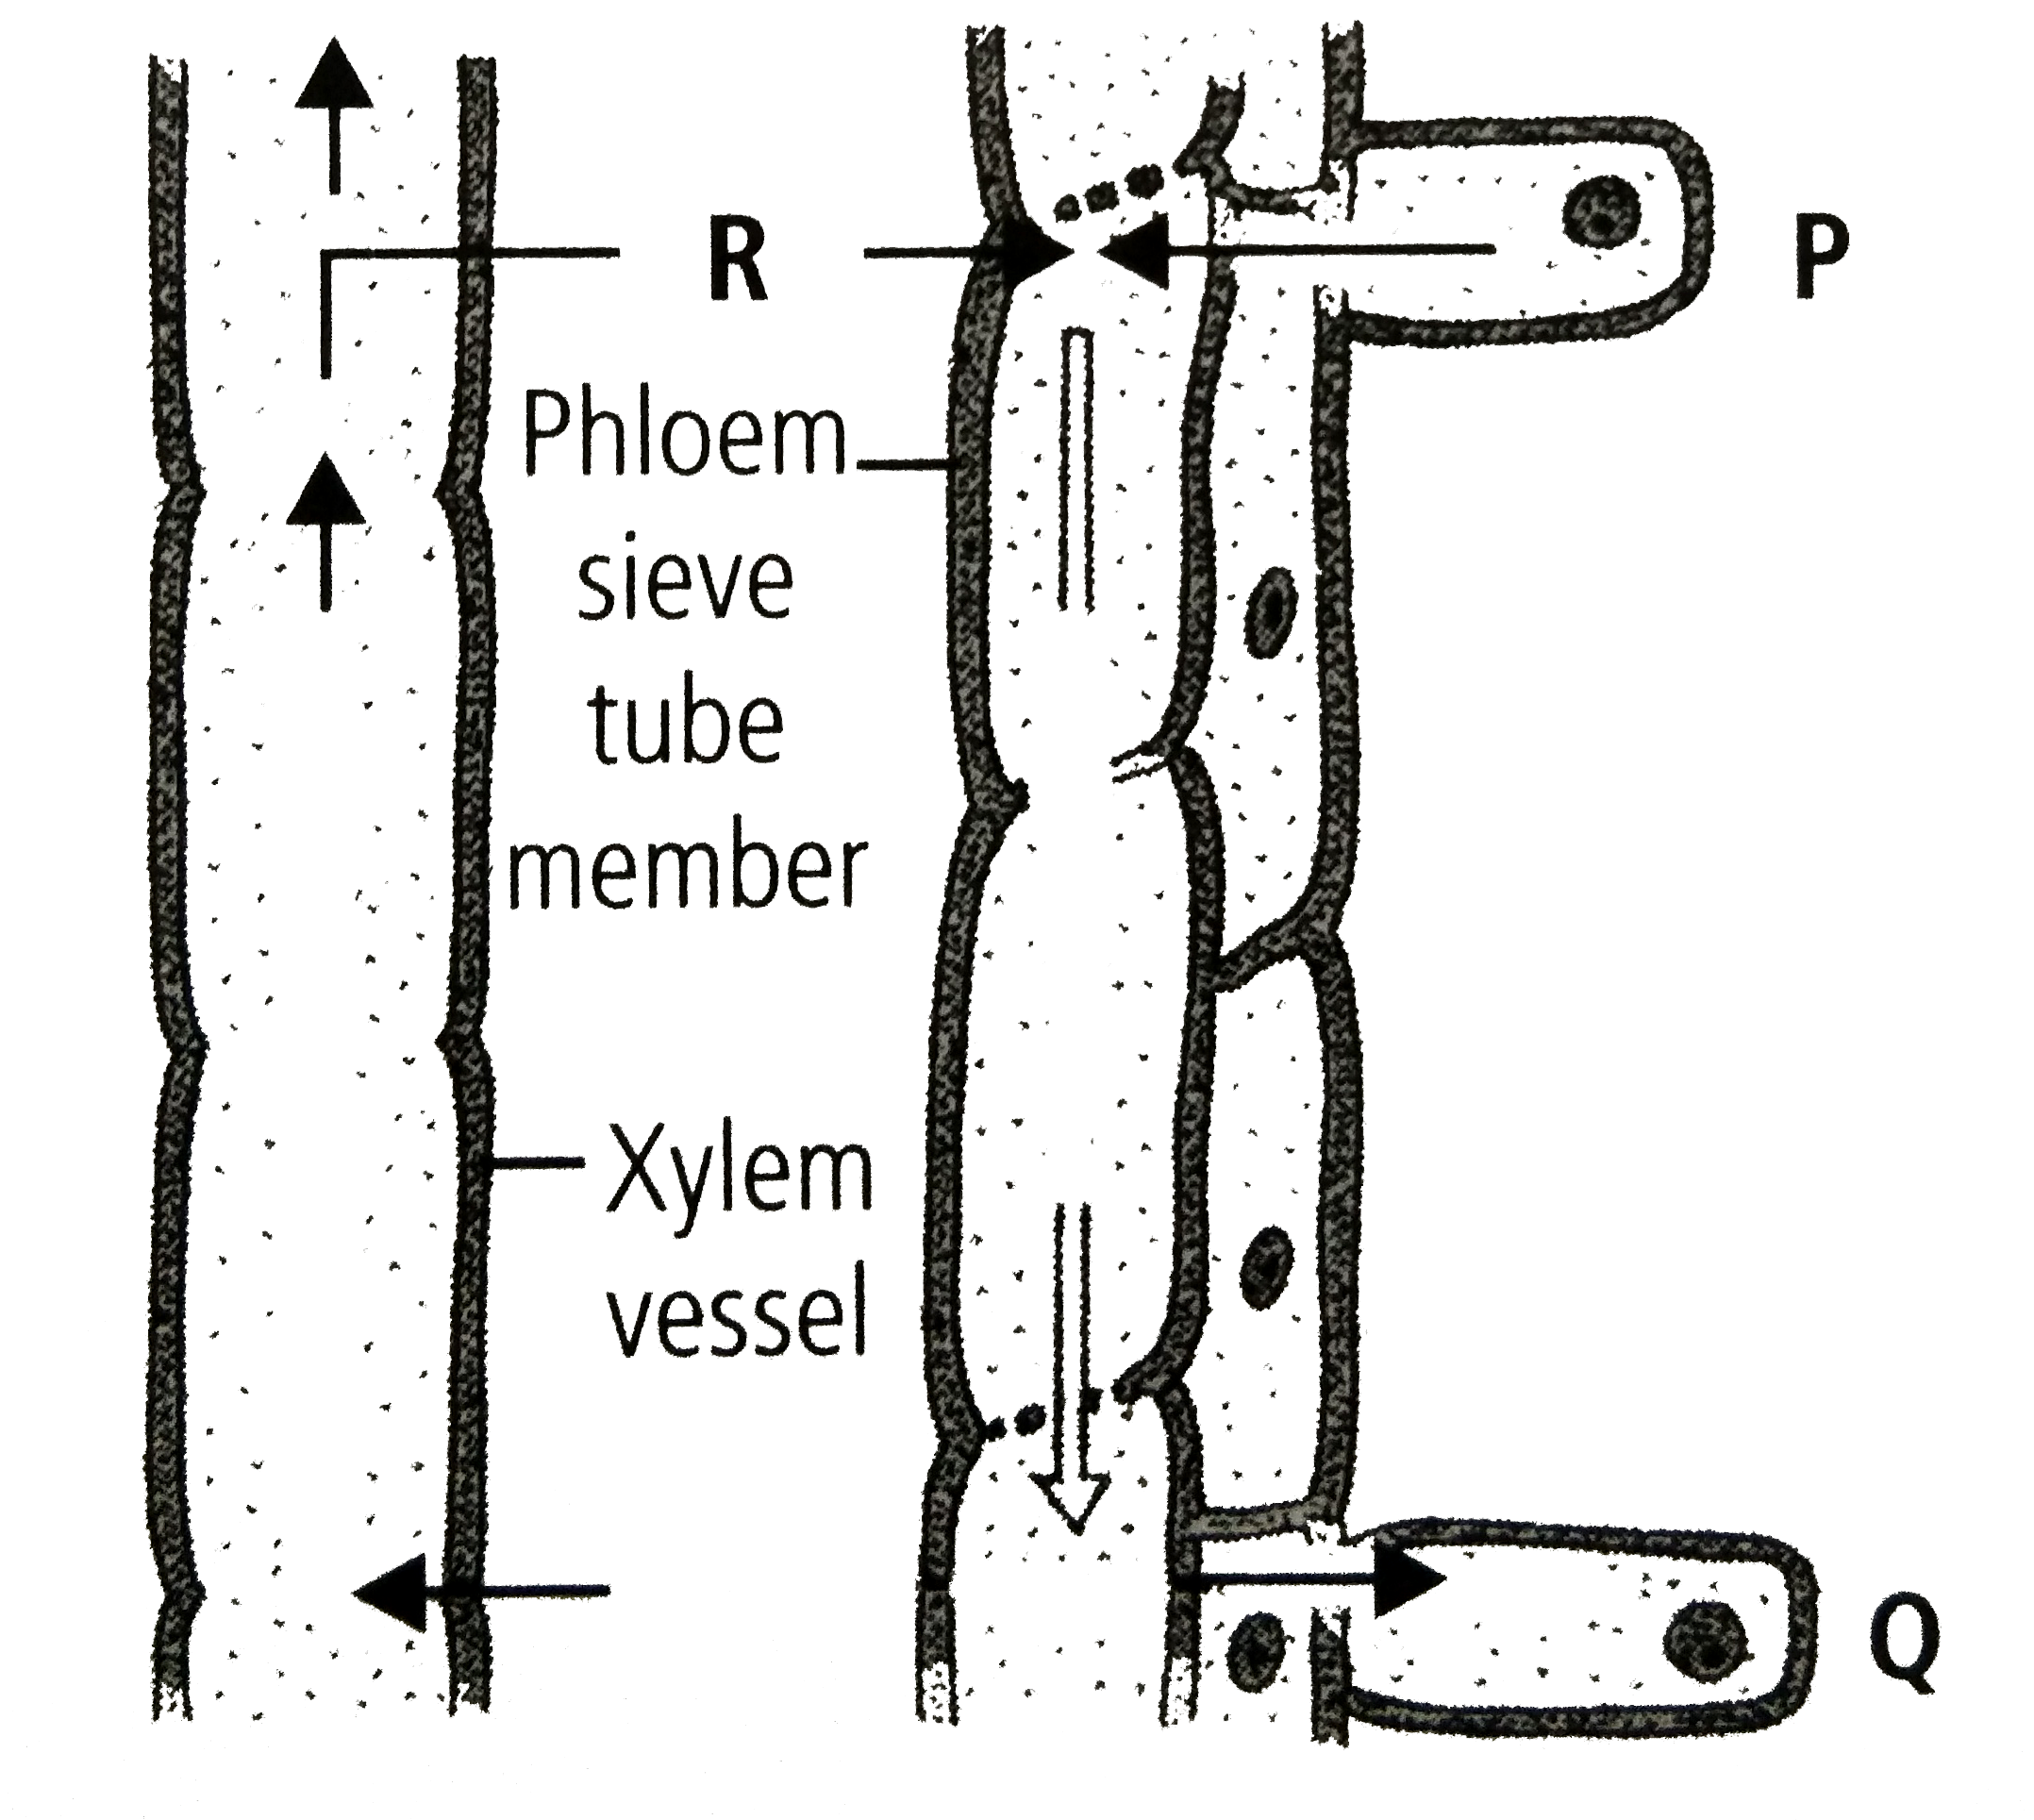
Which out of the following statements is incorrect regarding this?AA continuous high osmotic concentration is maintained in region P, which loads a sieve tube element by passively transporting solute molecules into it,BR shows the movement of H2O into sieve tube elements from nearby xylem vessels by osmosisCTranslocation of organic solutes takes place from region P with high turgor pressure to region Q with low turgor pressureDIn region Q material is either consumed or is converted into insoluble storage forms resulting in decreased osmotic pressure.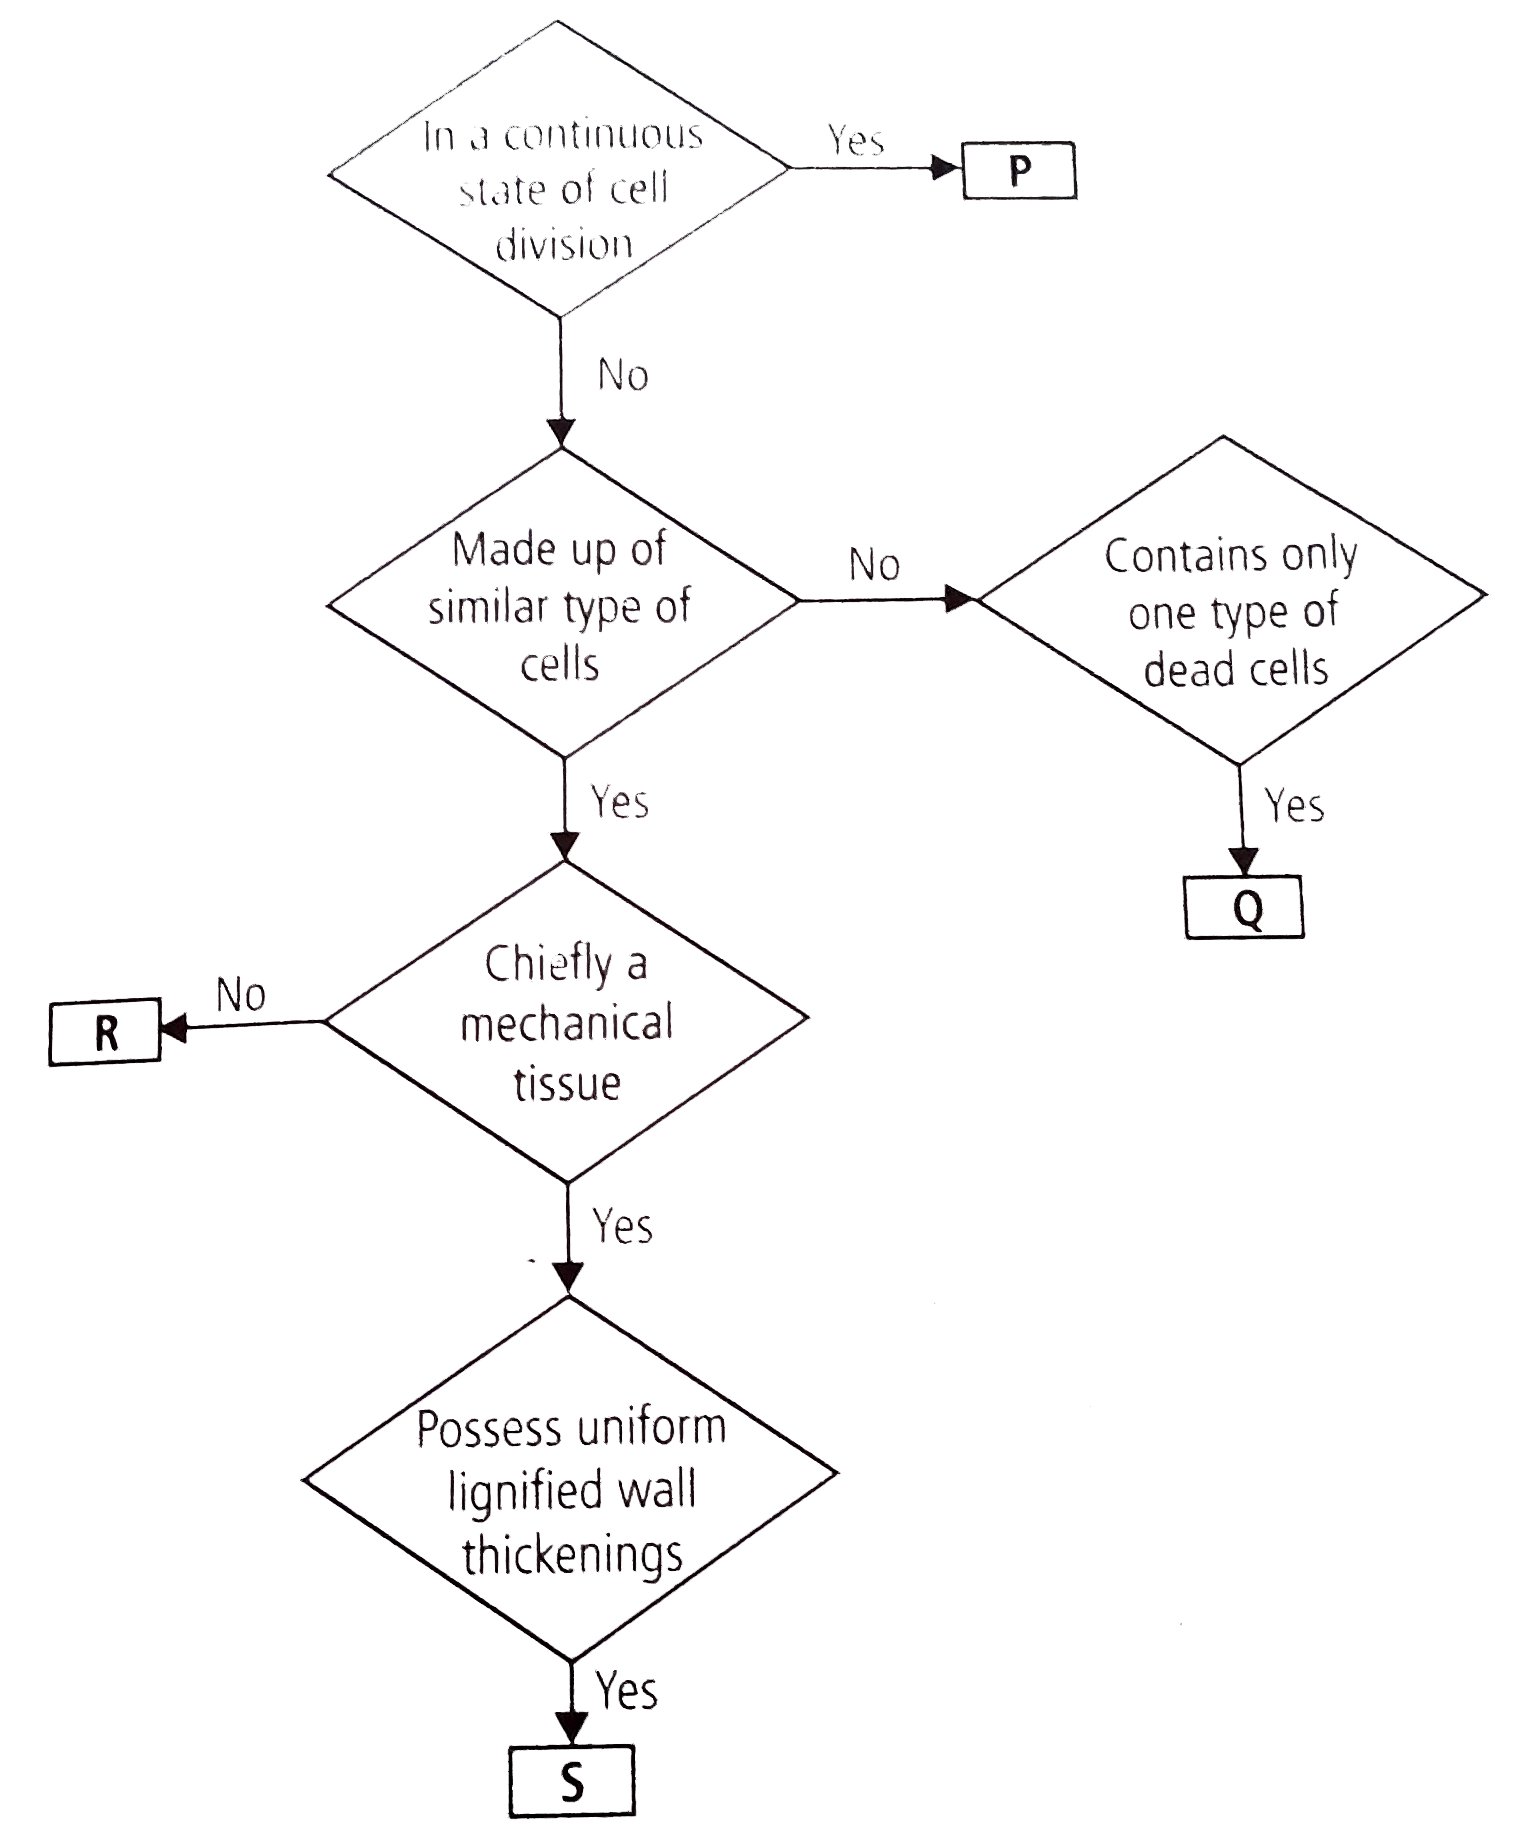
Study the flow chart given below:
Which of the following statements is incorrect regarding this?AP can be root apical meristemwhich is generally sub-terminal in position.BQ can bephloem which is also called bast.CR can be parenchyma which comprises of thin walled isodiametric cells.DS can becollenchyma which is a living mechanical
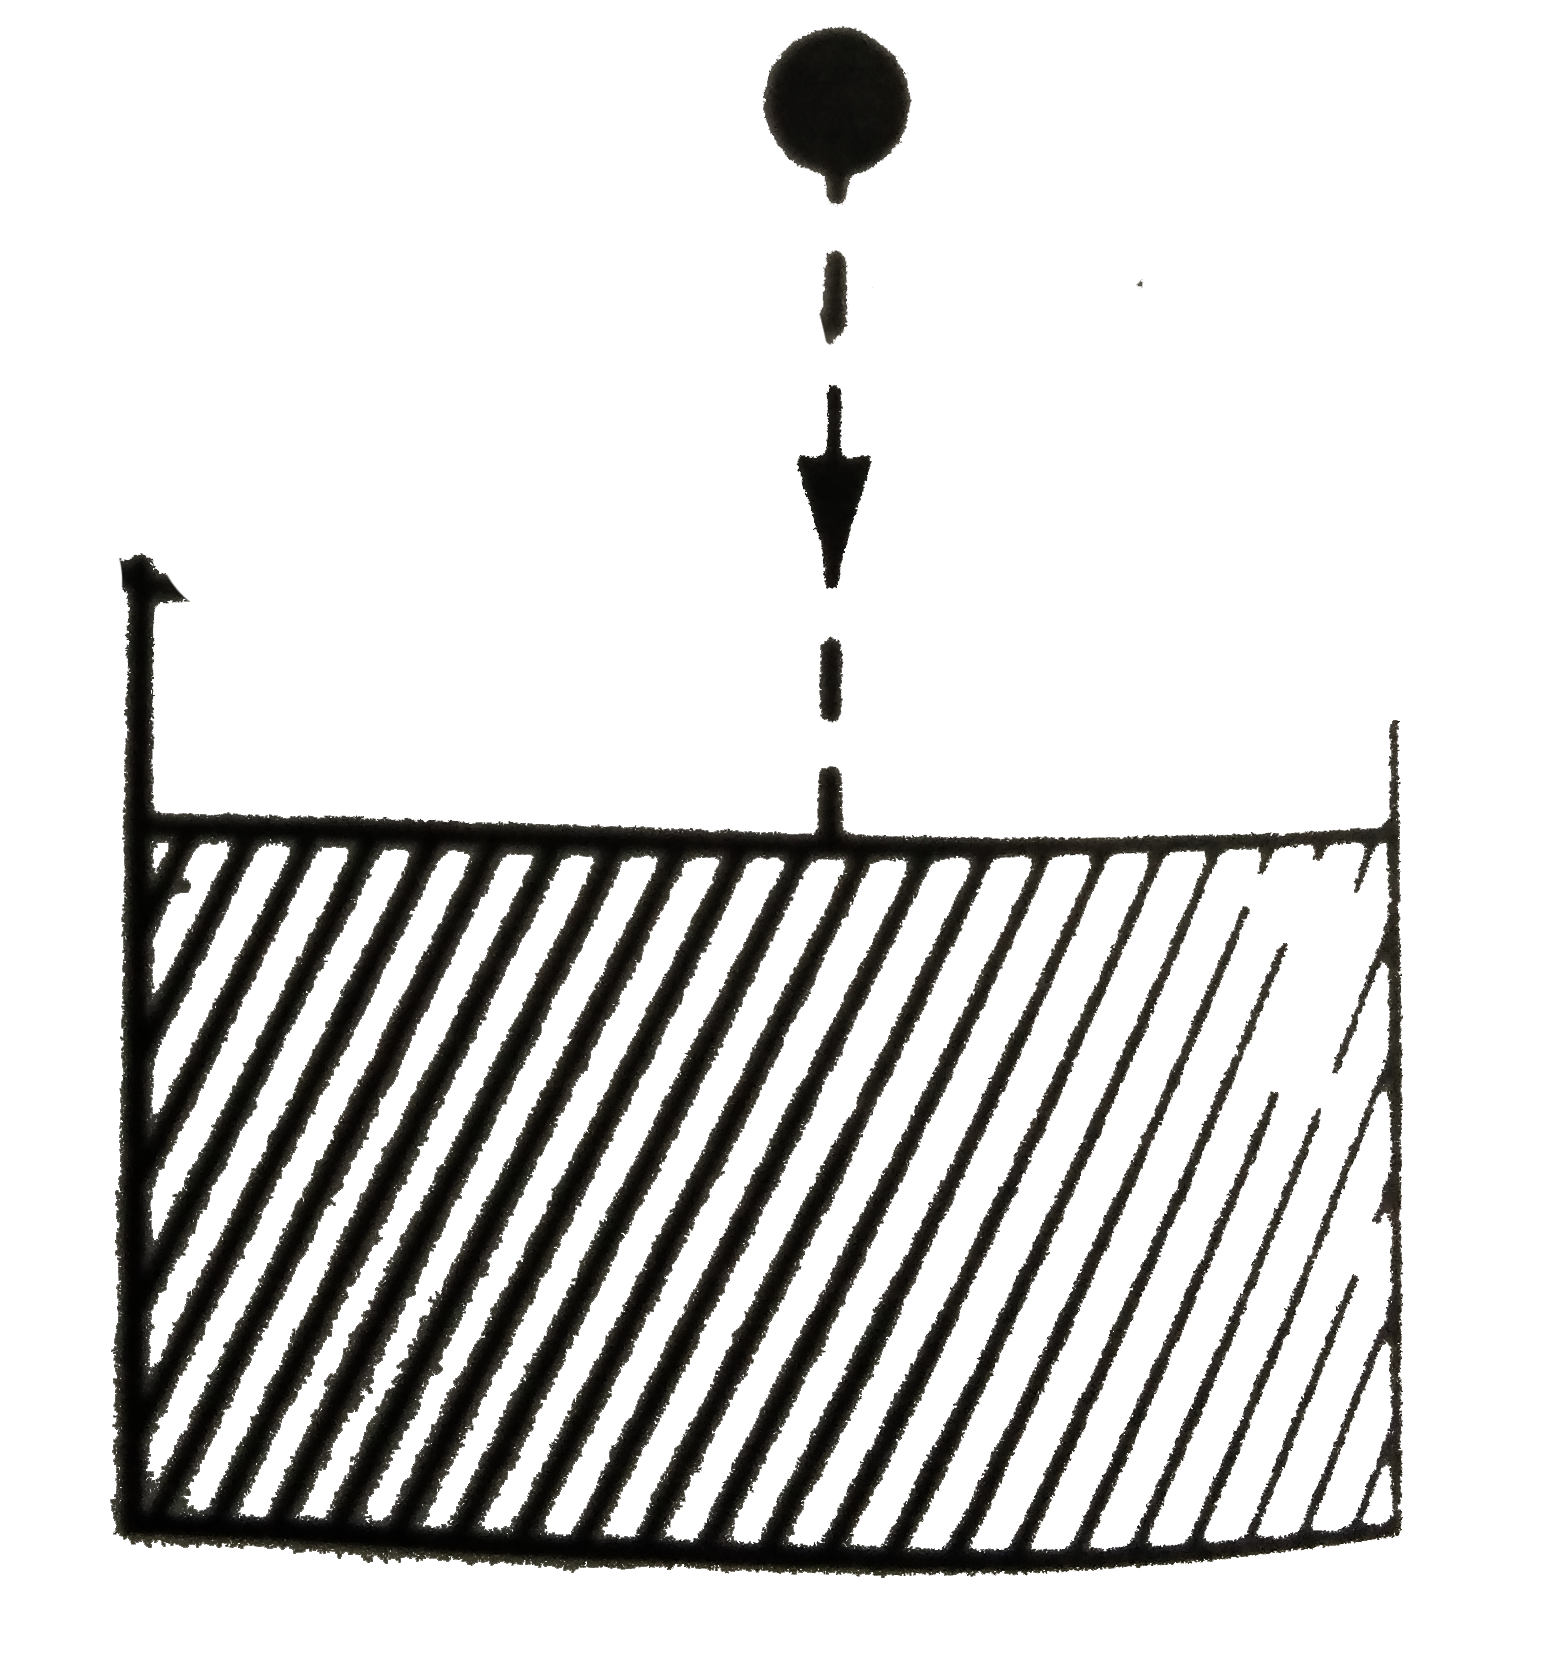
A ball of density ρ is dropped from a height on the surface of a non-viscous liquid of density 2ρ. Choose the correct options.
View SolutionStatement-1 : When an orifice is made in the middle of the wall of a vessel, the range of the liquid coming out of the orifice is equal to the height of the liquid.
Statement-2 : Liquid is flowing through two identical pipes A and B. Volume of liquid flowing per second through A and B are v0and2v0 respectively. Flow in A is turbulent and steady in B.
Statement-3 : Rate of flow of a viscous liquid through a pipe is directly proportional to he fourth power of the radius of pipe.
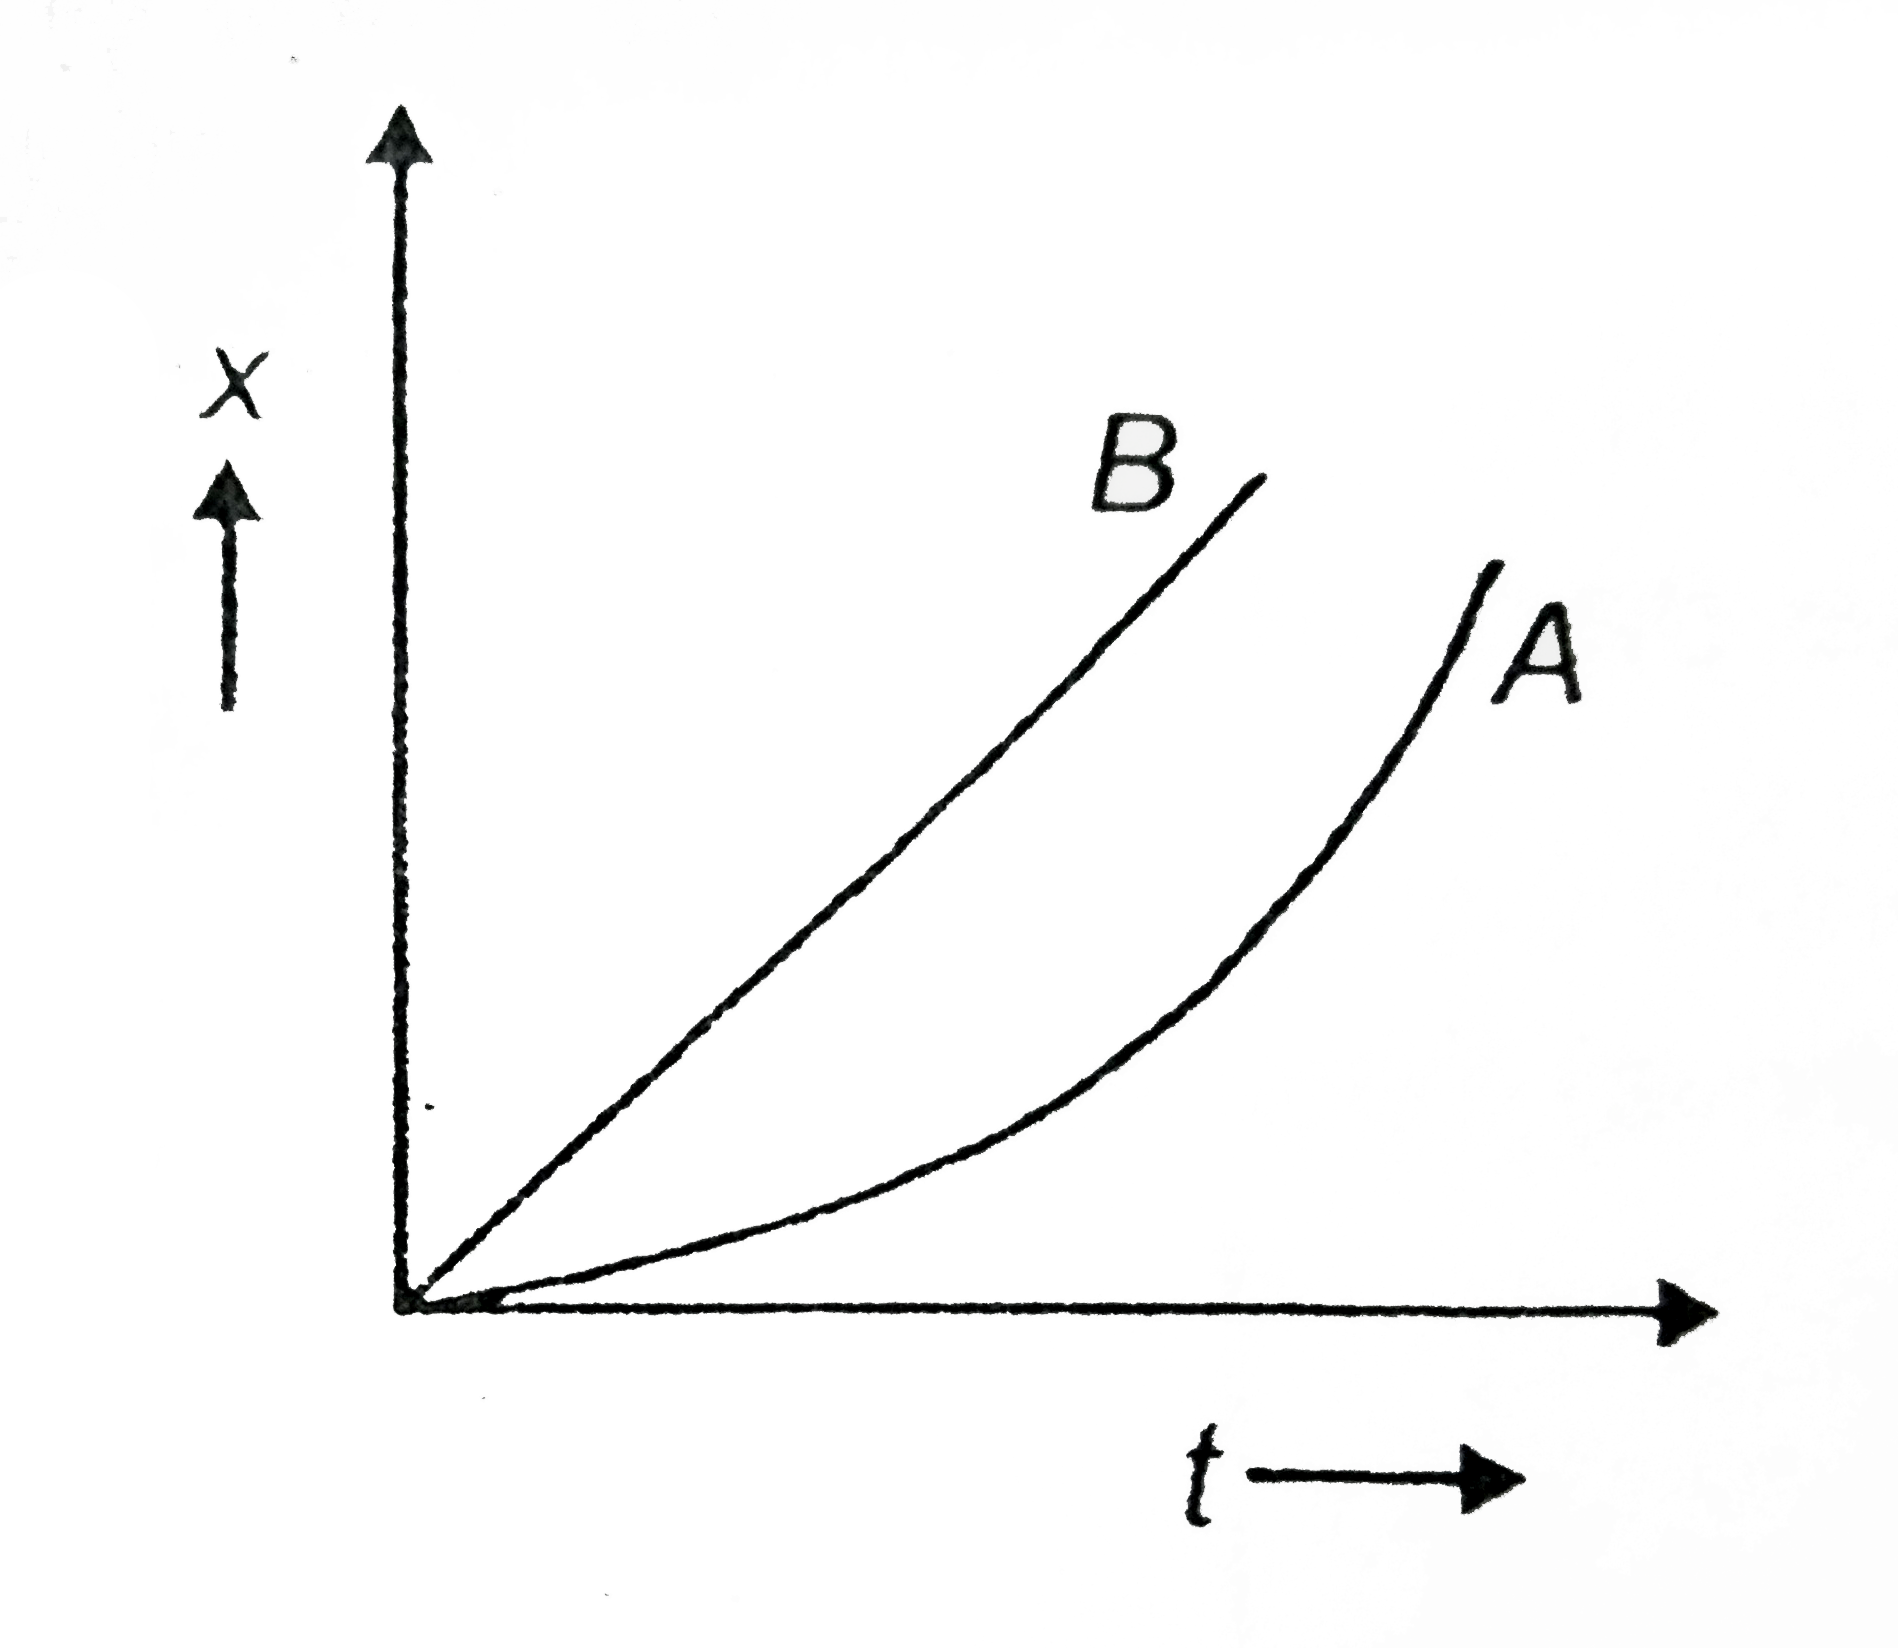
View SolutionThe displacement-time graph of two moving objects A and B are shown in the figure given below. Which of the following is incorrect?
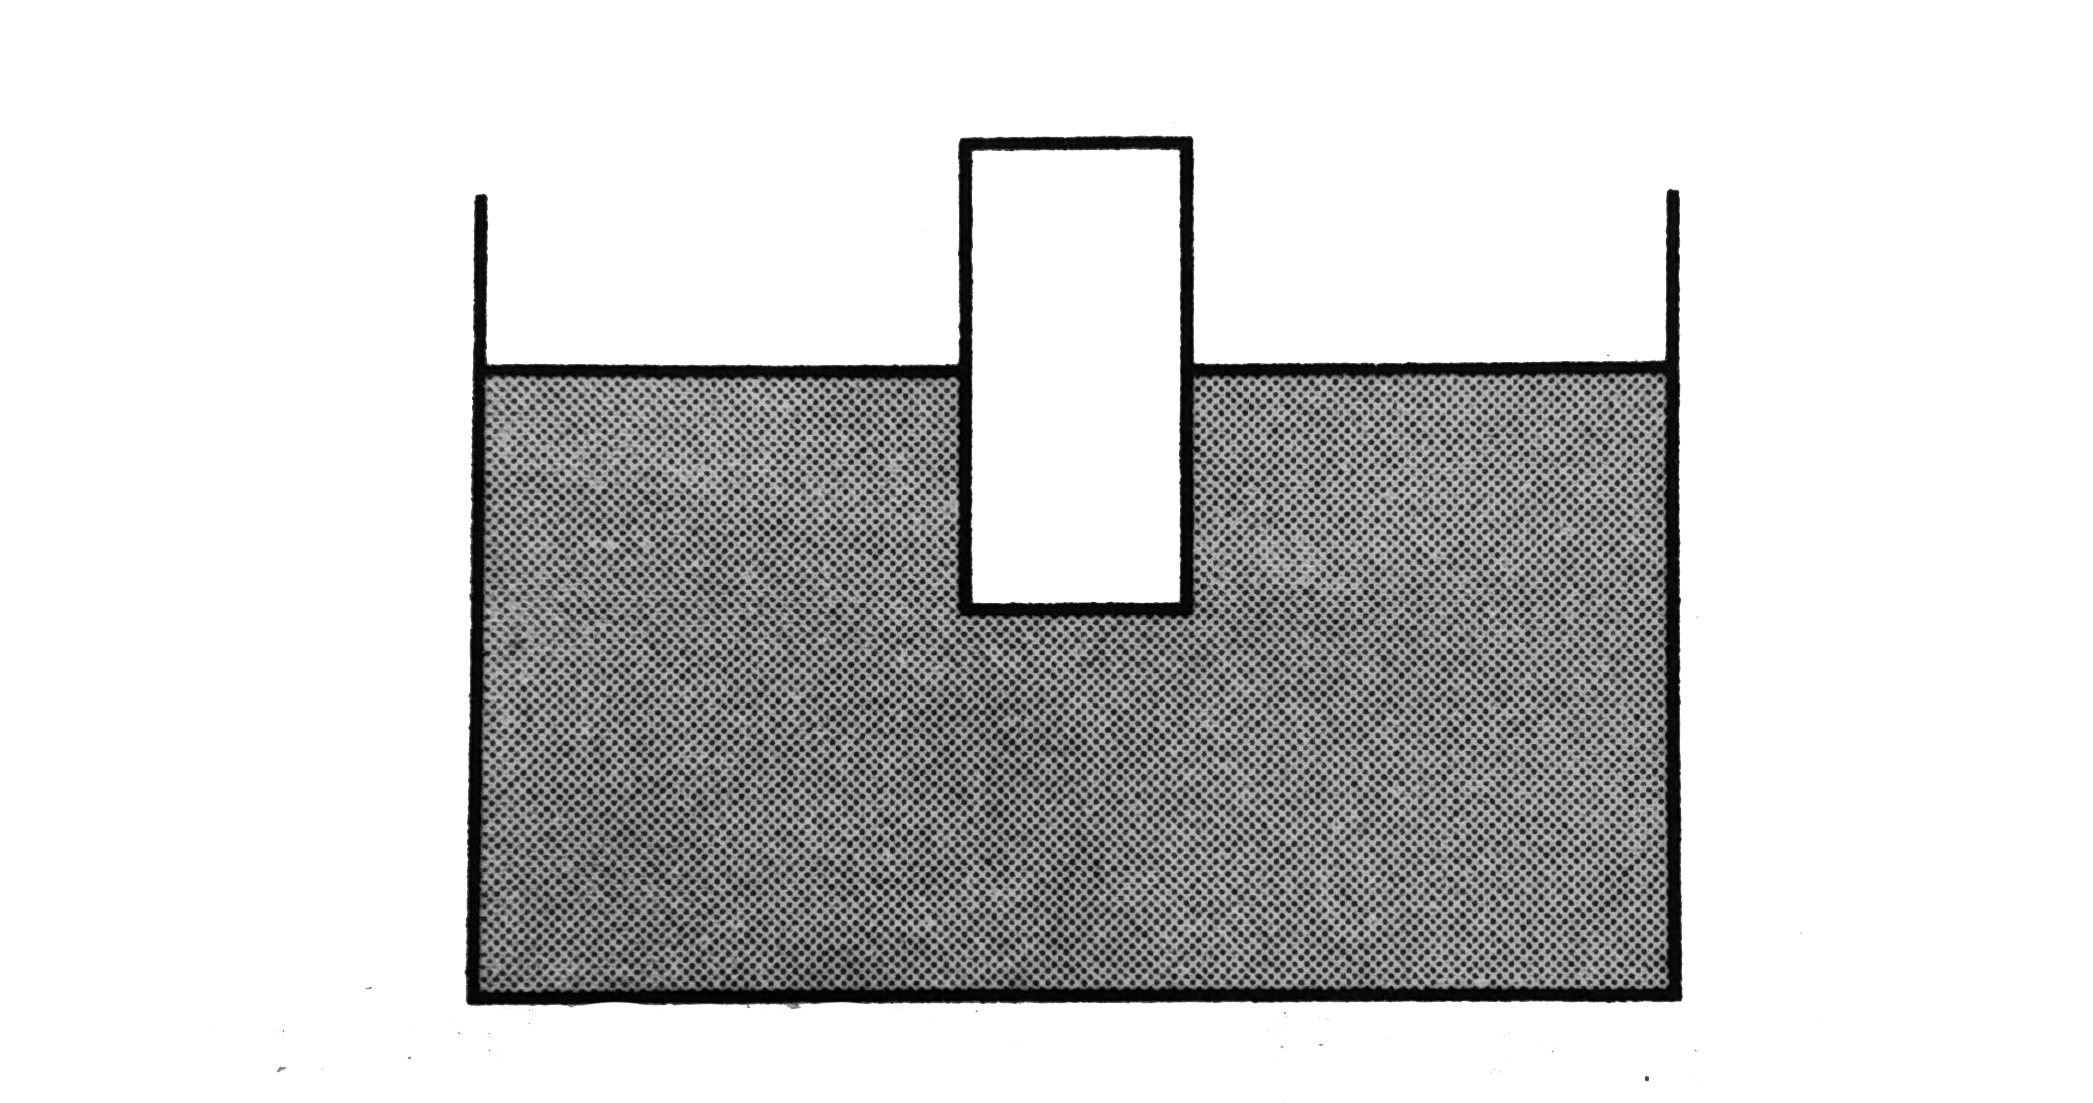
View SolutionA plank is floating in a non-viscous liquid as shown, Choose the correct option
View SolutionA small ball is dropped from a certain height on the surface of a non-viscous liquid of density less than the density of ball. The motion of the ball is
View SolutionA simple pendulum with a metallic bob has a time preiod 10 s. The bob is now immersed in a non-viscous liquide of density 1/3 that of metal. the time period of the same pendulum becomes
View Solution
