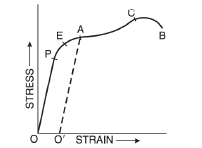
The stress-strain graph for a metal wire shown in the Fig. Upto the point E, the wire returns to its original state O along the curve EPO, when it is gradually unloaded. The point B corresponds to the fracture of the wire. Which point on the curve corresponds to 'elastic limit' or 'yield point of the wire ?
 Solution in Punjabi
Step by step video & image solution for The stress-strain graph for a metal wire shown in the Fig. Upto the point E, the wire returns to its original state O along the curve EPO, when it is gradually unloaded. The point B corresponds to the fracture of the wire. Which point on the curve corresponds to 'elastic limit' or 'yield point of the wire ? by Physics experts to help you in doubts & scoring excellent marks in Class 11 exams.
Updated on:21/07/2023Topper's Solved these Questions
Similar Questions
Discuss stress-strain graph.
View SolutionA bend in a level road has radius of 100 m.Find the maximum speed with which a car turning this bend may have without skidding ,if the coefficient of friction between the tyres and road is 0.8.
View SolutionDistinguish between streamline and turbulent flow of a liquid.
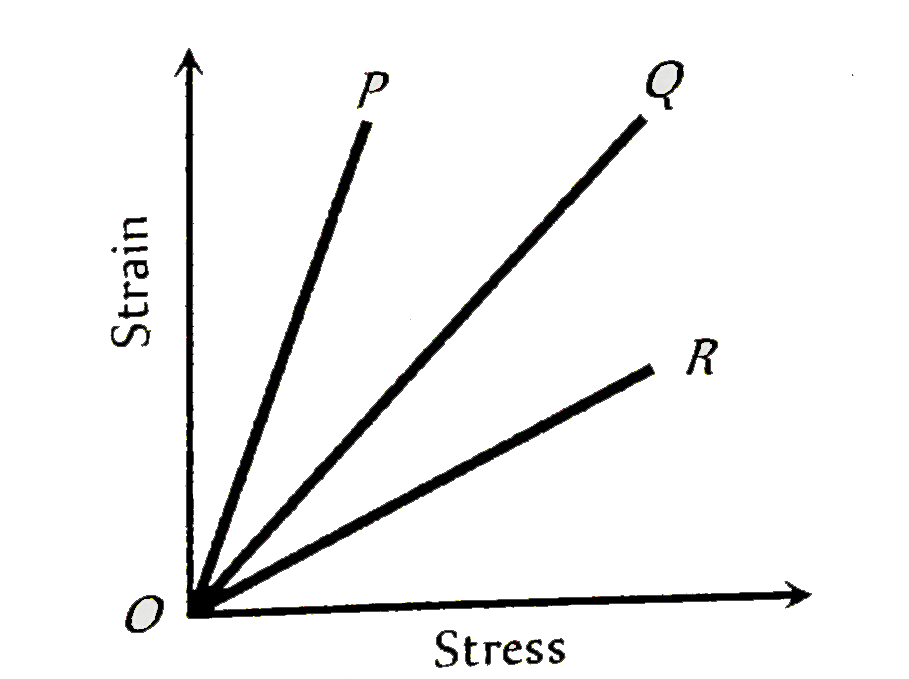
View SolutionThe strain stress curves of three wires of different materials are shown in the figure. P, Q and R are the elastic limits of the wires. The figure shown that
View SolutionThe stress strain graph for a metal wire is shown in the fig. Upto the point E, the wire returns to its original state O along the curve EPO, when it is gradually unloaded. Point B corresponds to the fracture of the wire. (a) Upto what point on the curve is Hooke's law obeyed? (this point some times called proportional limits). (b) Which point on the curve corresponding to elastic limet or yield point of the wire? (c ) Indicate teh elastice and plastic regions of the stree-strain graph. (d) Describe what happens when the wire is loaded upto a stress corresponding to the point A on the graph and then unloaded gradulally. In particular explain the dotted curve. (e) Wht is peculiar about the protion of the stree- strain graph from C to B? Upto what stress can the wire be subjected with out causing fracture?
View SolutionThe strain-stress curves of three wire of different materials are shown in the figure. P,Q and R are the elastic limits of the wires. The figures shows that

View SolutionThe strain-stress curves of three wires of different materials ar shown in the figure P,Q and R are the elastic limits of the wires. The figure shows that :
View SolutionAssertion Upto elastic limit of a stress-strain curve, the steel wire tends to regain its original shape when stress is removed. Reason Within elastic limit, the wire follows Hooke's law.
View SolutionDraw Stress - Strain curve. Show Yield point and Fracture point.
View SolutionAssertion (A) Ductile metals are used to prepare thin wires. Reason (R) In the stress-strain curve of ductile metals, the length between the points representing elastic limit and breaking point is very small.
View SolutionWrite stress-strain curve for a metal. What is proportional limit and yield point ?
View SolutionStatement I: Ductile metals are used to prepare thein wires. Statement II: In the stress-strain curve of ductile metals, the length between the points representing elastic limit and breaking points is very small.
View SolutionDefine the terms stress and strain and also state their SI units. Draw the stress versus strain graph for a metallic wire, when stretched upto the breaking point.
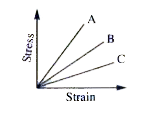
View SolutionThe strain stress curves of three wires of different material as shown in fig. A,B,C are the elastic limits of the wire. The figure show that

View SolutionThe strain stress curves of three wires of different material as shown in fig. A,B,C are the elastic limits of the wire. The figure show that
View SolutionDraw the stress-strain graph of a loading wire. Mark the following points : i) Elastic limit ii) Fracture point iii) Plastic region iv) Elastic region
View Solution
