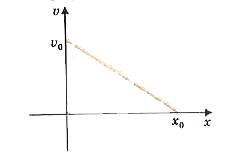
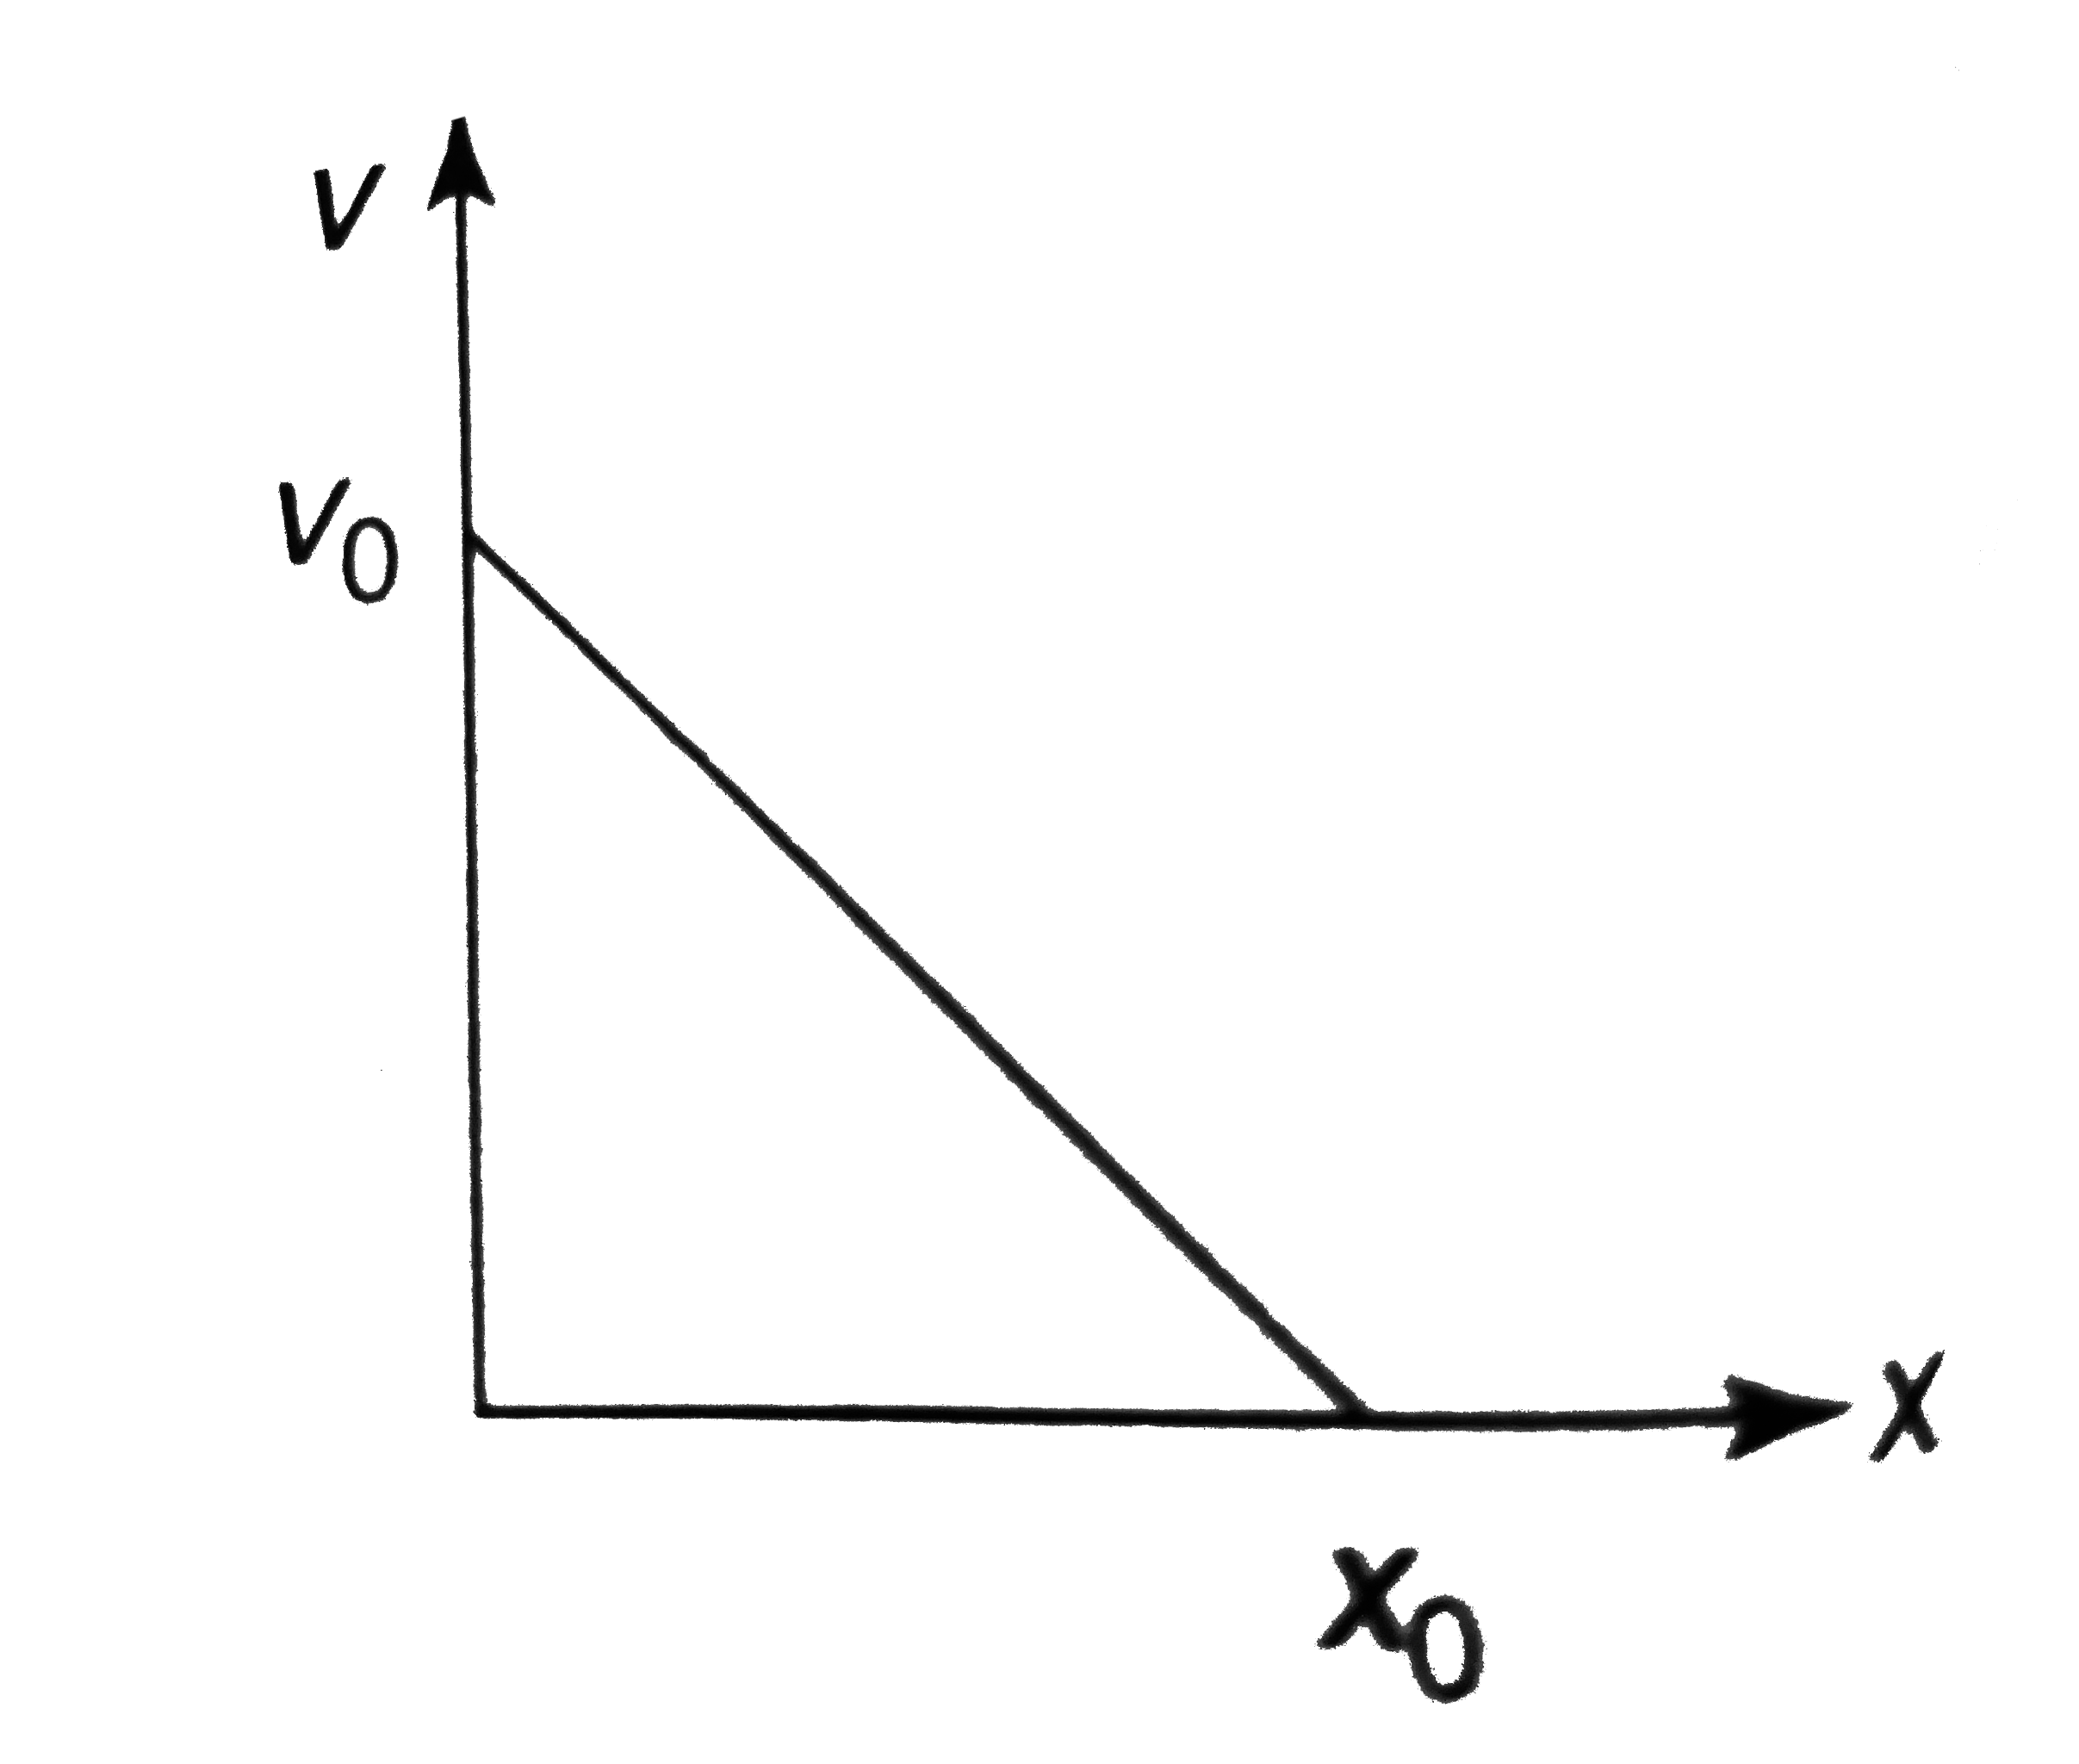
The velocity -displacement graph of a particle is as shown in the figure. Which of the following graphs correctly represents the variation of acceleration with displacement?

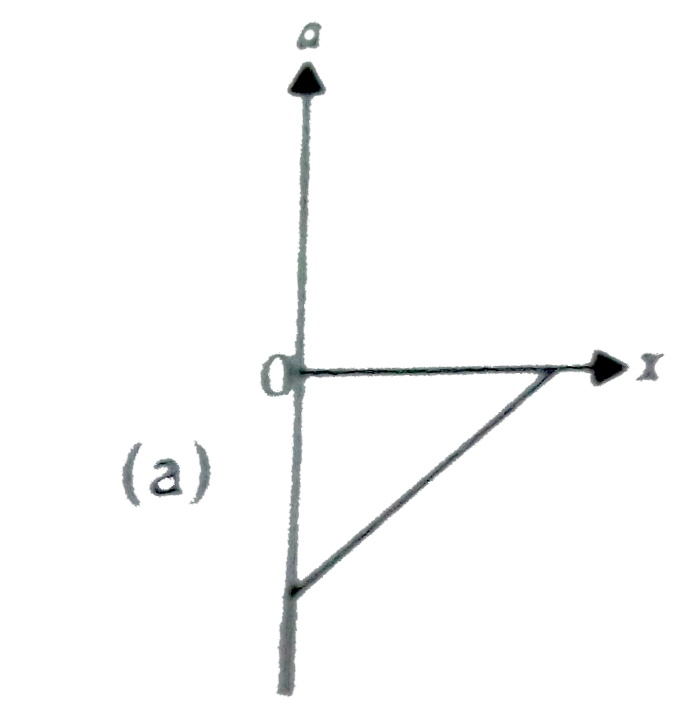
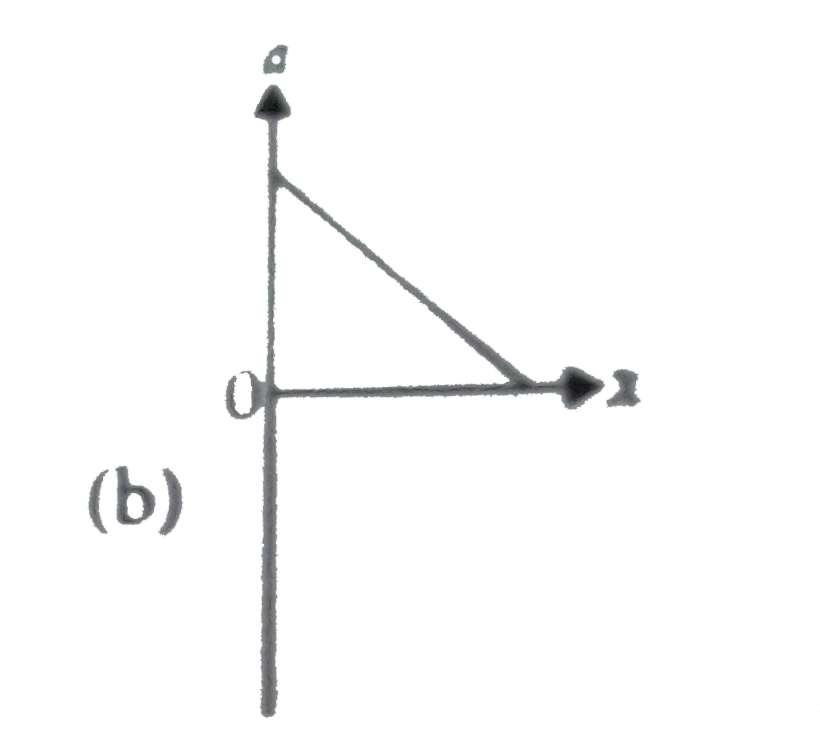

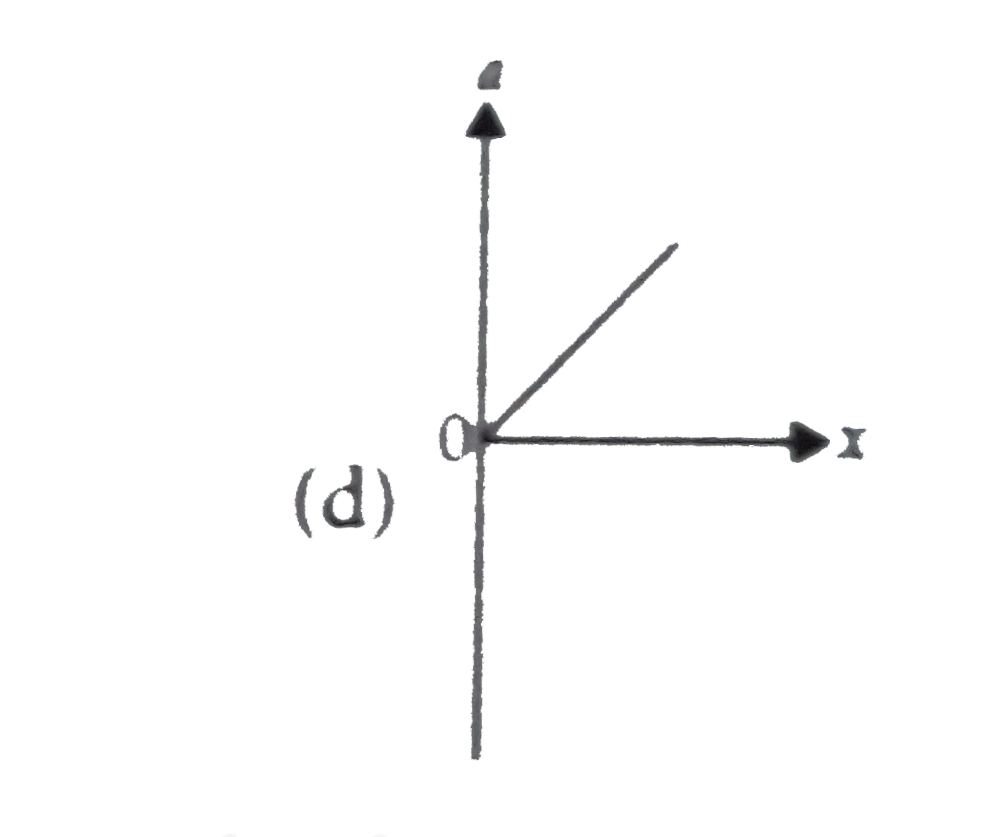
The correct Answer is:A
For the given velocity-displacement graph, intercept = vo and slope = -v0x0
Thus, the equation of given the velocity-displacement graph is
v=−v0x0x+v0 …(i)
Acceleration, a=dvdt=dvdxdxdt=dvdxv
since =dvdx=−v0x0
∴a=−v0x0(−v0x0x+v0) (Using (i))
v20x20x−v20x0
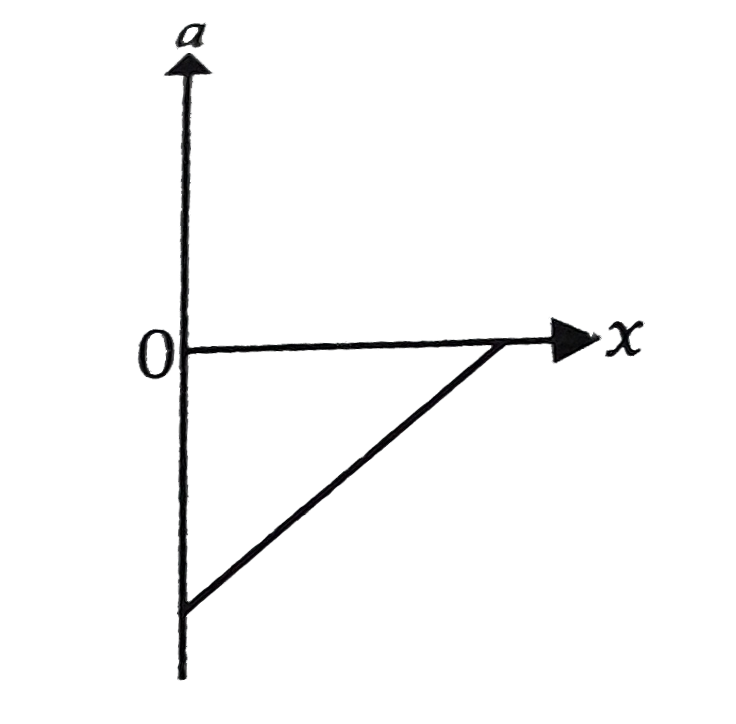
It is a straight line with positive slope and a negative intercept.
The variation of a x is as shown in the above figure.
Topper's Solved these Questions
- MOTION IN A STRAIGHT LINEBOOK - NCERT FINGERTIPSCHAPTER - MOTION IN A STRAIGHT LINEEXERCISE - Kinematic Equations For Uniformly Accelerated Motion
32 Videos
- MOTION IN A STRAIGHT LINEBOOK - NCERT FINGERTIPSCHAPTER - MOTION IN A STRAIGHT LINEEXERCISE - Relative Velocity
18 Videos
- MOTION IN A STRAIGHT LINEBOOK - NCERT FINGERTIPSCHAPTER - MOTION IN A STRAIGHT LINEEXERCISE - Instantaneous Velocity And Speed
16 Videos
- MOTION IN A PLANE BOOK - NCERT FINGERTIPSCHAPTER - MOTION IN A PLANE EXERCISE - Assertion And Reason
15 Videos
- OSCILLATIONS BOOK - NCERT FINGERTIPSCHAPTER - OSCILLATIONS EXERCISE - Assertion And Reason
15 Videos
Similar Questions
Knowledge Check
Which of the following graphs best represents the variation of acceleration 'a' with displacement x?
A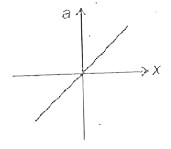 B
B C
C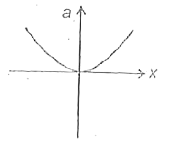 D
D
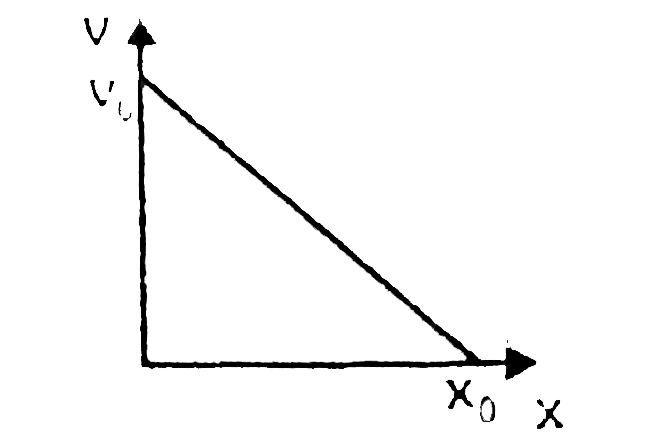
Graph between velocity and displacement is shown in the following figure:
Which of the following graphes represents the correct variation of acceleration with displacementA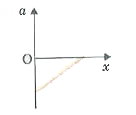 B
B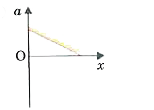 C
C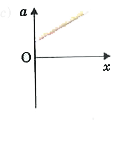 Dnone
Dnonevelocity time graph of a particle is shown in figure. Find displacement of the particle.
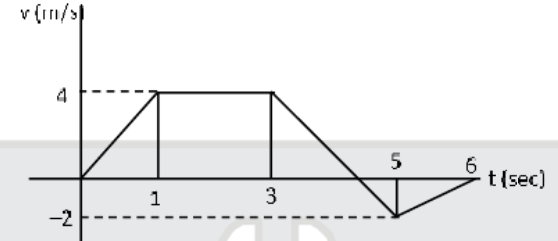 A7B11C5D15
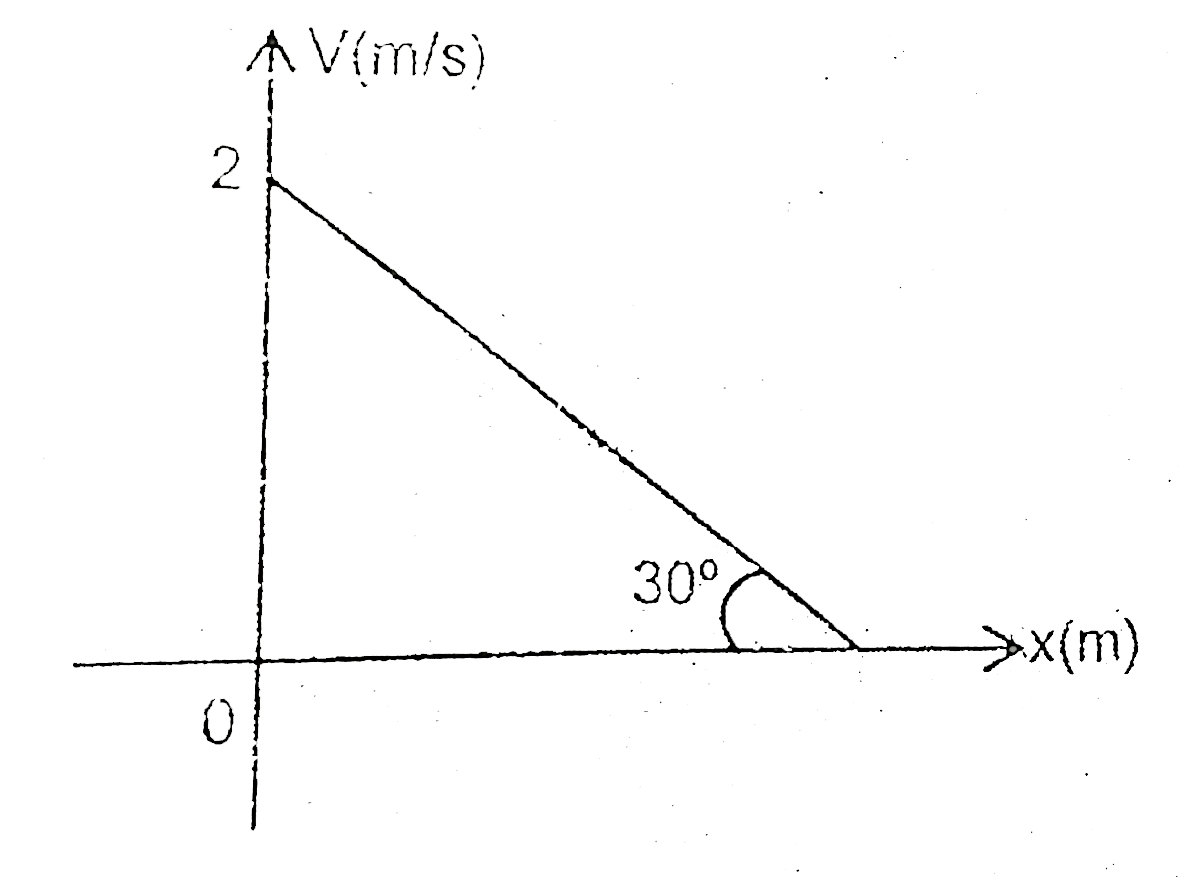
The velocity displacement graph of a particle is shown in figure. The acceleration of the particle when x=0 is.
View SolutionThe given graph shows the variation of velocity with displacement. Which one of the graphs given below correctly represents the variation of acceleration with displacement ?
View SolutionThe given graph shows the variation of velocity with displacement. Which one of the graph given below correctly represents the variation of acceleration with displacement :-
View SolutionThe velocity displacement graph of a particle is shown in figure. The acceleration of the particle when x=0 is.

View SolutionThe given graph shows the variation of velocity with displacement. Which one of the graphs given below correctly represents the variation of acceleration with displacement ?

View Solution
