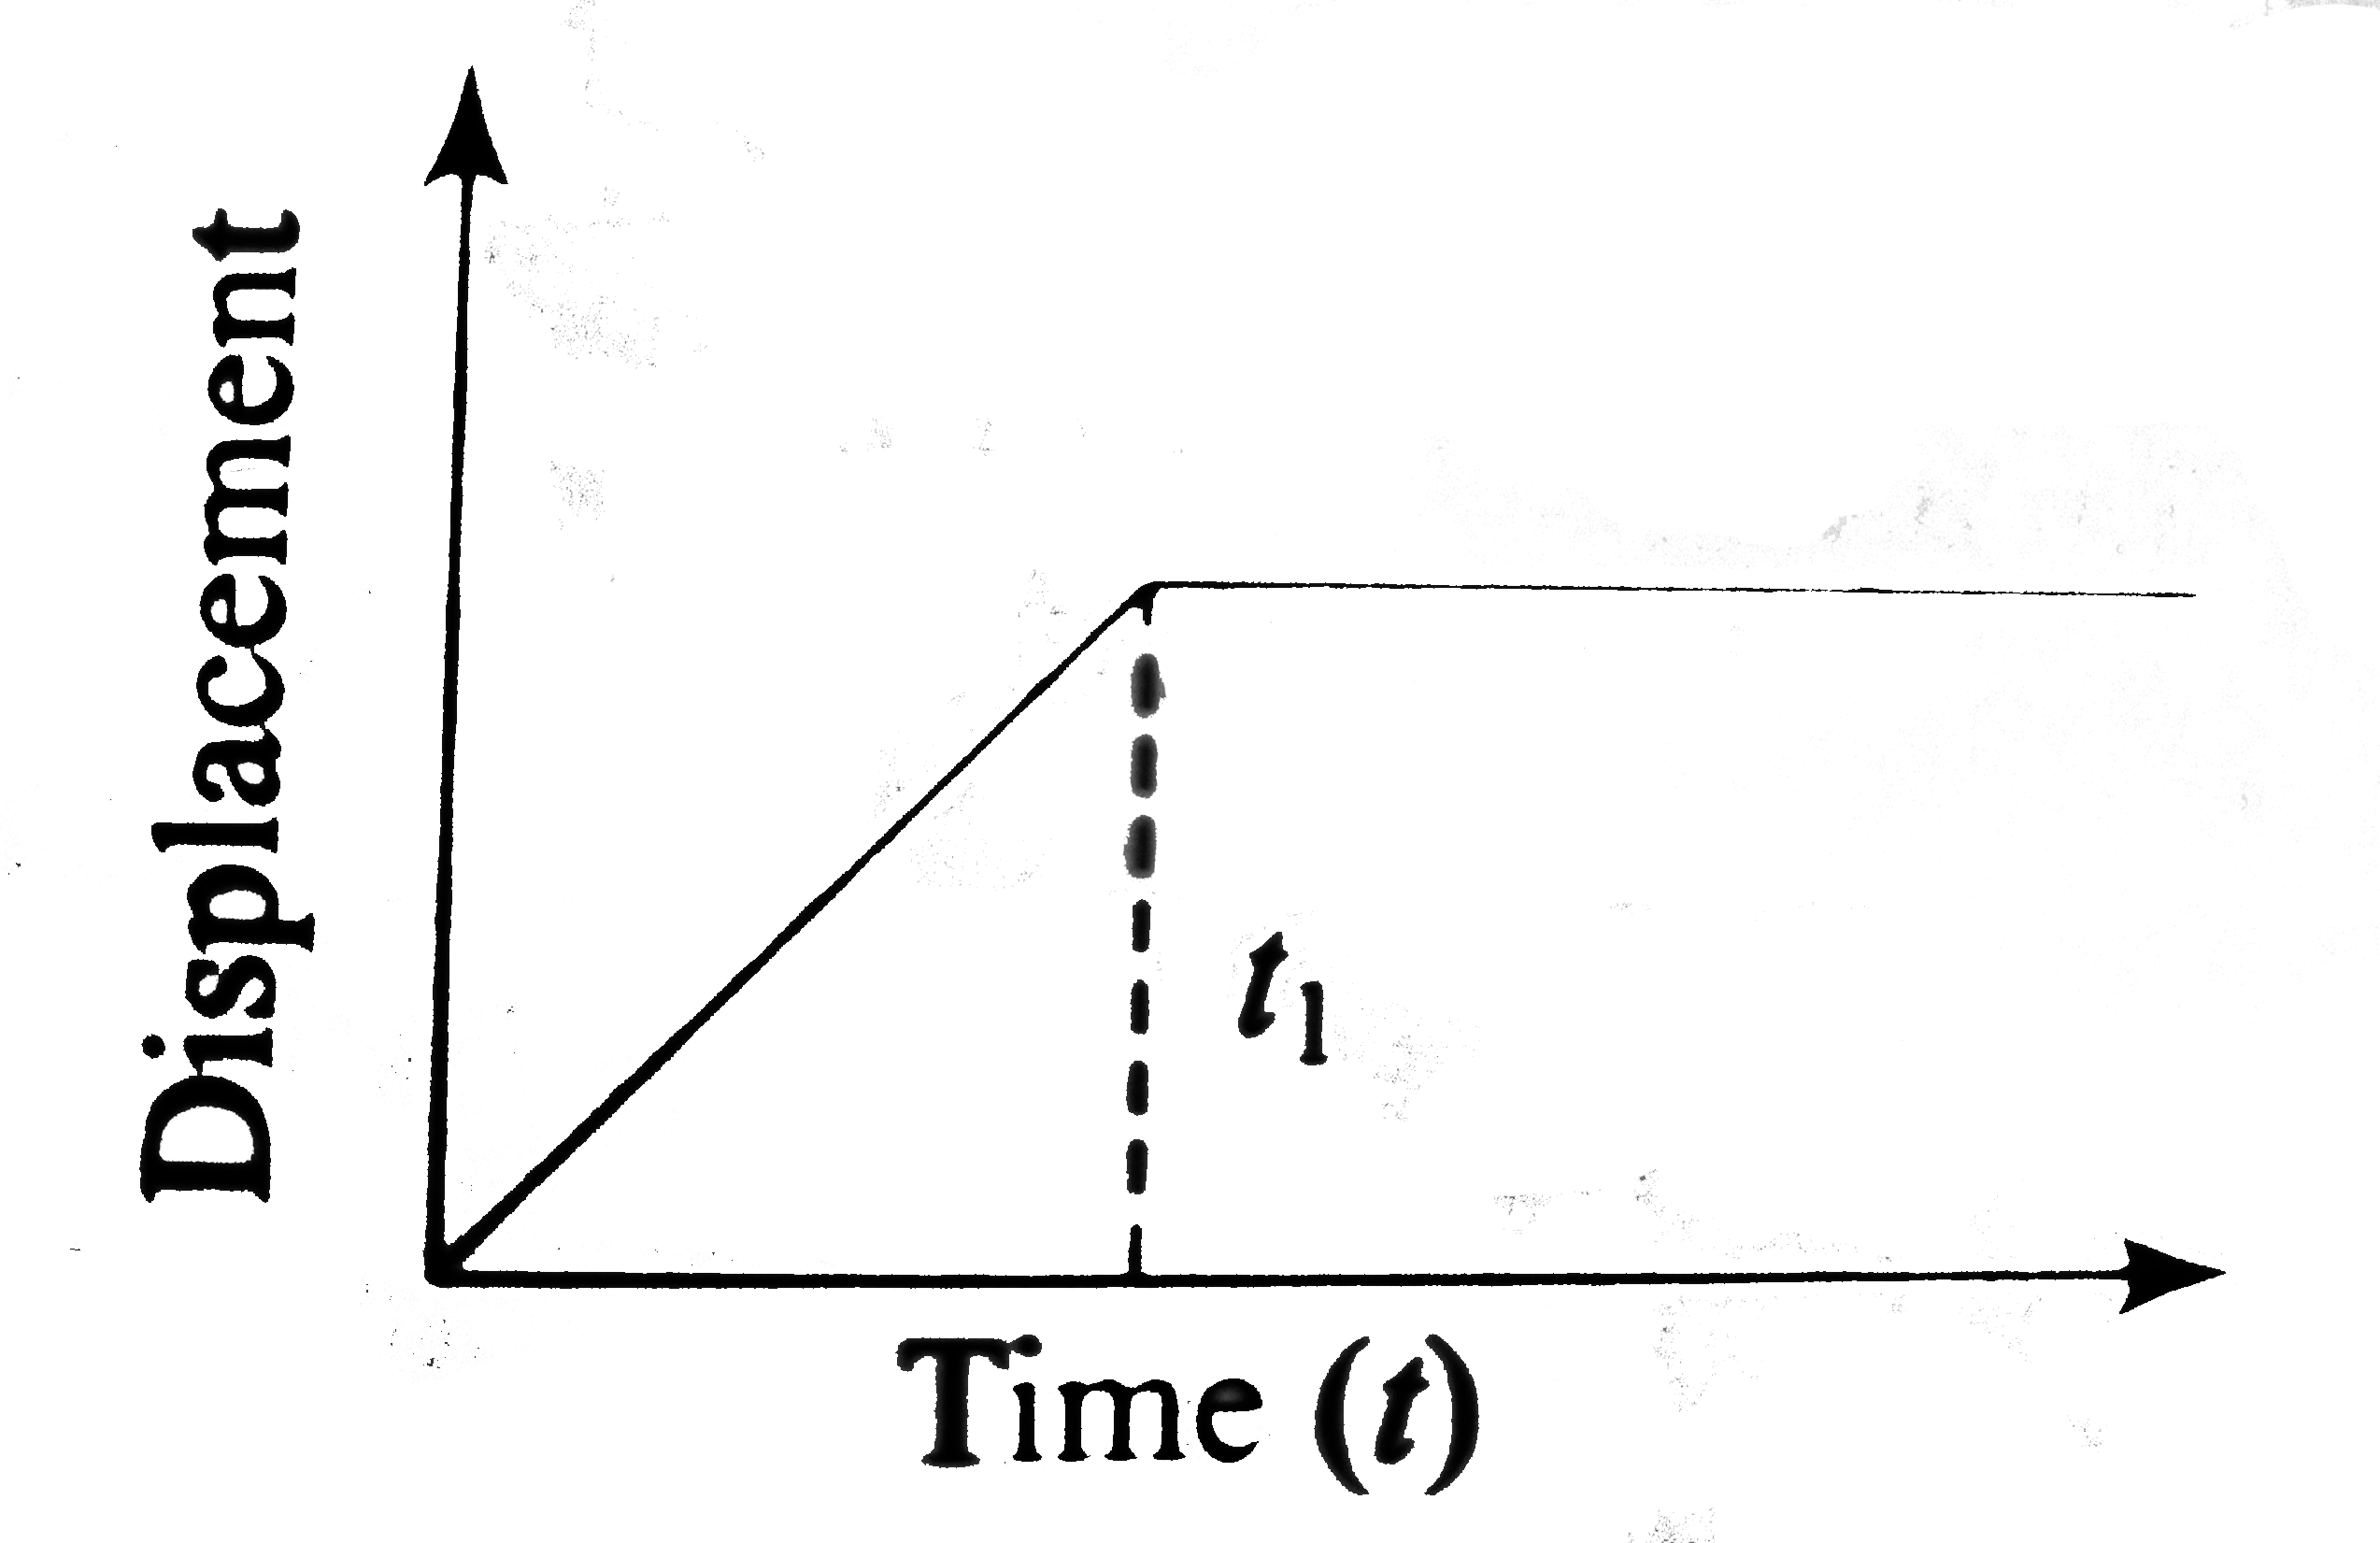
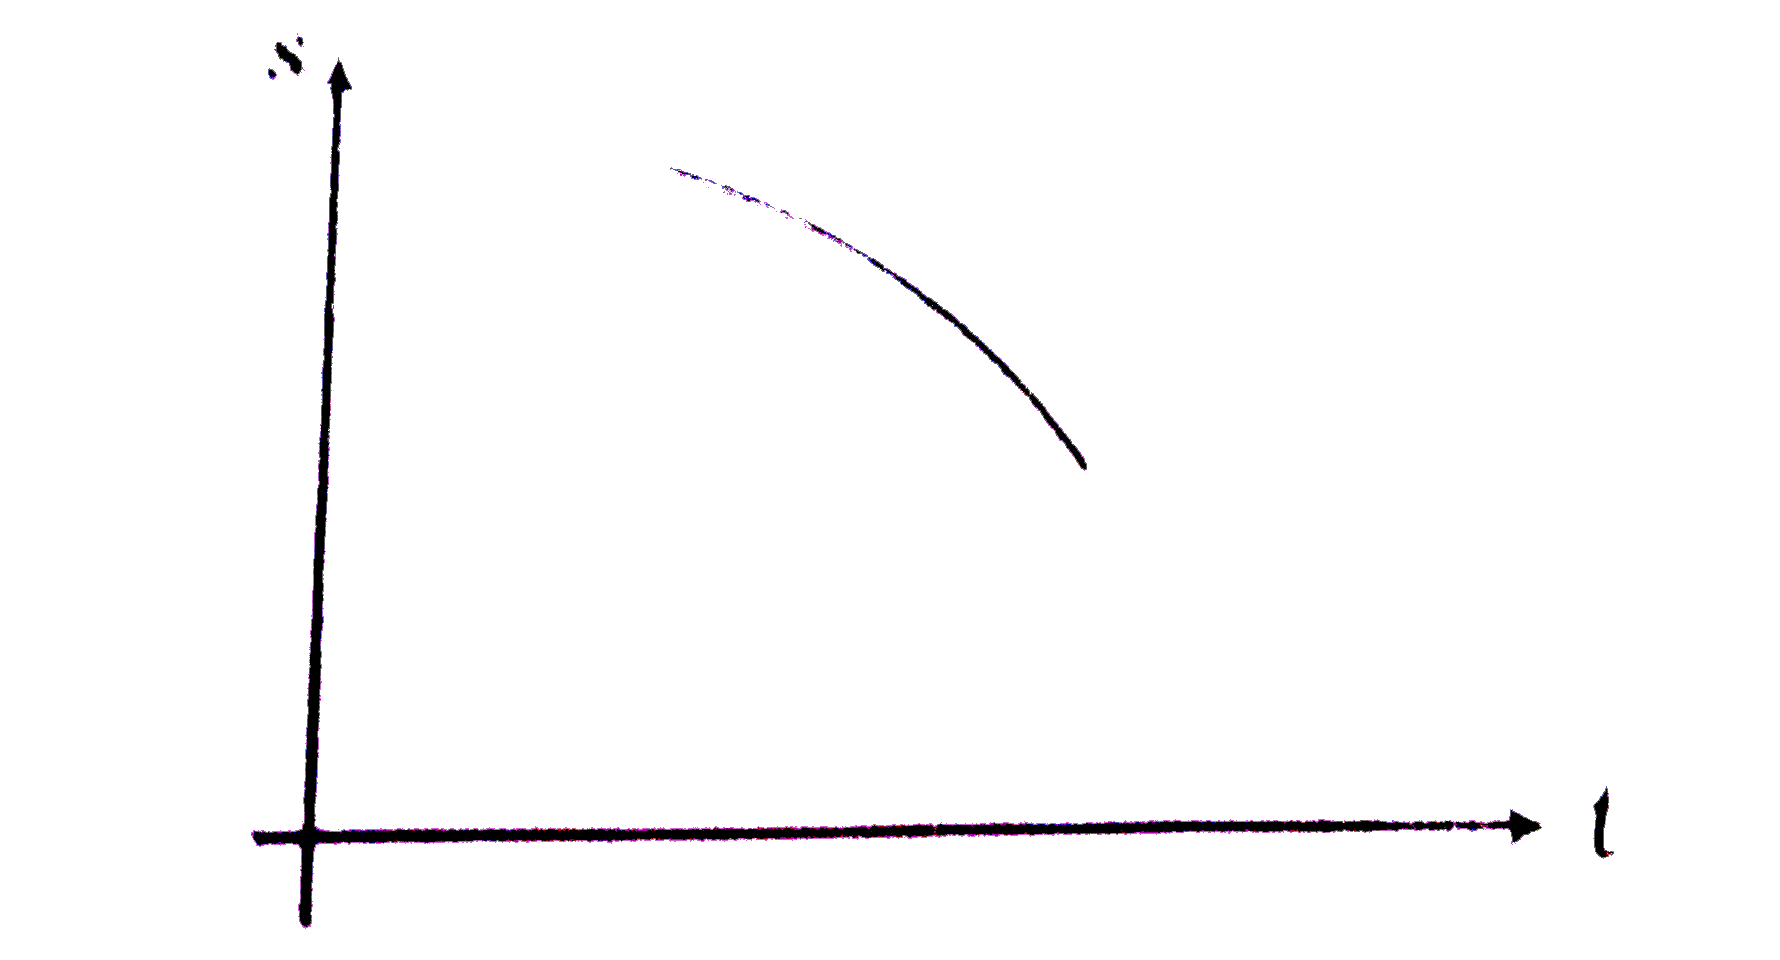
The x-t graph shown in figure represents

constant velocity
velocity of the body is continuously changing
instantaneous velocity
the body travels with constant speed up to time t1 and then stops
The correct Answer is:D
Step by step video & image solution for The x-t graph shown in figure represents by Physics experts to help you in doubts & scoring excellent marks in Class 12 exams.
Updated on:21/07/2023Topper's Solved these Questions
- MOTION IN A STRAIGHT LINE BOOK - AAKASH SERIESCHAPTER - MOTION IN A STRAIGHT LINE EXERCISE - EXERCISE -II
80 Videos
- MOTION IN A STRAIGHT LINE BOOK - AAKASH SERIESCHAPTER - MOTION IN A STRAIGHT LINE EXERCISE - PRACTICE EXERCISE
58 Videos
- MOTION IN A STRAIGHT LINE BOOK - AAKASH SERIESCHAPTER - MOTION IN A STRAIGHT LINE EXERCISE - very Short answer type question
15 Videos
- MOTION IN A PLANEBOOK - AAKASH SERIESCHAPTER - MOTION IN A PLANEEXERCISE - QUESTION FOR DESCRIPTIVE ANSWER
7 Videos
- MOVING CHARGES AND MAGNETISMBOOK - AAKASH SERIESCHAPTER - MOVING CHARGES AND MAGNETISMEXERCISE - EXERCISE-III
49 Videos
Similar Questions
The x-t graph shoen in figure reprents
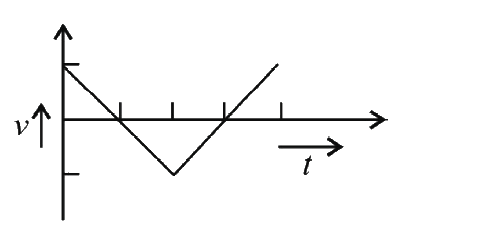
View SolutionThe graph in figure shows the velocity v versus time t for a body. Which of the graphs shown in figure represents the correesponding acceleration versus time graphs ?
View SolutionA : The displacement (s) time graph shown in the figure represents an accelerated motion.
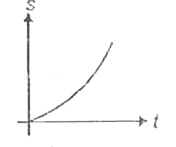
R : Slope of graph increases with time.
View SolutionThe displacement-time graph of a moving object is shown in figure. Which of the velocity-time graphs shown in figure could represent the motion of the same body ?
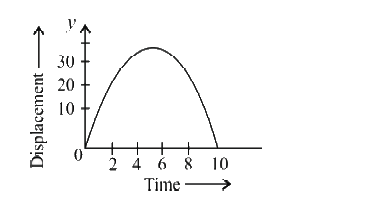
View SolutionThe graph shown in figure is exponential. Write down the equation corresponding to the graph.
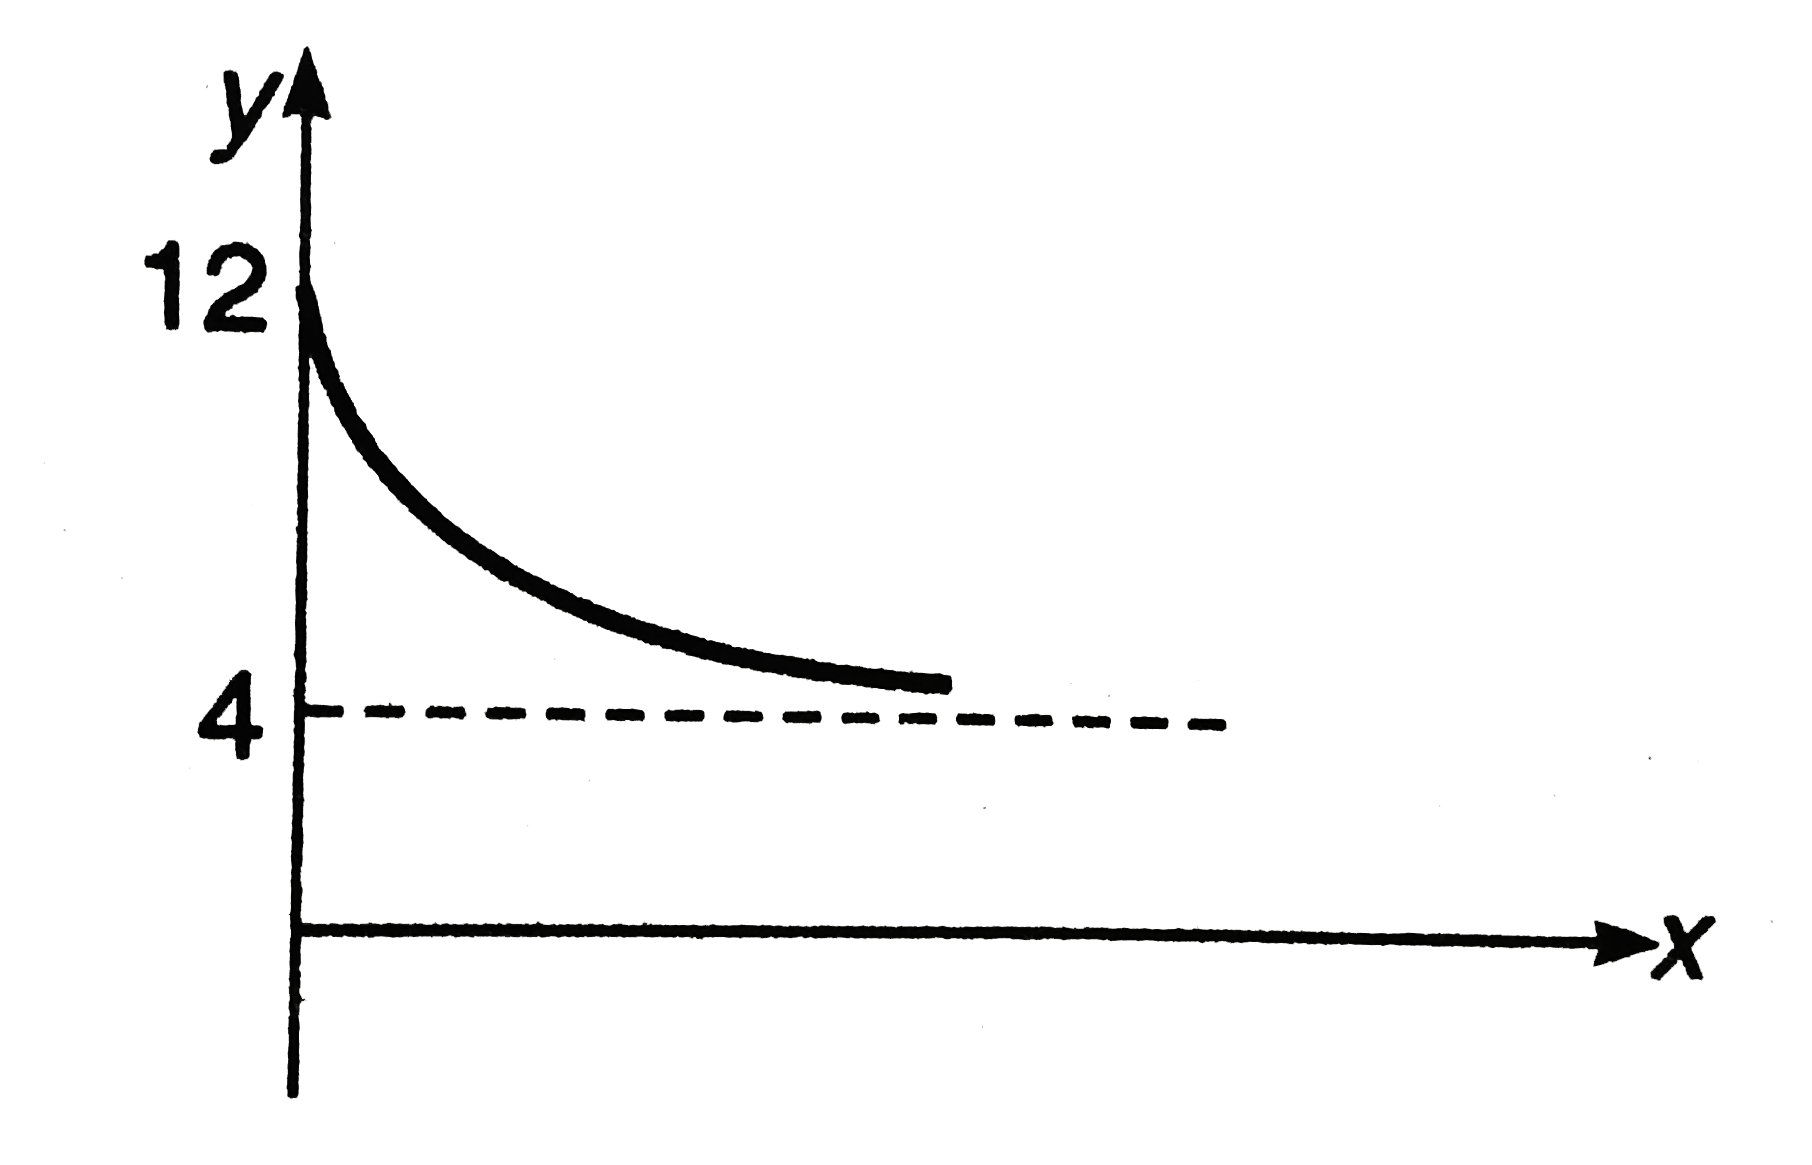
View SolutionThe graph shown in figure is exponential. Write down the equation corresponding to the graph.
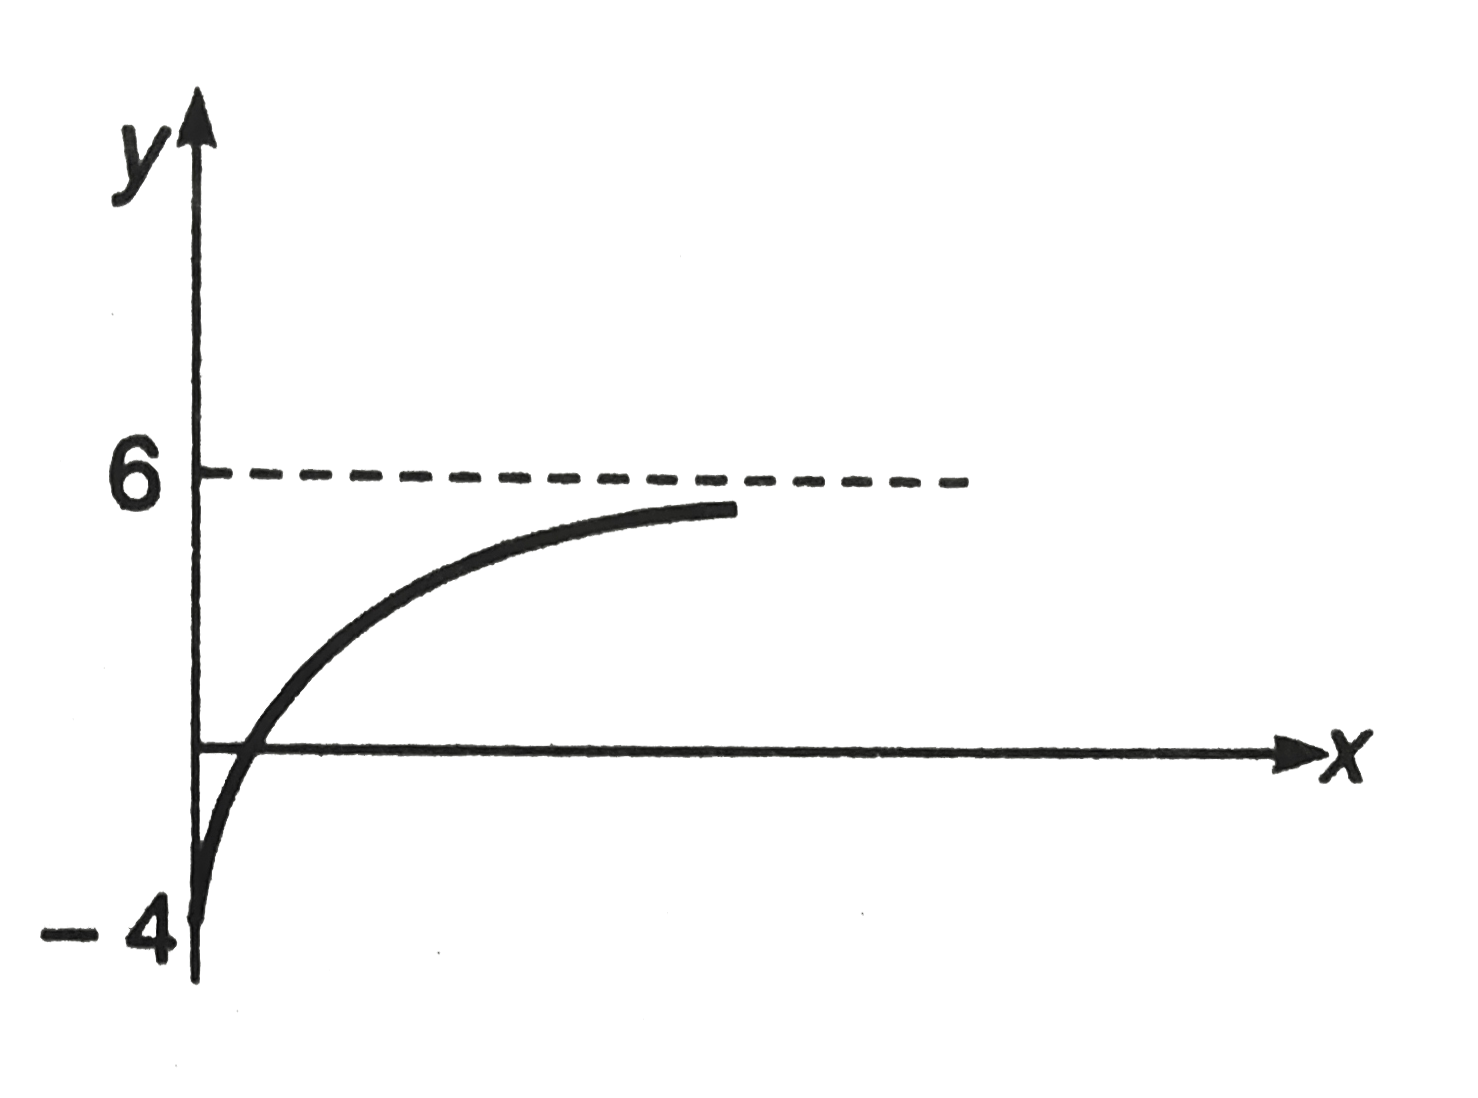
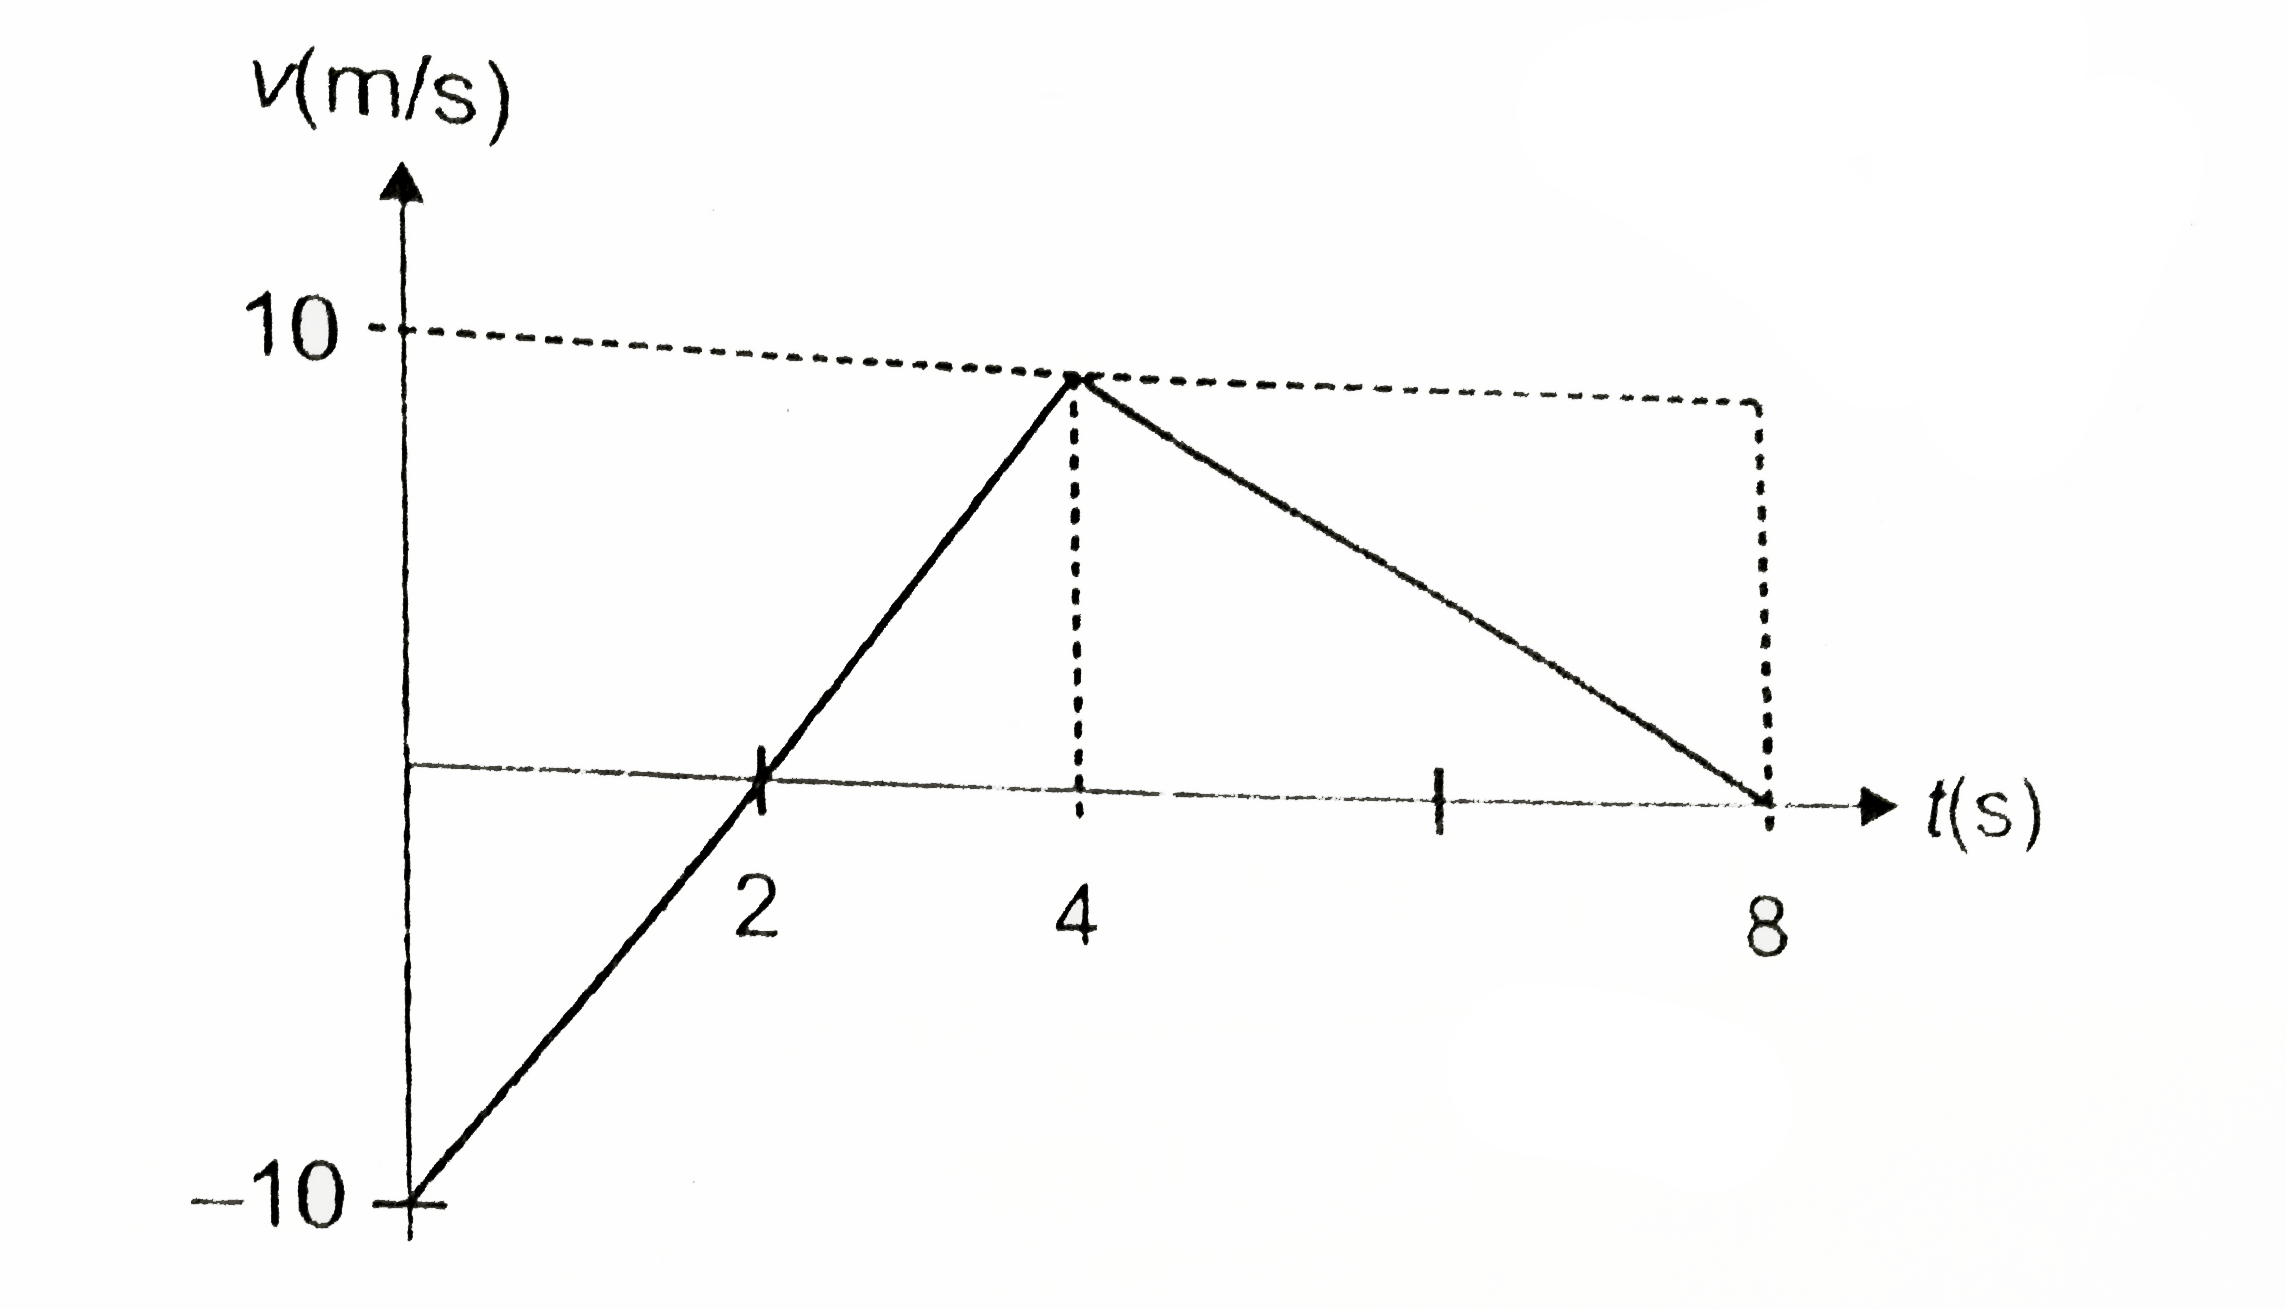
View SolutionFor the v-t graph shown in figure find the acccelertion in 0-4 sec and 4-8 sec.
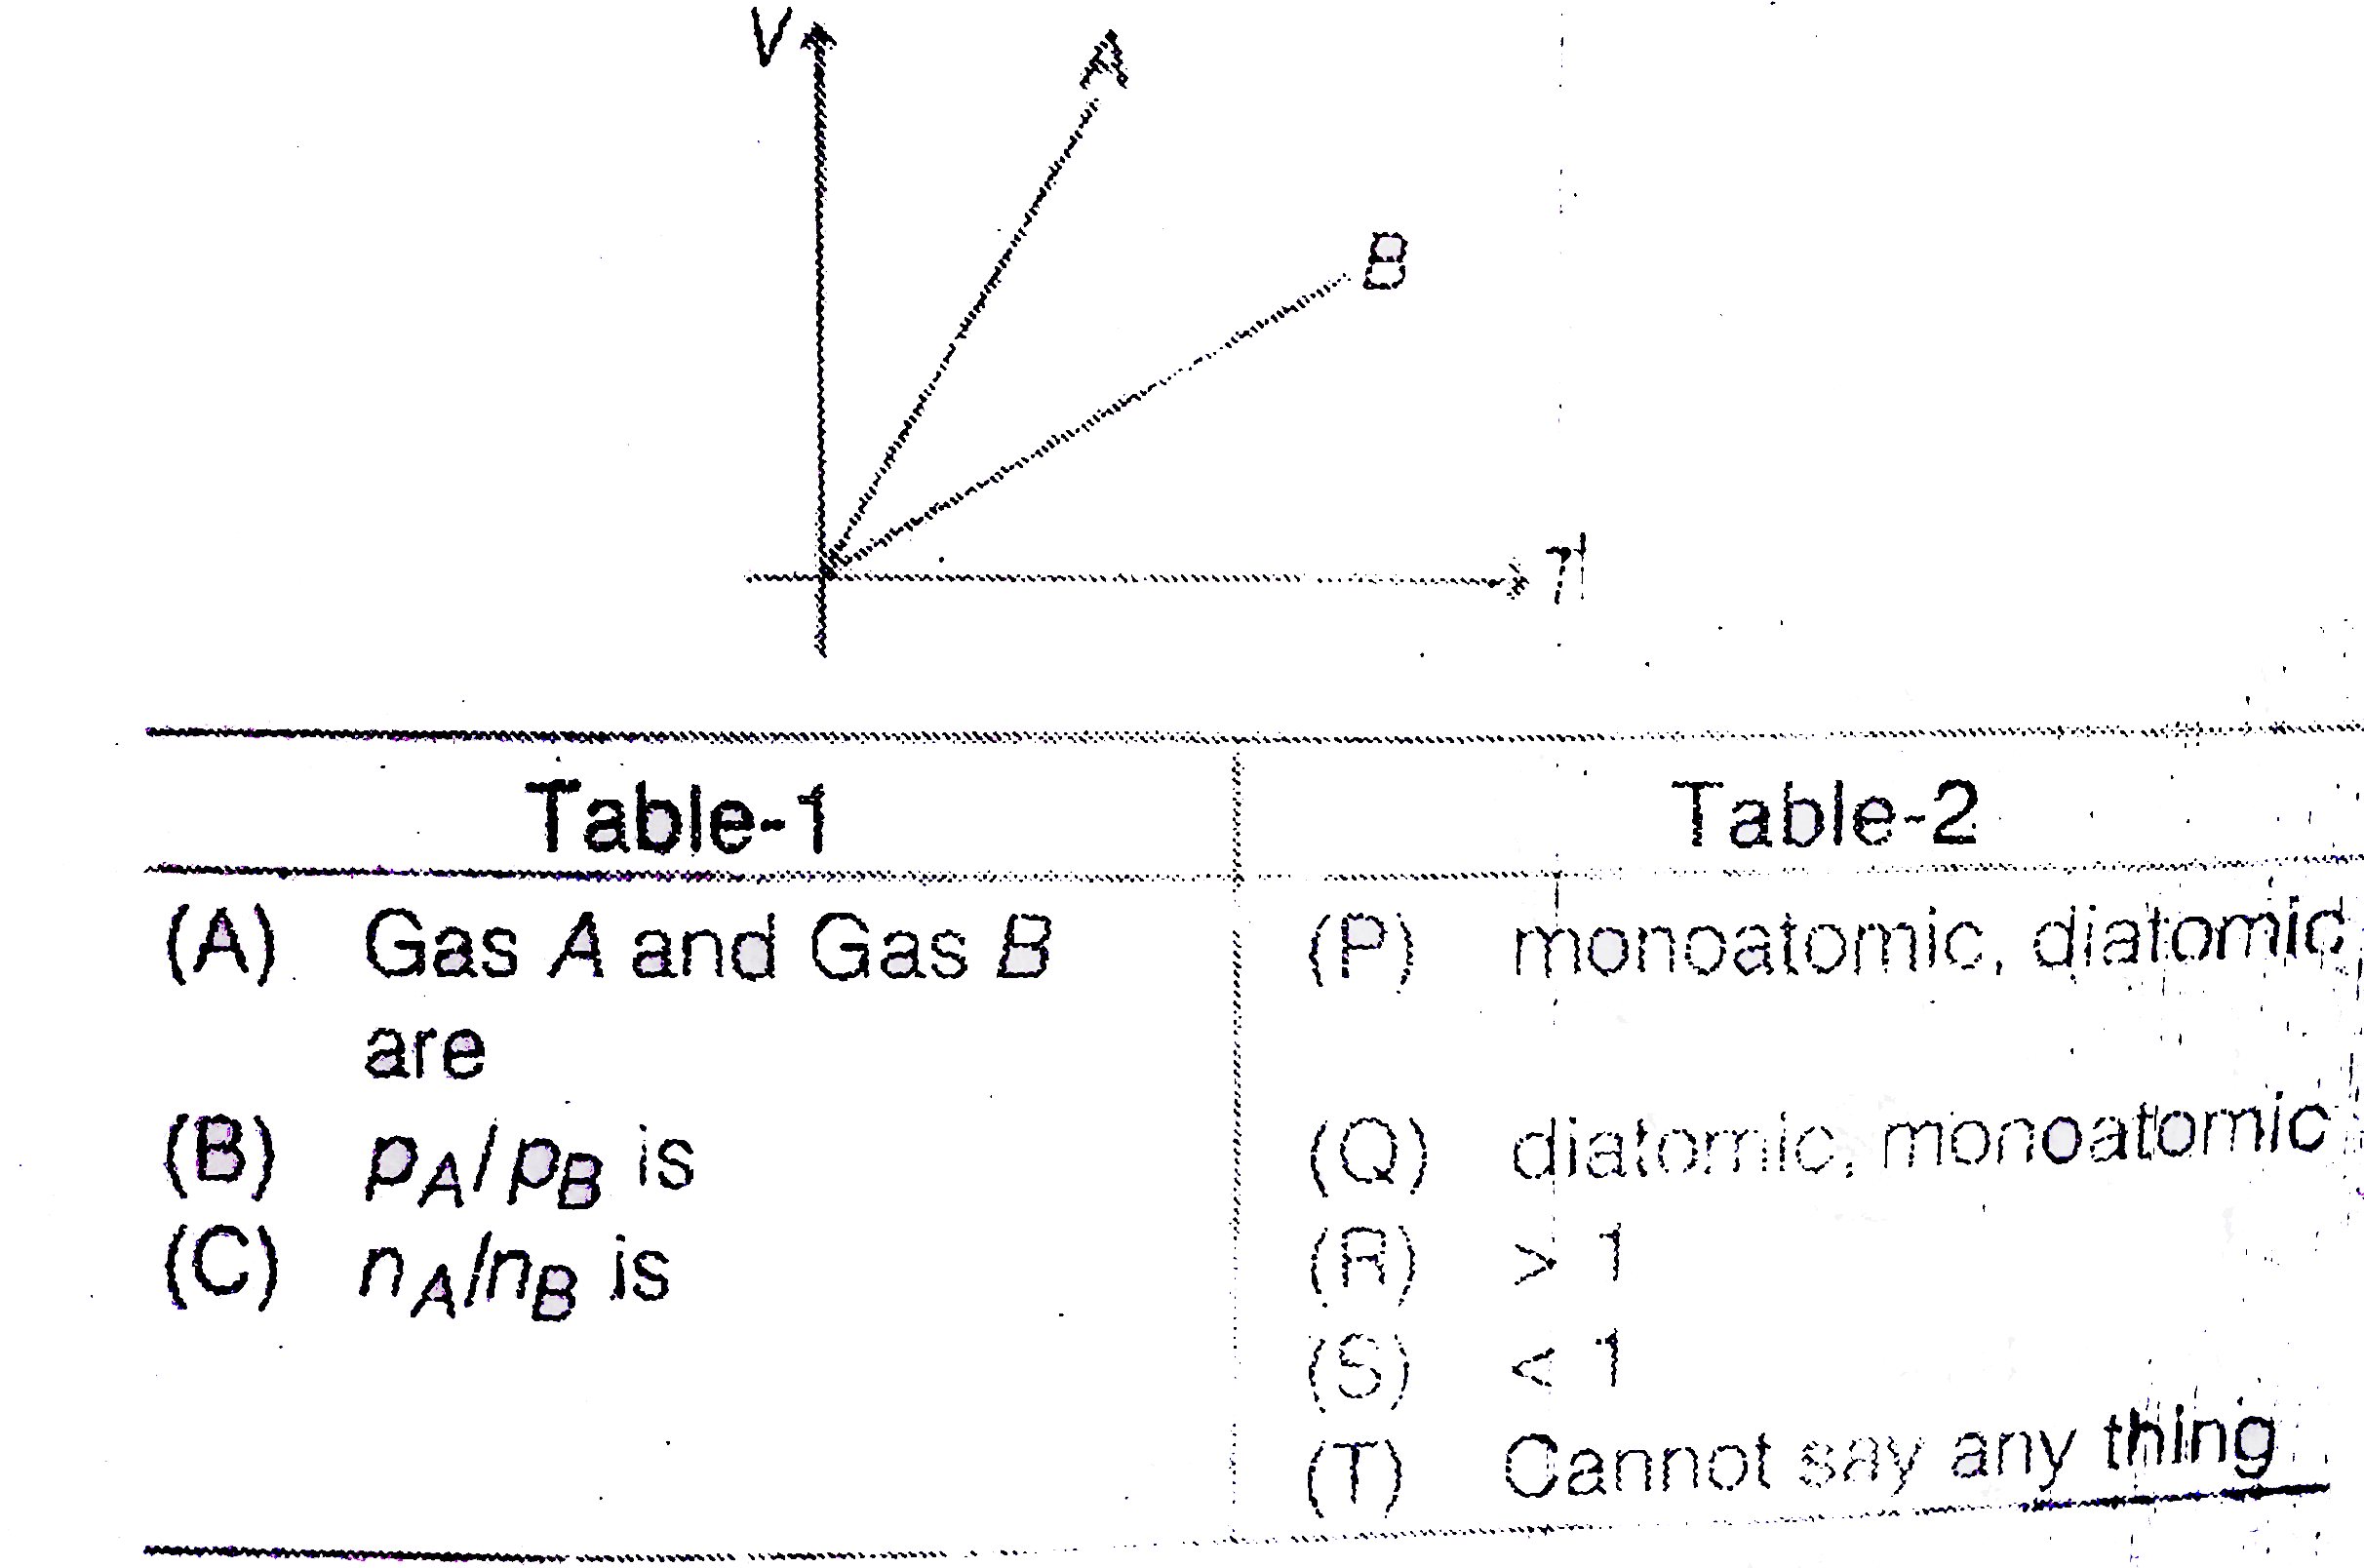
View SolutionIn the V-T graph shown in figure match the following.
View SolutionThe a -t graph is shown in the figure. The maximum velocity attained by the body from rest will be

View SolutionAssertion : In the s-t graph as shown in figure, velocity of particle is negative and acceleration is positive.
Reason : Slope of s-t graph is negative and increasing in magnitude.
View Solution
