Velocity-time graph for a particle is shown in following figure for time interval 0 to 2T.
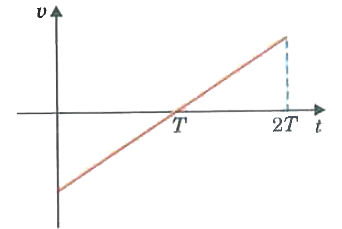
During the motion, particle reverse its direction of motion.
Particle is moving with constant acceleration
Net displacement in time interval 0 to 2T is zero.
Speeds of particle at t=0 and t=2T are same.
The correct Answer is:a,b,c,d
Initially velocity is negative and then after time T it becomes positive , so the particle has revesed its direction of motion. Option (a) is correct.
Slope of the v - t graph in acceleration and we can see that the slope of given graph is constant , hence the acceleration of particle remains constant. Option (b) is correct.
Area below and above the time axis are equal in given time interval hence the net displacement becomes zero. Option (c) is correct.
Speed of the particle after time 2T is same as speed of particle t = 0 . Option (d) is correct.
Topper's Solved these Questions
- BOOK - MODERN PUBLICATIONCHAPTER - MOTION IN A STRAIGHT LINE EXERCISE - COMPETITION FILE ( D.(MULTIPLE CHOICE QUESTIONS))9videos
MOTION IN A STRAIGHT LINE
- BOOK - MODERN PUBLICATIONCHAPTER - MOTION IN A STRAIGHT LINE EXERCISE - COMPETITION FILE (ASSERTION REASON)9videos
MOTION IN A STRAIGHT LINE
- BOOK - MODERN PUBLICATIONCHAPTER - MOTION IN A STRAIGHT LINE EXERCISE - COMPETITION FILE ( B.(MULTIPLE CHOICE QUESTIONS))74videos
MOTION IN A STRAIGHT LINE
- BOOK - MODERN PUBLICATIONCHAPTER - MOTION IN A PLANE EXERCISE - Chapter Practice Test15videos
MOTION IN A PLANE
- BOOK - MODERN PUBLICATIONCHAPTER - OSCILLATIONS EXERCISE - Practice Test (For Board Examination)12videos
OSCILLATIONS
Similar Questions
Knowledge Check
- Question 1 - Select One
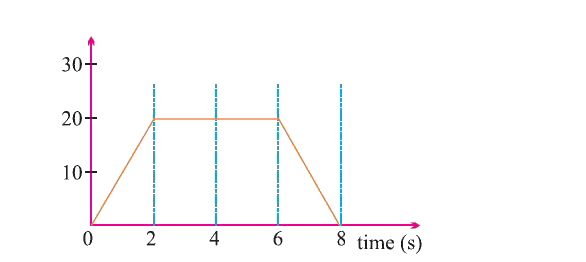
The velocity − time graph of a particle is as shown in figure
 AIt moves with a constant acceleration throughoutBIt moves with an acceleration of constant magnitude but changing direction at the end of every two secondCThe displacement of the particle is zeroDThe velocity becomes zero at t=4 second
 - Question 2 - Select One
Two particles A and B start from the origin along x-axis. Velocity time graph of both particles are shown in the figure. During the given time interval, the maximum separation between the particles is
 A4mB1mC2mD3m
 - Question 3 - Select One
Position - time graph for a particle is shown in figure. Starting from t = 0, at what time t, the average velocity is zer?
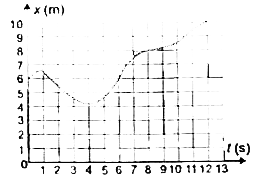 A1 sB3 sC6 sD7 s
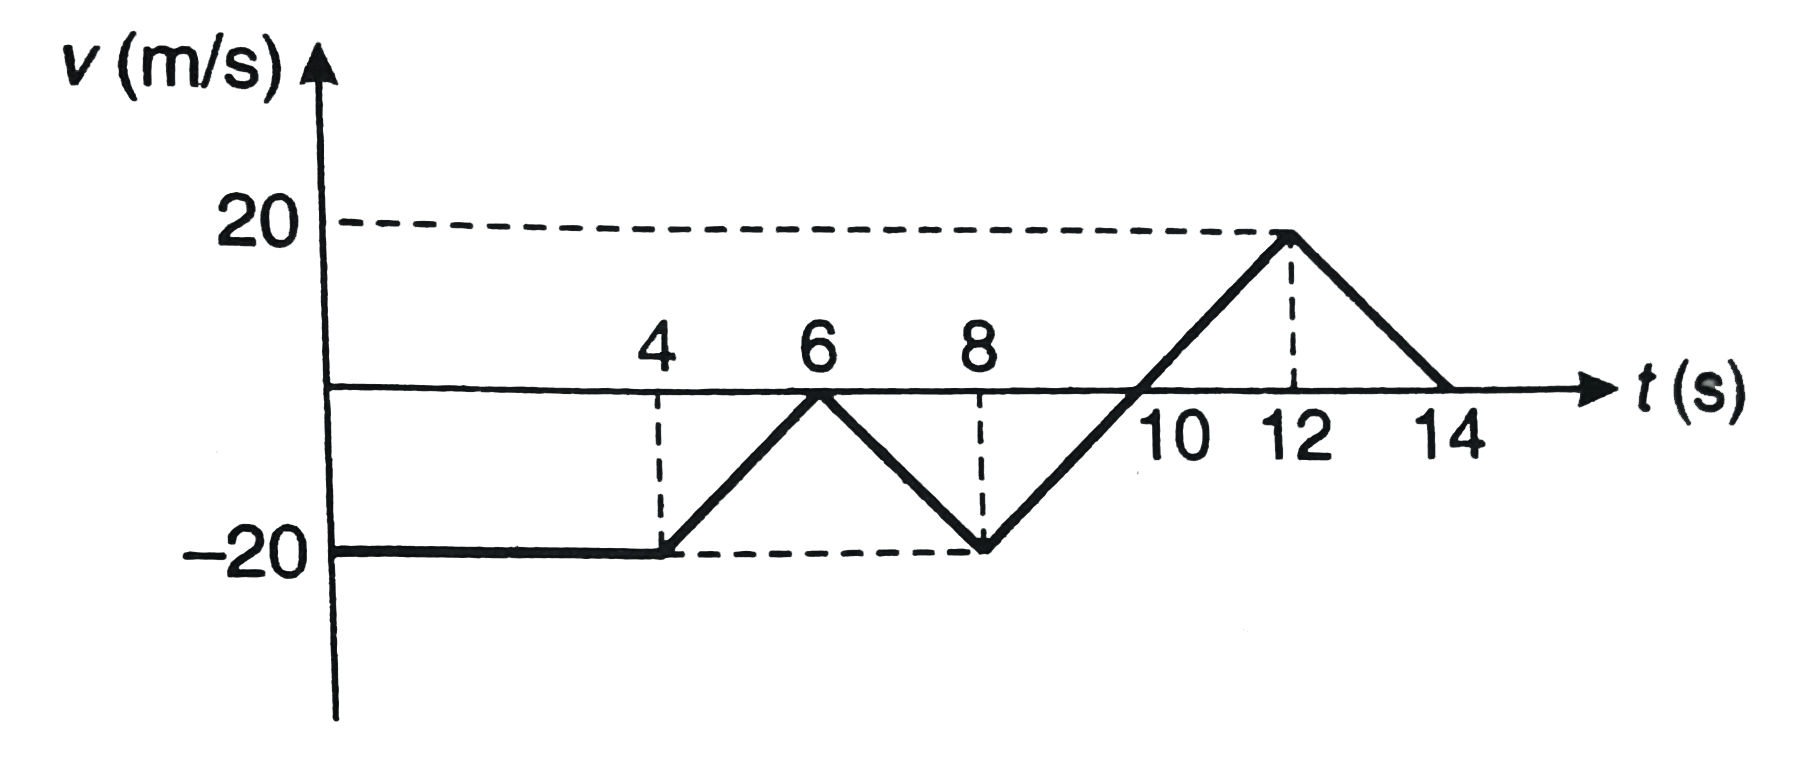
Velocity-time graph of a particle moving in a straight line is shown in figure. At time t=0.s=20m. Plot a-t and s-t graphs of the particle.
 View Solution
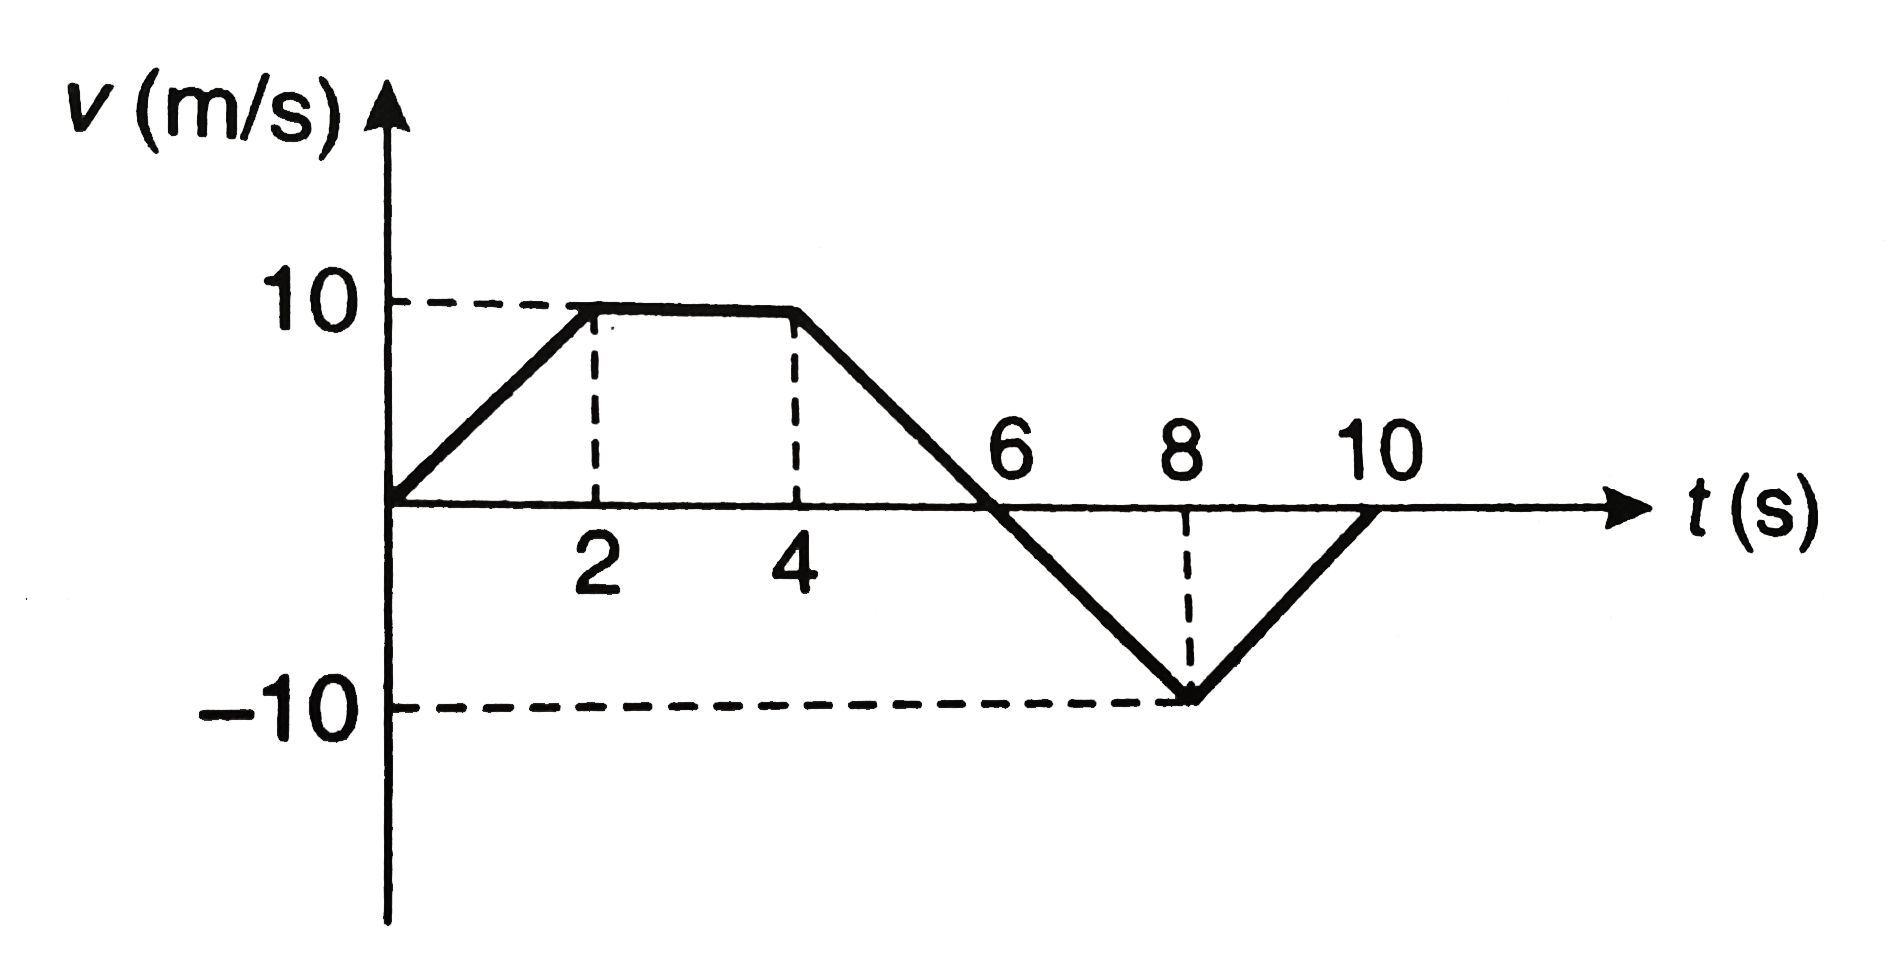
Velocity-time graph of a particle moving in a straight line is shown in figure. At time t=0,s=−10m. Plot corresponding a-t and s-t graphs.
 View Solution
Velocity-time graph of a particle moving in a straight line is shown in figure. In the time interval from t=0 to t=14s, find
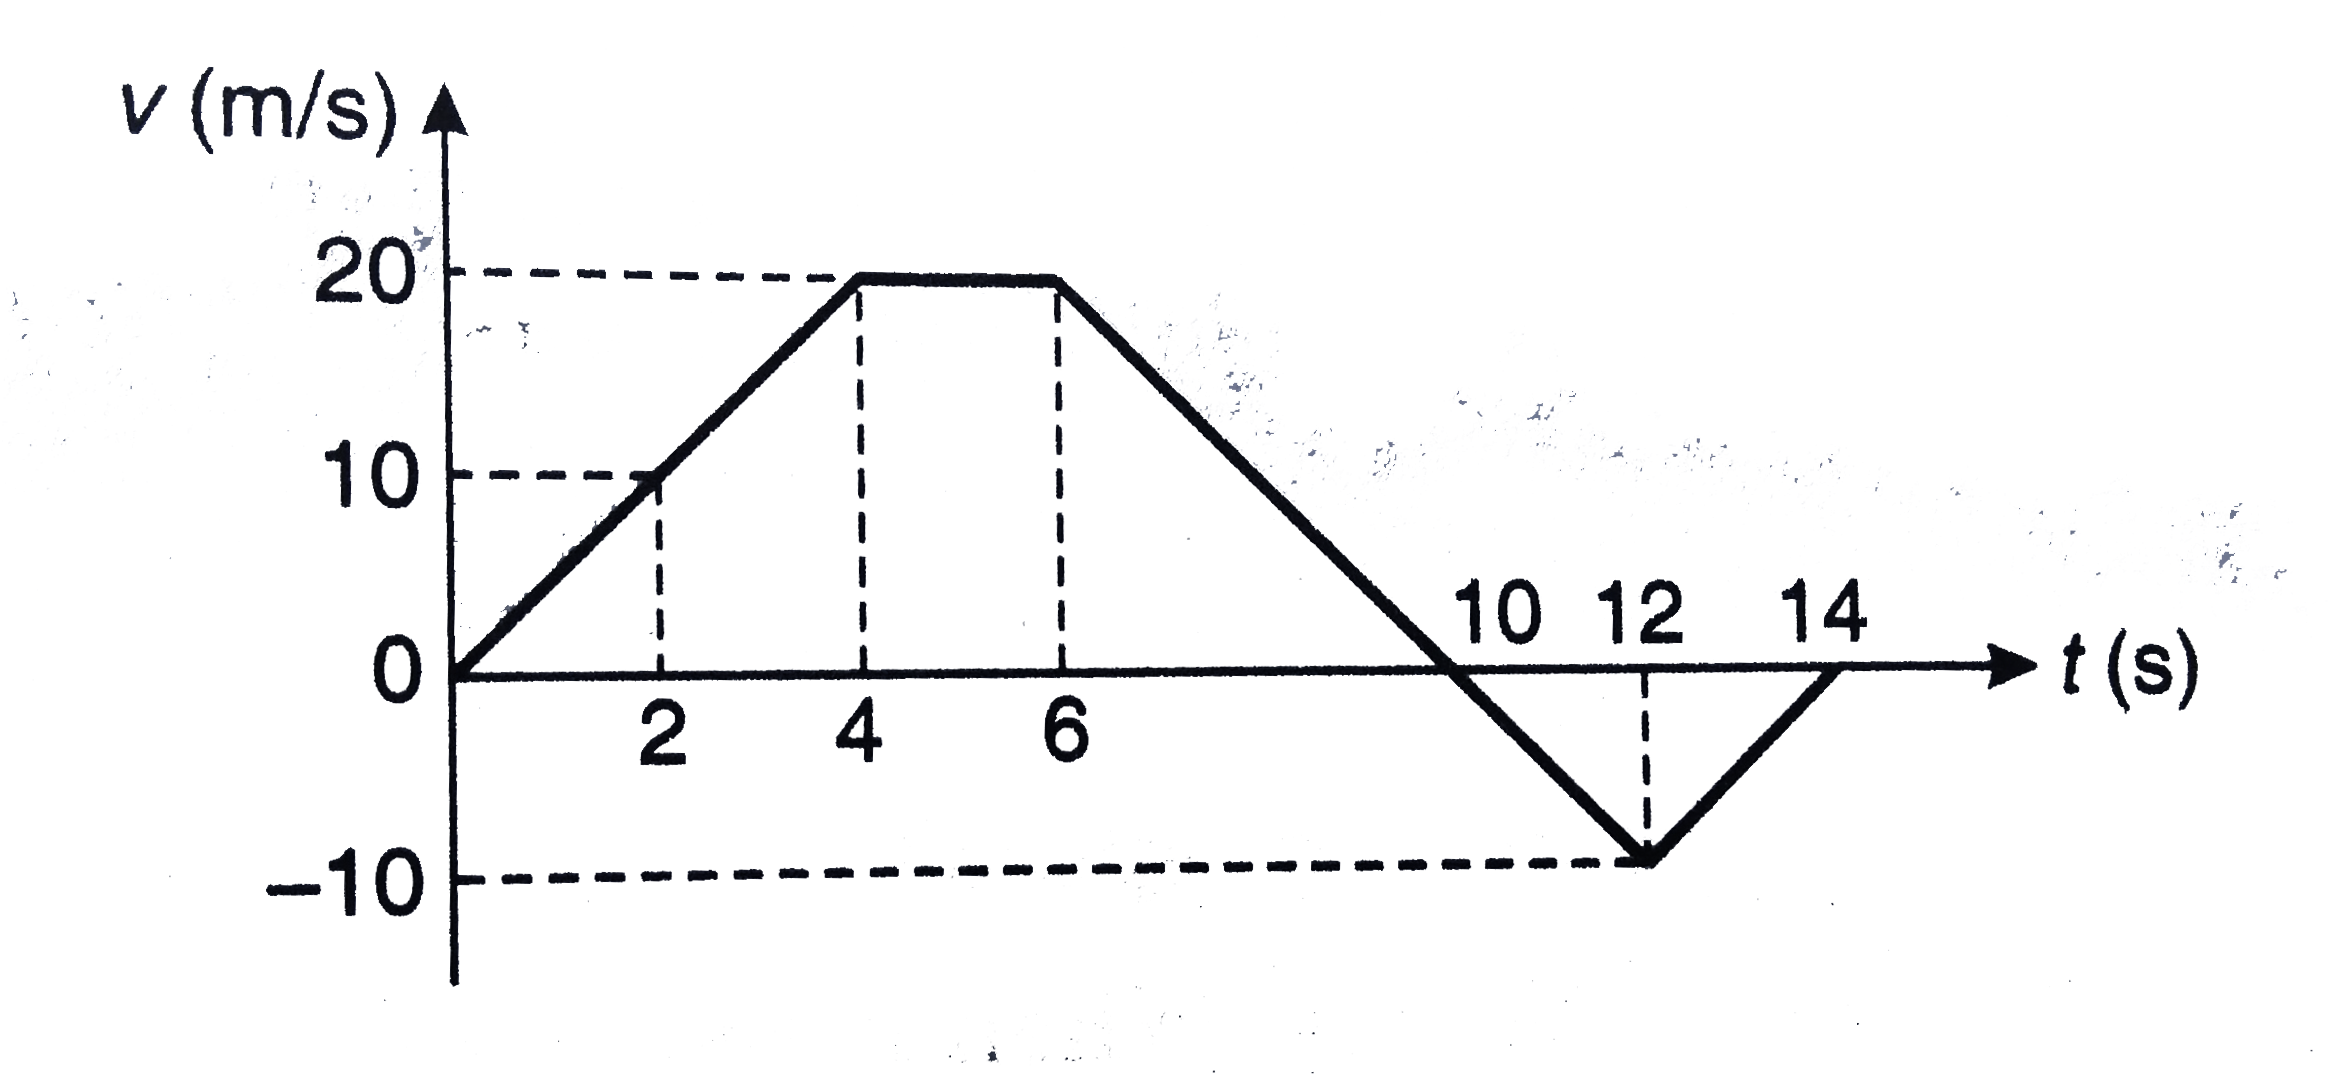
(a) average velocity and
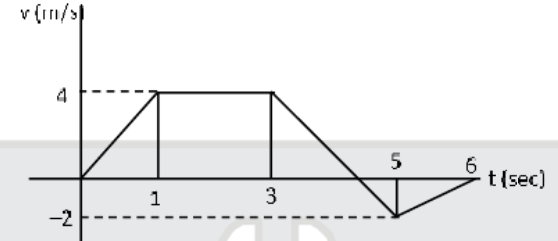
(b) average speed of the particle.View Solutionvelocity time graph of a particle is shown in figure. Find displacement of the particle.
 View Solution
The velocity-time (v – t) graph of a body is shown in the figure. For the intervals OP and PQ, the ratio of the distances covered is
 View Solution


