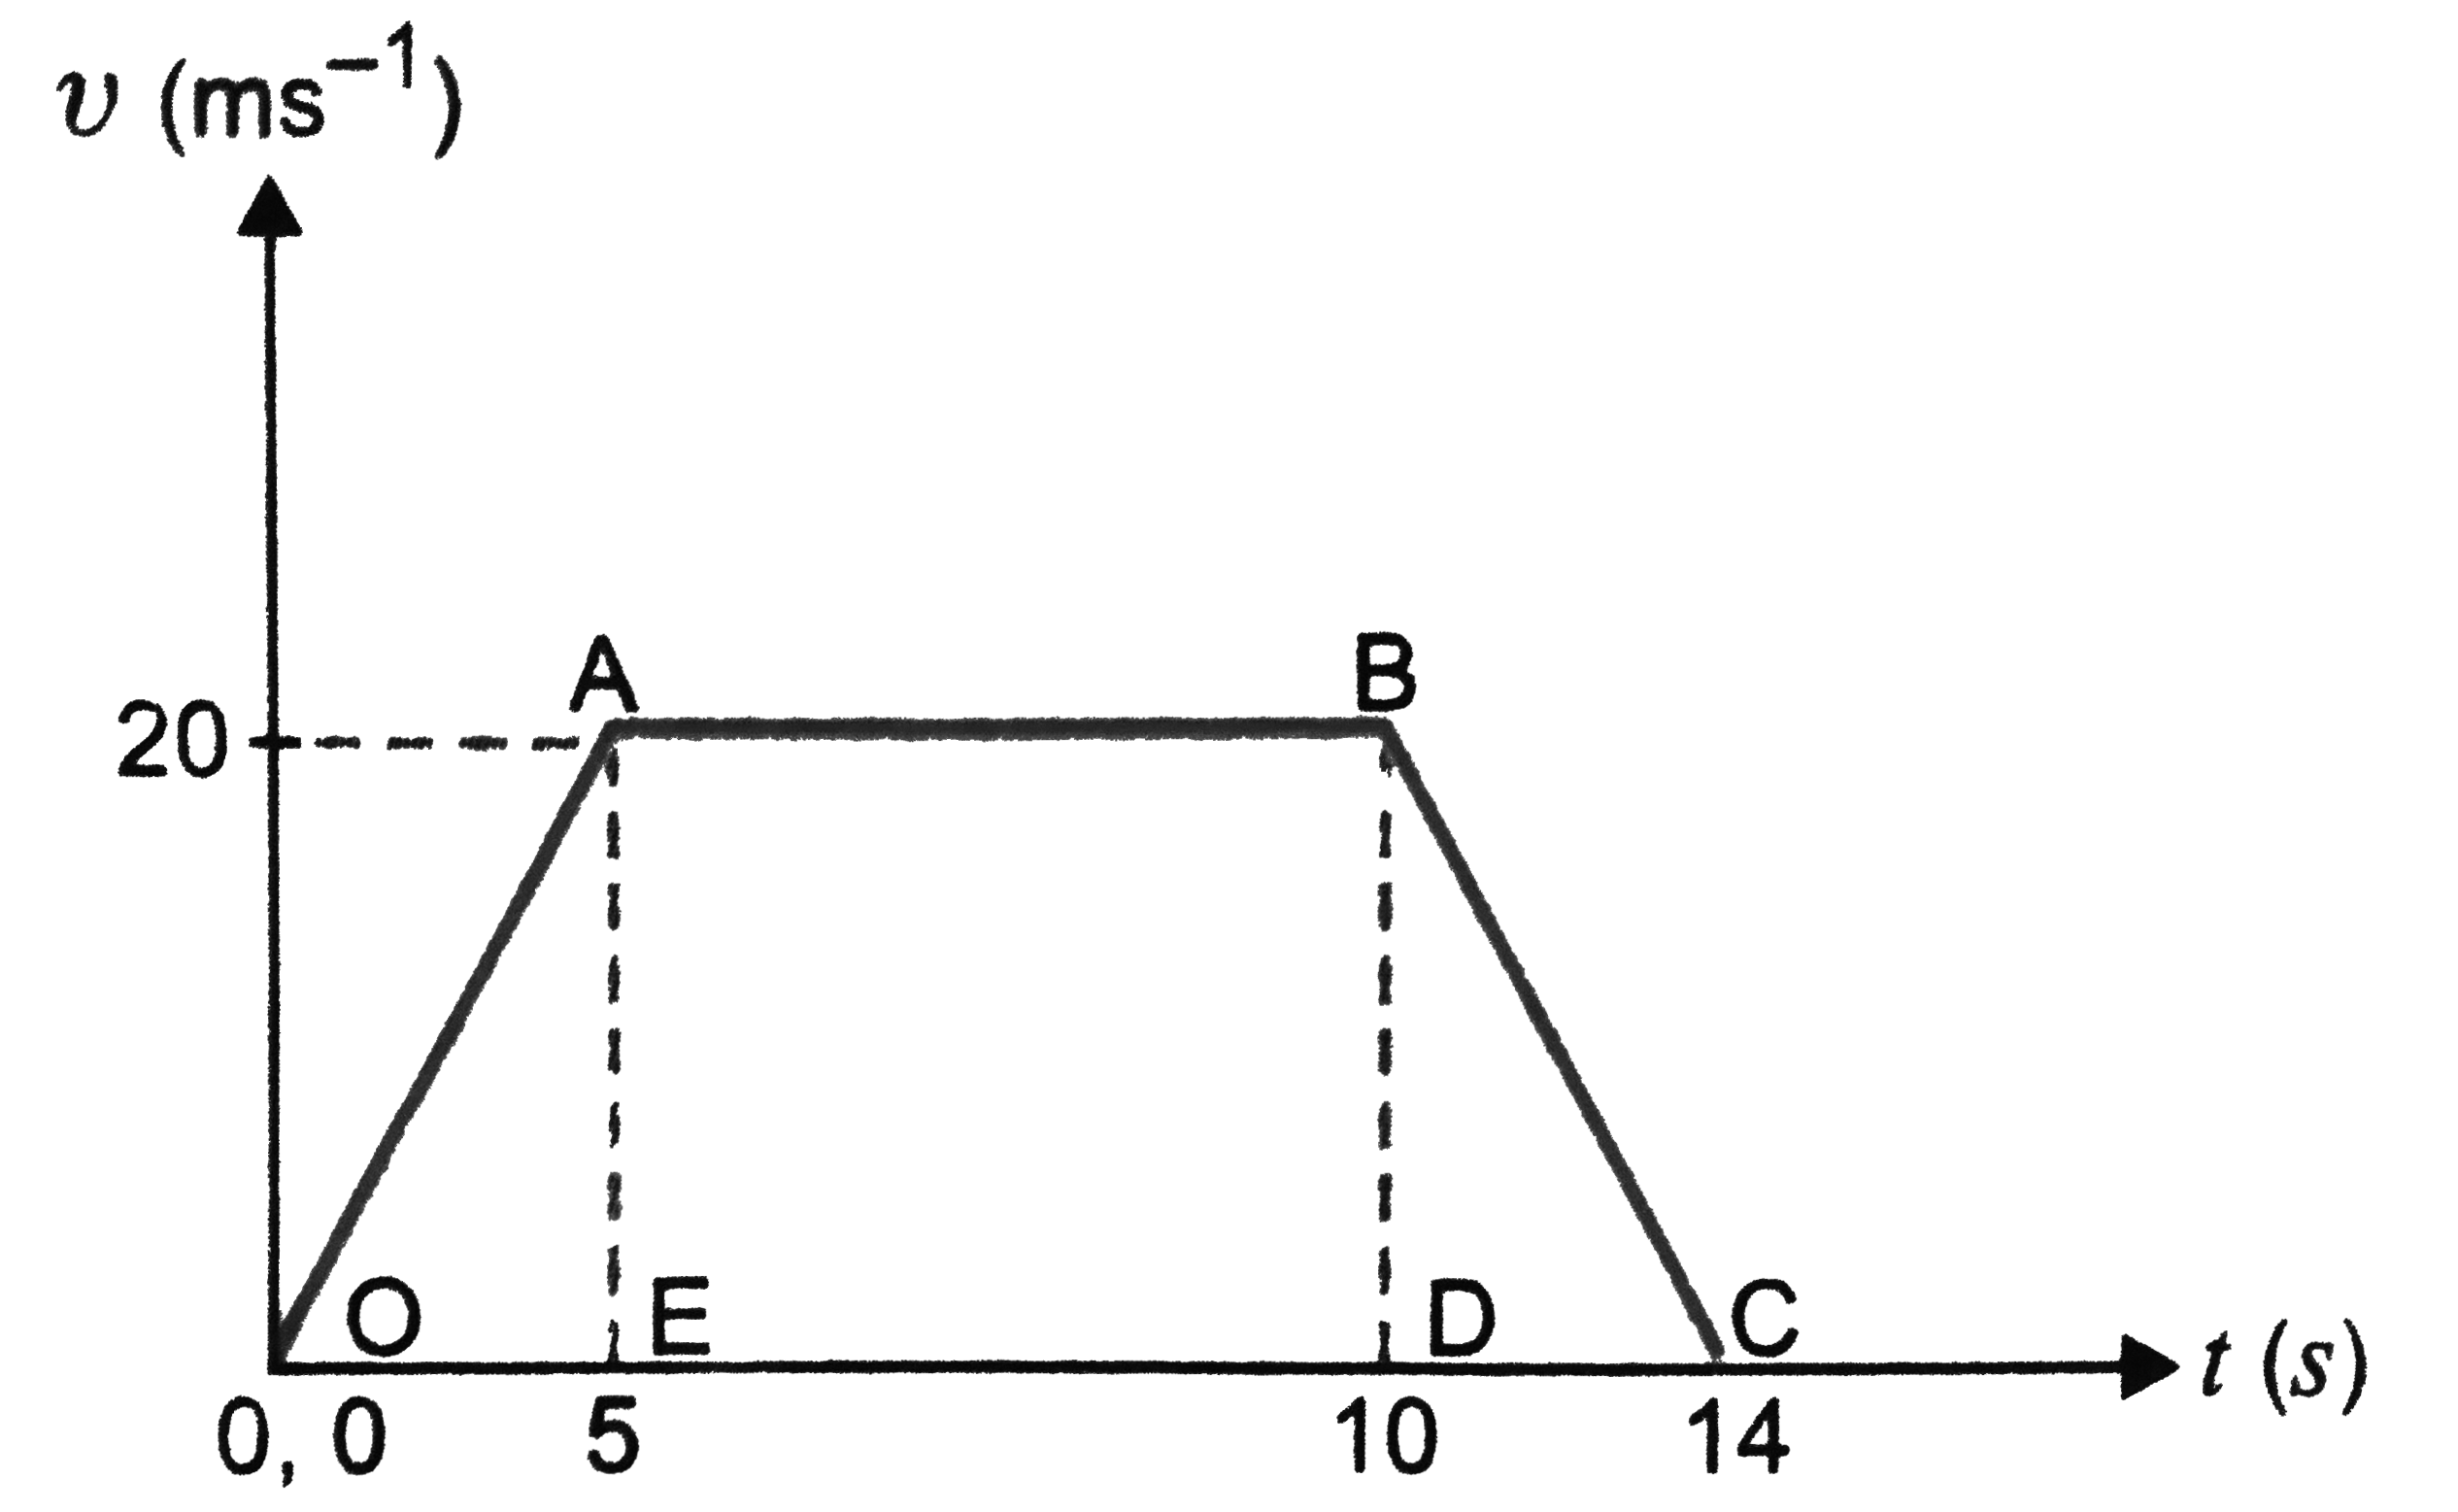
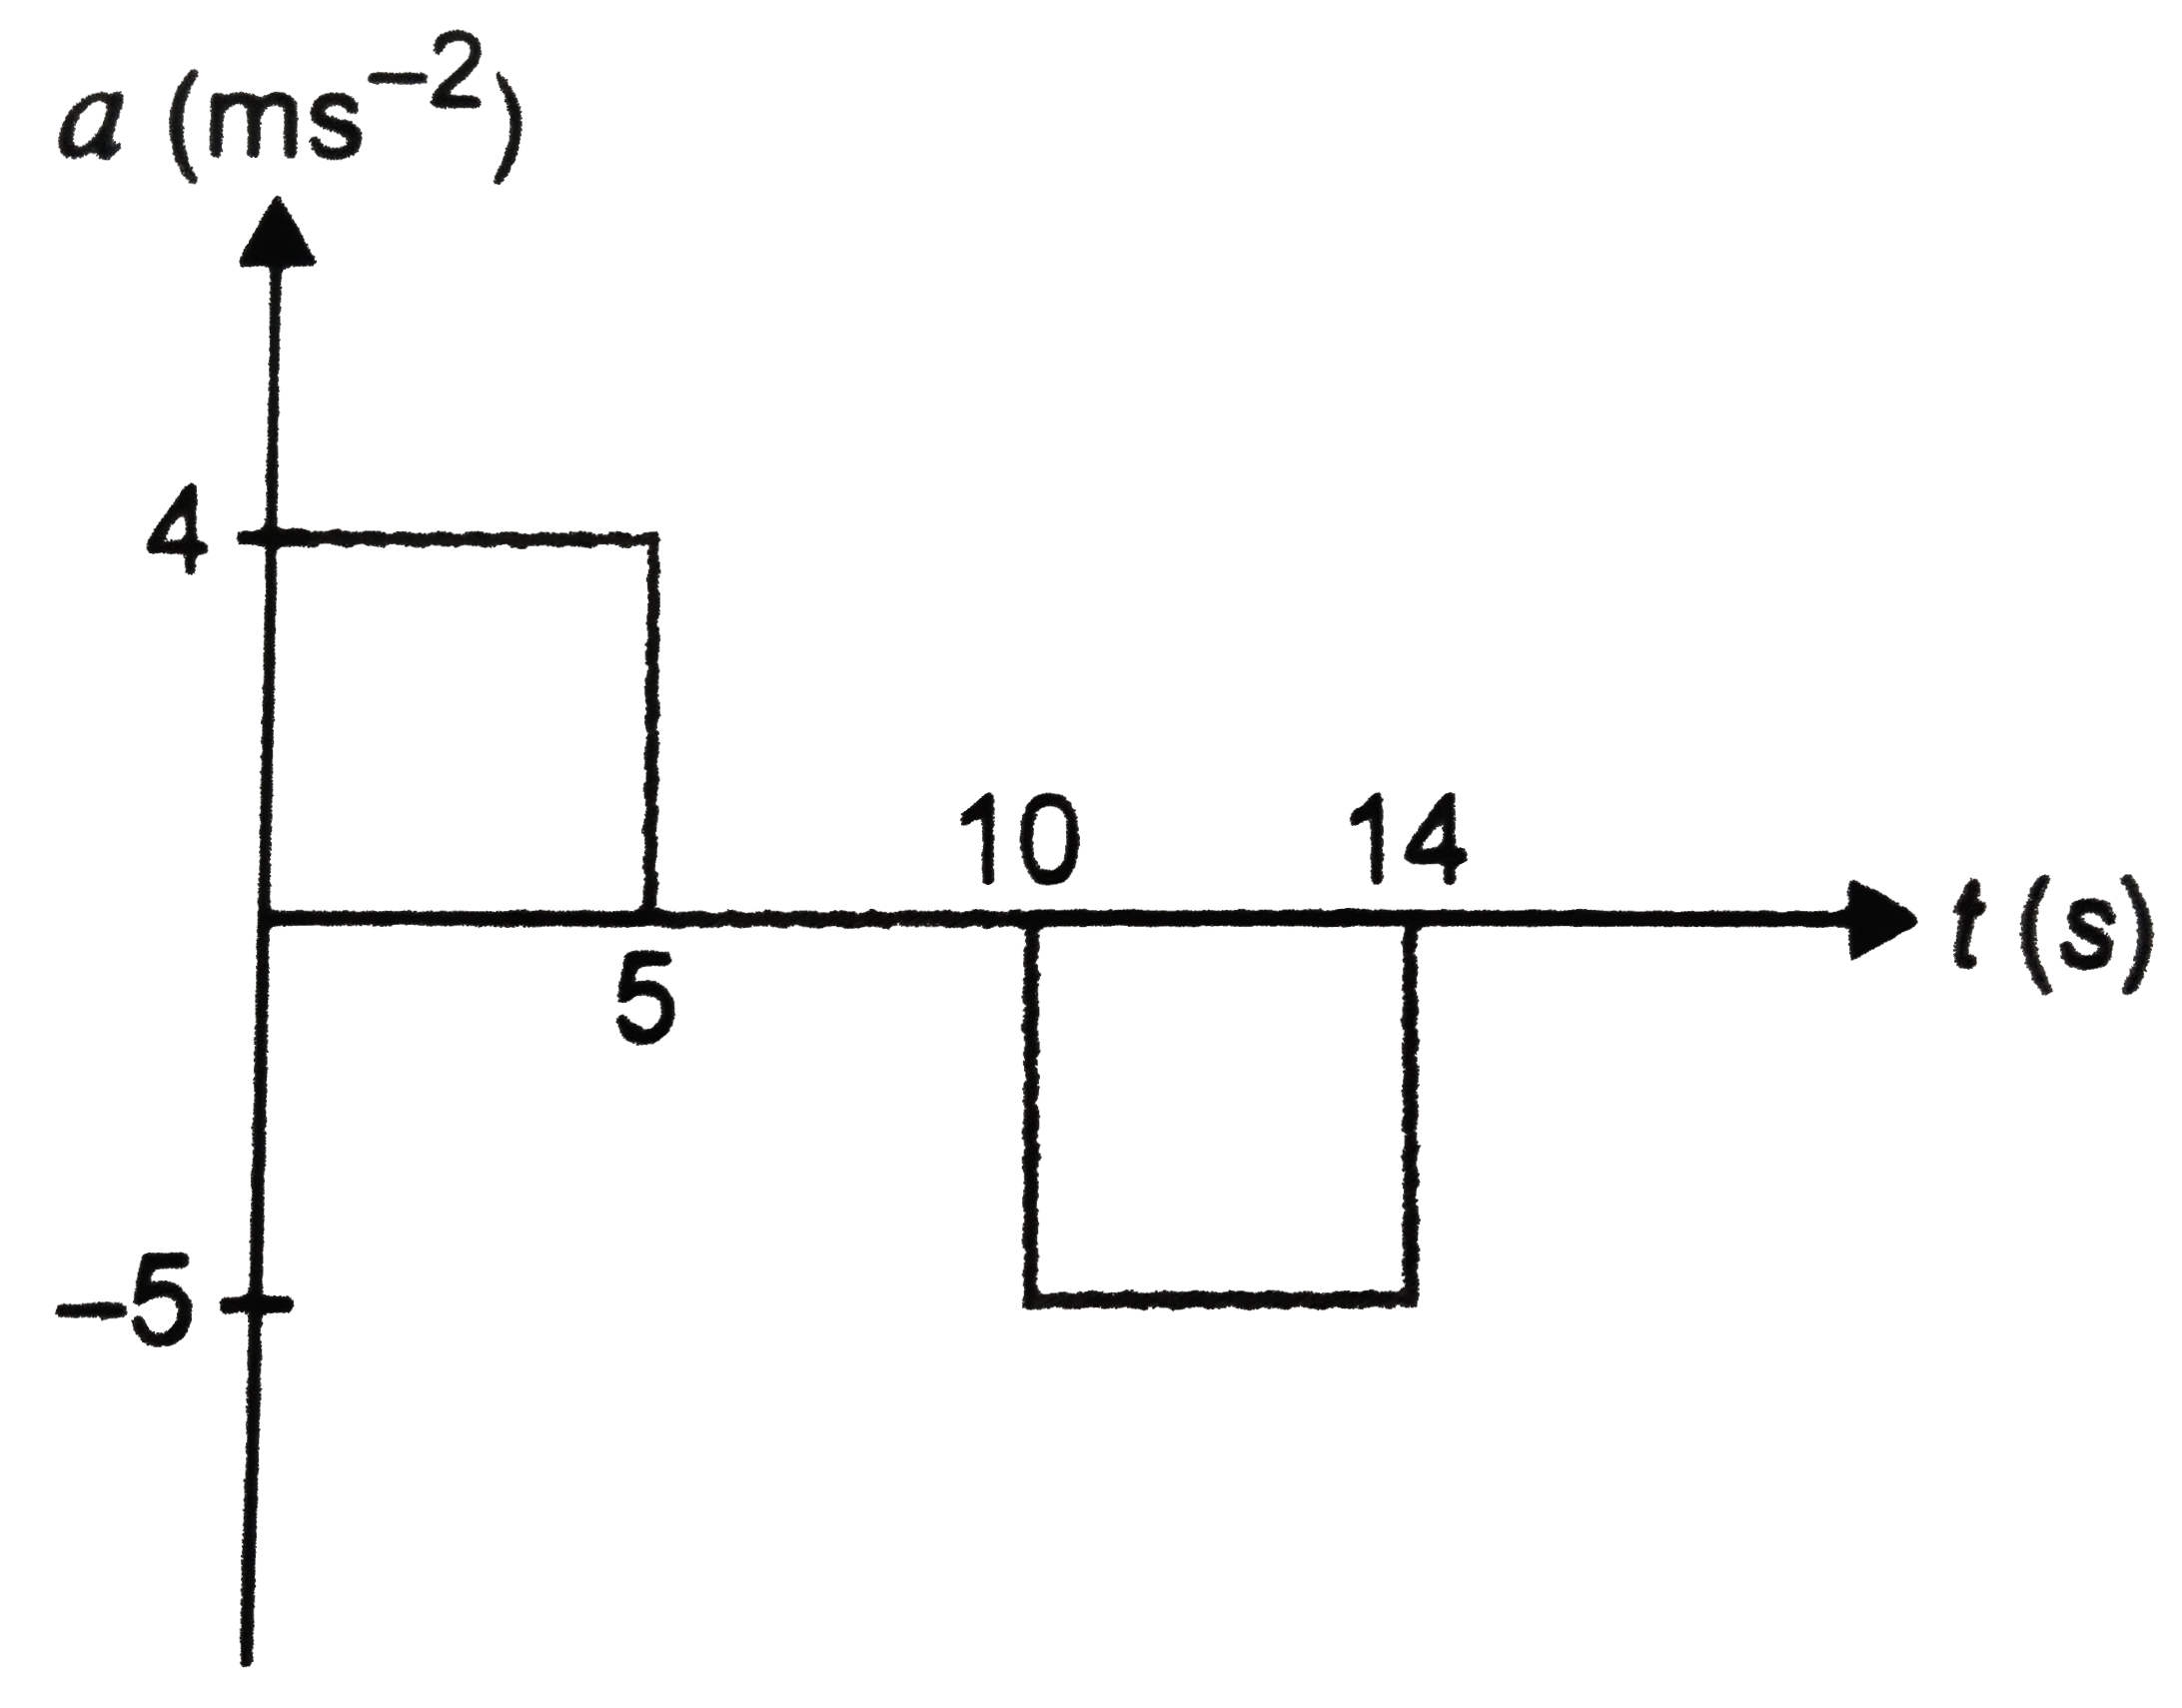
Velocity (v) time (t) graph of a car starting from rest is shown in Fig. 2(b). 13. Draw acceleration (a) -time (t) graph for the motion of the car and find total distance travelled by car.
 .
.
For the graph we bote that car starting from rest acclerates for time 0→5 s and attains a velcity 20ms−1 from 5s→10s. After that the motion of car is retarde for time 10s→14s and it comes to rest at time t=14s.
For time t0→t=5a,theae≤rationofcar<br>=slope of v−tgraph(20-0)/5 =4 ms^(-20.<br>Fortimet=10 s =10s, velocity of car is constant, hence acceleration is zero.
For time t=10s→t=14s
Acceleration of car =slpeofv-tgraphora=(0-200/4 =- ms^(-2)<br>Thusa≤ration(a)−time9t)graphisofthetypeasshown∈Fig.2(b).14.<br>Totaldistancetravel≤dbycar∈14 seconds =AreaOABC
=areaofDelta OAE +Area of squareabde<br>=(20 XX50/2 +(20XX5) + (20 XX4)/2<br>=50 +100 +40 =190 M
 .
.
Topper's Solved these Questions
- BOOK - PRADEEPCHAPTER - KINEMATICSEXERCISE - 3 SolvedExamples46videos
KINEMATICS
- BOOK - PRADEEPCHAPTER - KINEMATICSEXERCISE - 4 SolvedExamples31videos
KINEMATICS
- BOOK - PRADEEPCHAPTER - KINEMATICSEXERCISE - 1 SolvedExamples17videos
KINEMATICS
- BOOK - PRADEEPCHAPTER - GRAVIATIONEXERCISE - Assertion-Reason Type Questions19videos
GRAVIATION
- BOOK - PRADEEPCHAPTER - LAWS OF MOTIONEXERCISE - Assertion- Reason Type Questions17videos
LAWS OF MOTION
Similar Questions
Knowledge Check
- Question 1 - Select One or More
The velocity time graph of the motion of a car is given here.
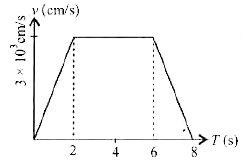 AThe distance travelled by the car in the first six seconds is 150 m.BThe deceleration of the car during the last two seconds are −15ms2.CThe distance travelled by the car in the first six second is 220 m.DThe deceleration of the car during the last two second is −20ms2
 - Question 2 - Select One
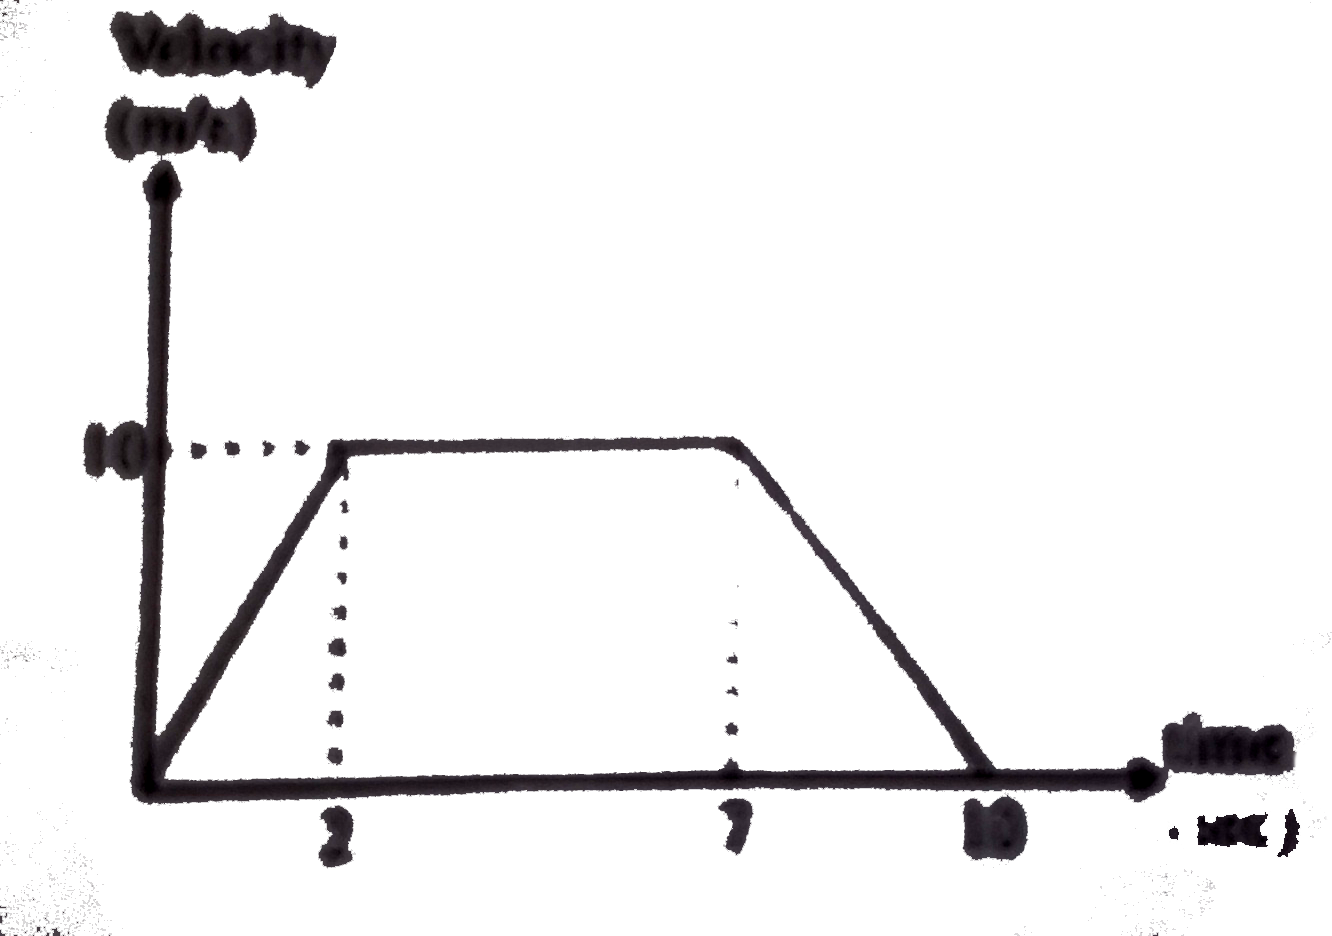
The velocity- time graph of car moving on a straight track is given below. The car weight 1000kg.
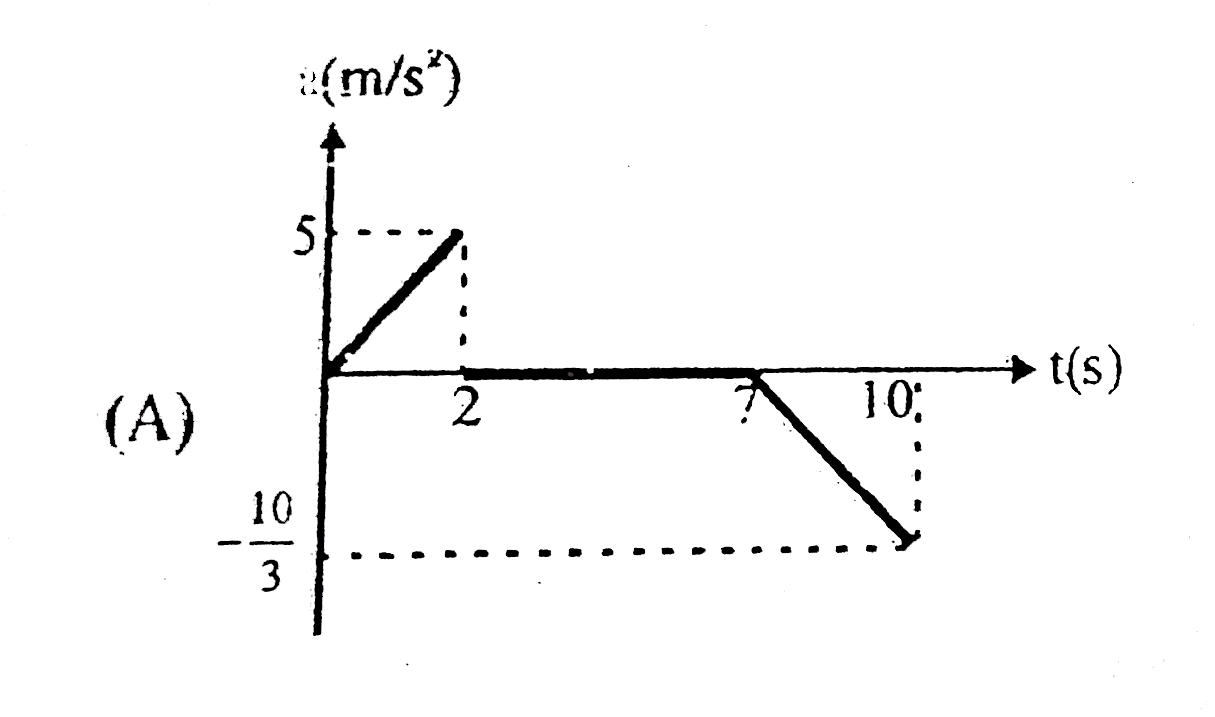
 correct acceleration-time graph representing the motion of car is:A
 B
B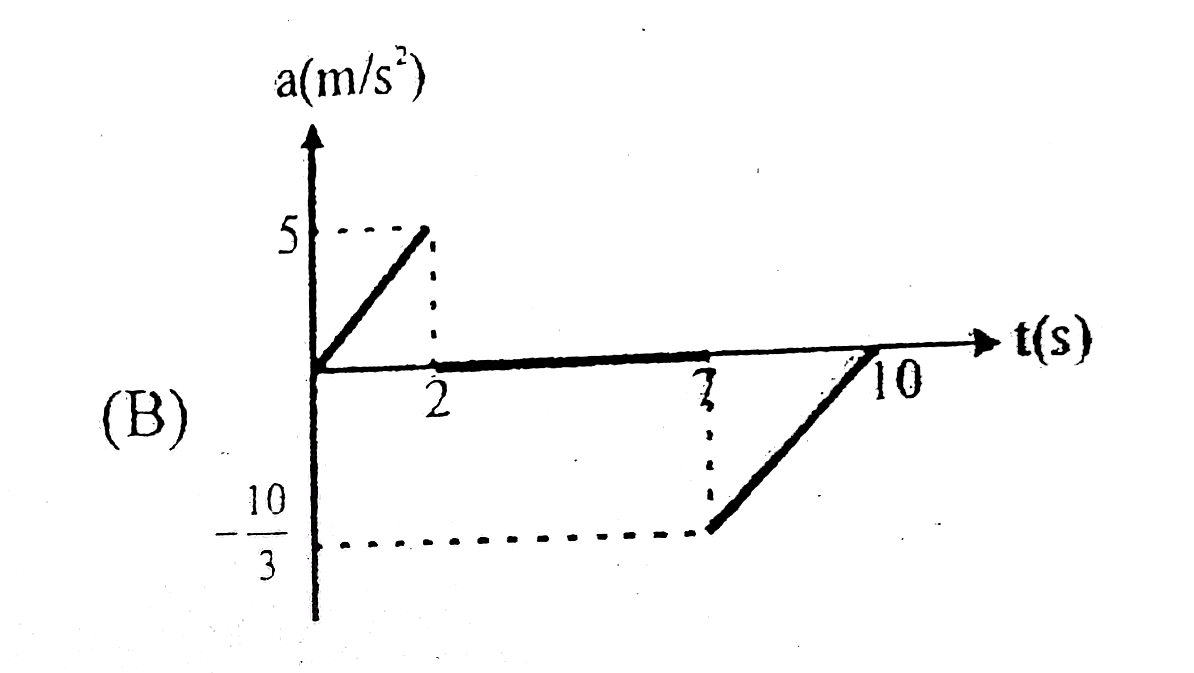 C
C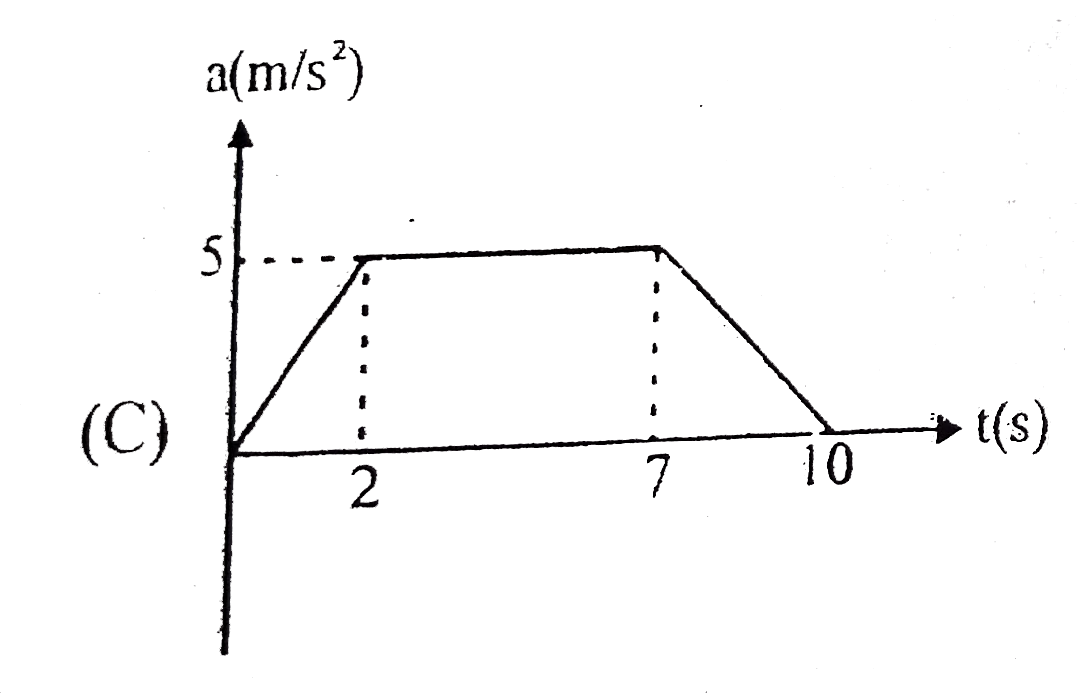 D
D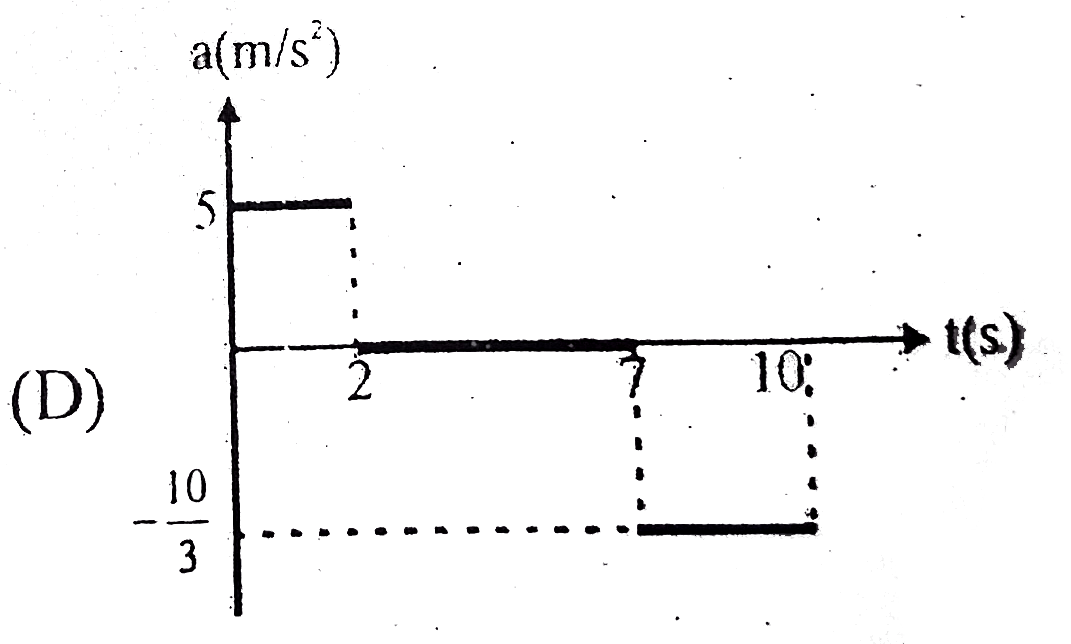
- Question 3 - Select One
Acceleration - time graph for a particle is given in figure. If it starts motion at t = 0, distance travelled in 3 s will be
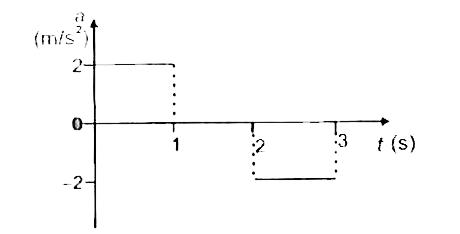 A4 mB2 mC0D6 m
The distance versus time graph of a car is shown in the given figure.
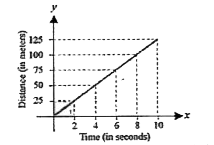 View Solution
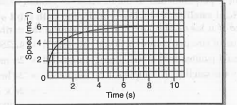
The speed-time graph for a car is shown is Figure
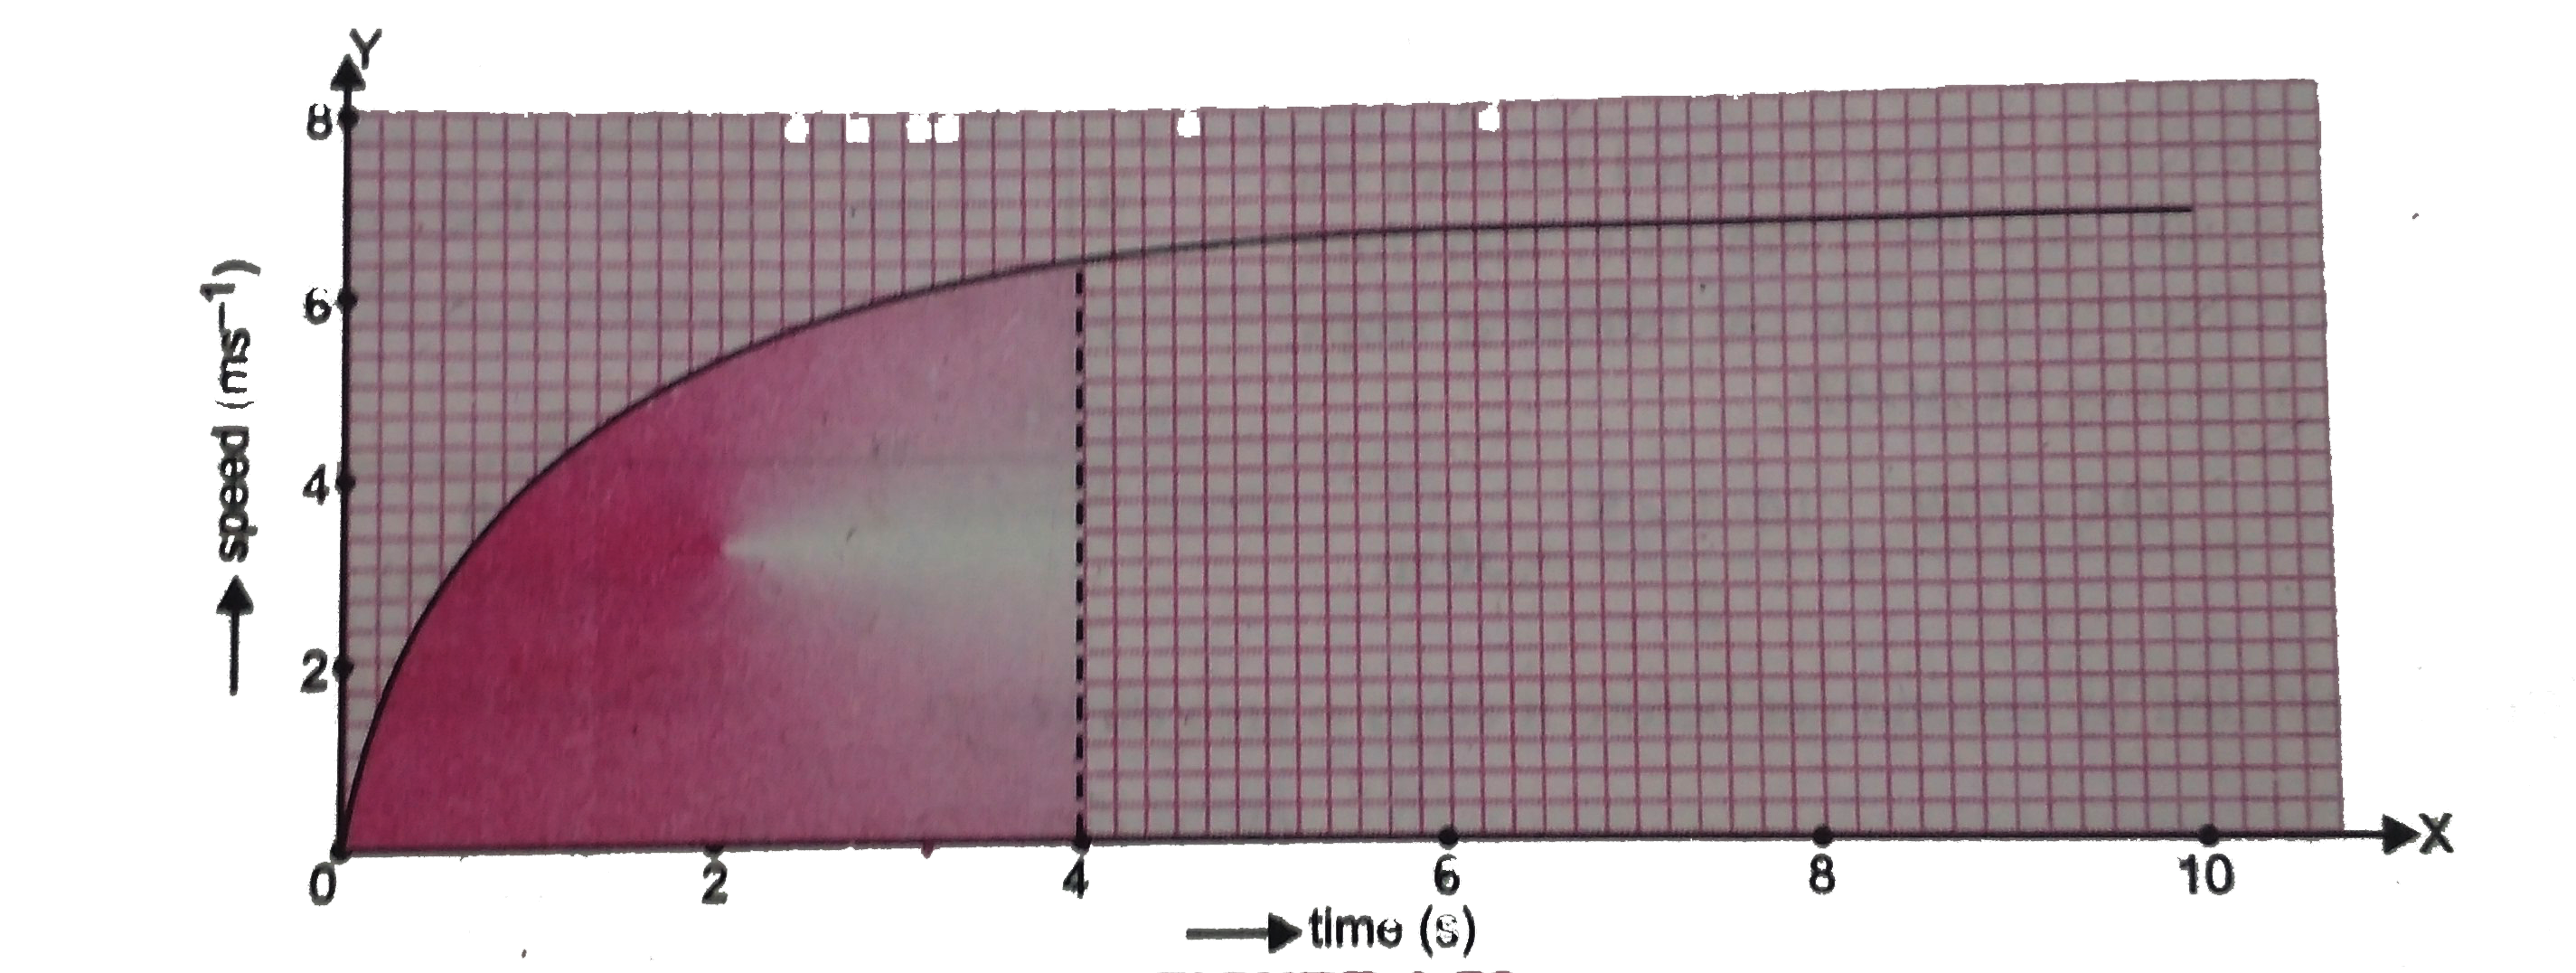
(a) Find how far does the car travel in the first 4 seconds. Shade the area on the graph that represents the distance travelled by the car during this period.
(b) Which part of the graph represents uniform motion of the car ?View SolutionA car accelerates from rest at acionstant rate 36kmh∘ to comet to rest. If the total time elapsed id 1 hour, calculate (i) the maximum velocity attained by the car and (ii) the total distance travelled by car.
View Solutionstarting form rest a cars moves with unifrom acceleration and attians a velocity of 20ms−1and4s. It then moves what a unifrom velocity of 20ms−1 for 6s. The brakes are applied and the car is brought to rest in 10s under unifrom retardation . Draw the velocity group for the motion. using theis graph , find (i) the acceleration of the car during the frist 4 s (ii) ua retardation during the last 10 s and (iii) the total distance traveled by the car .
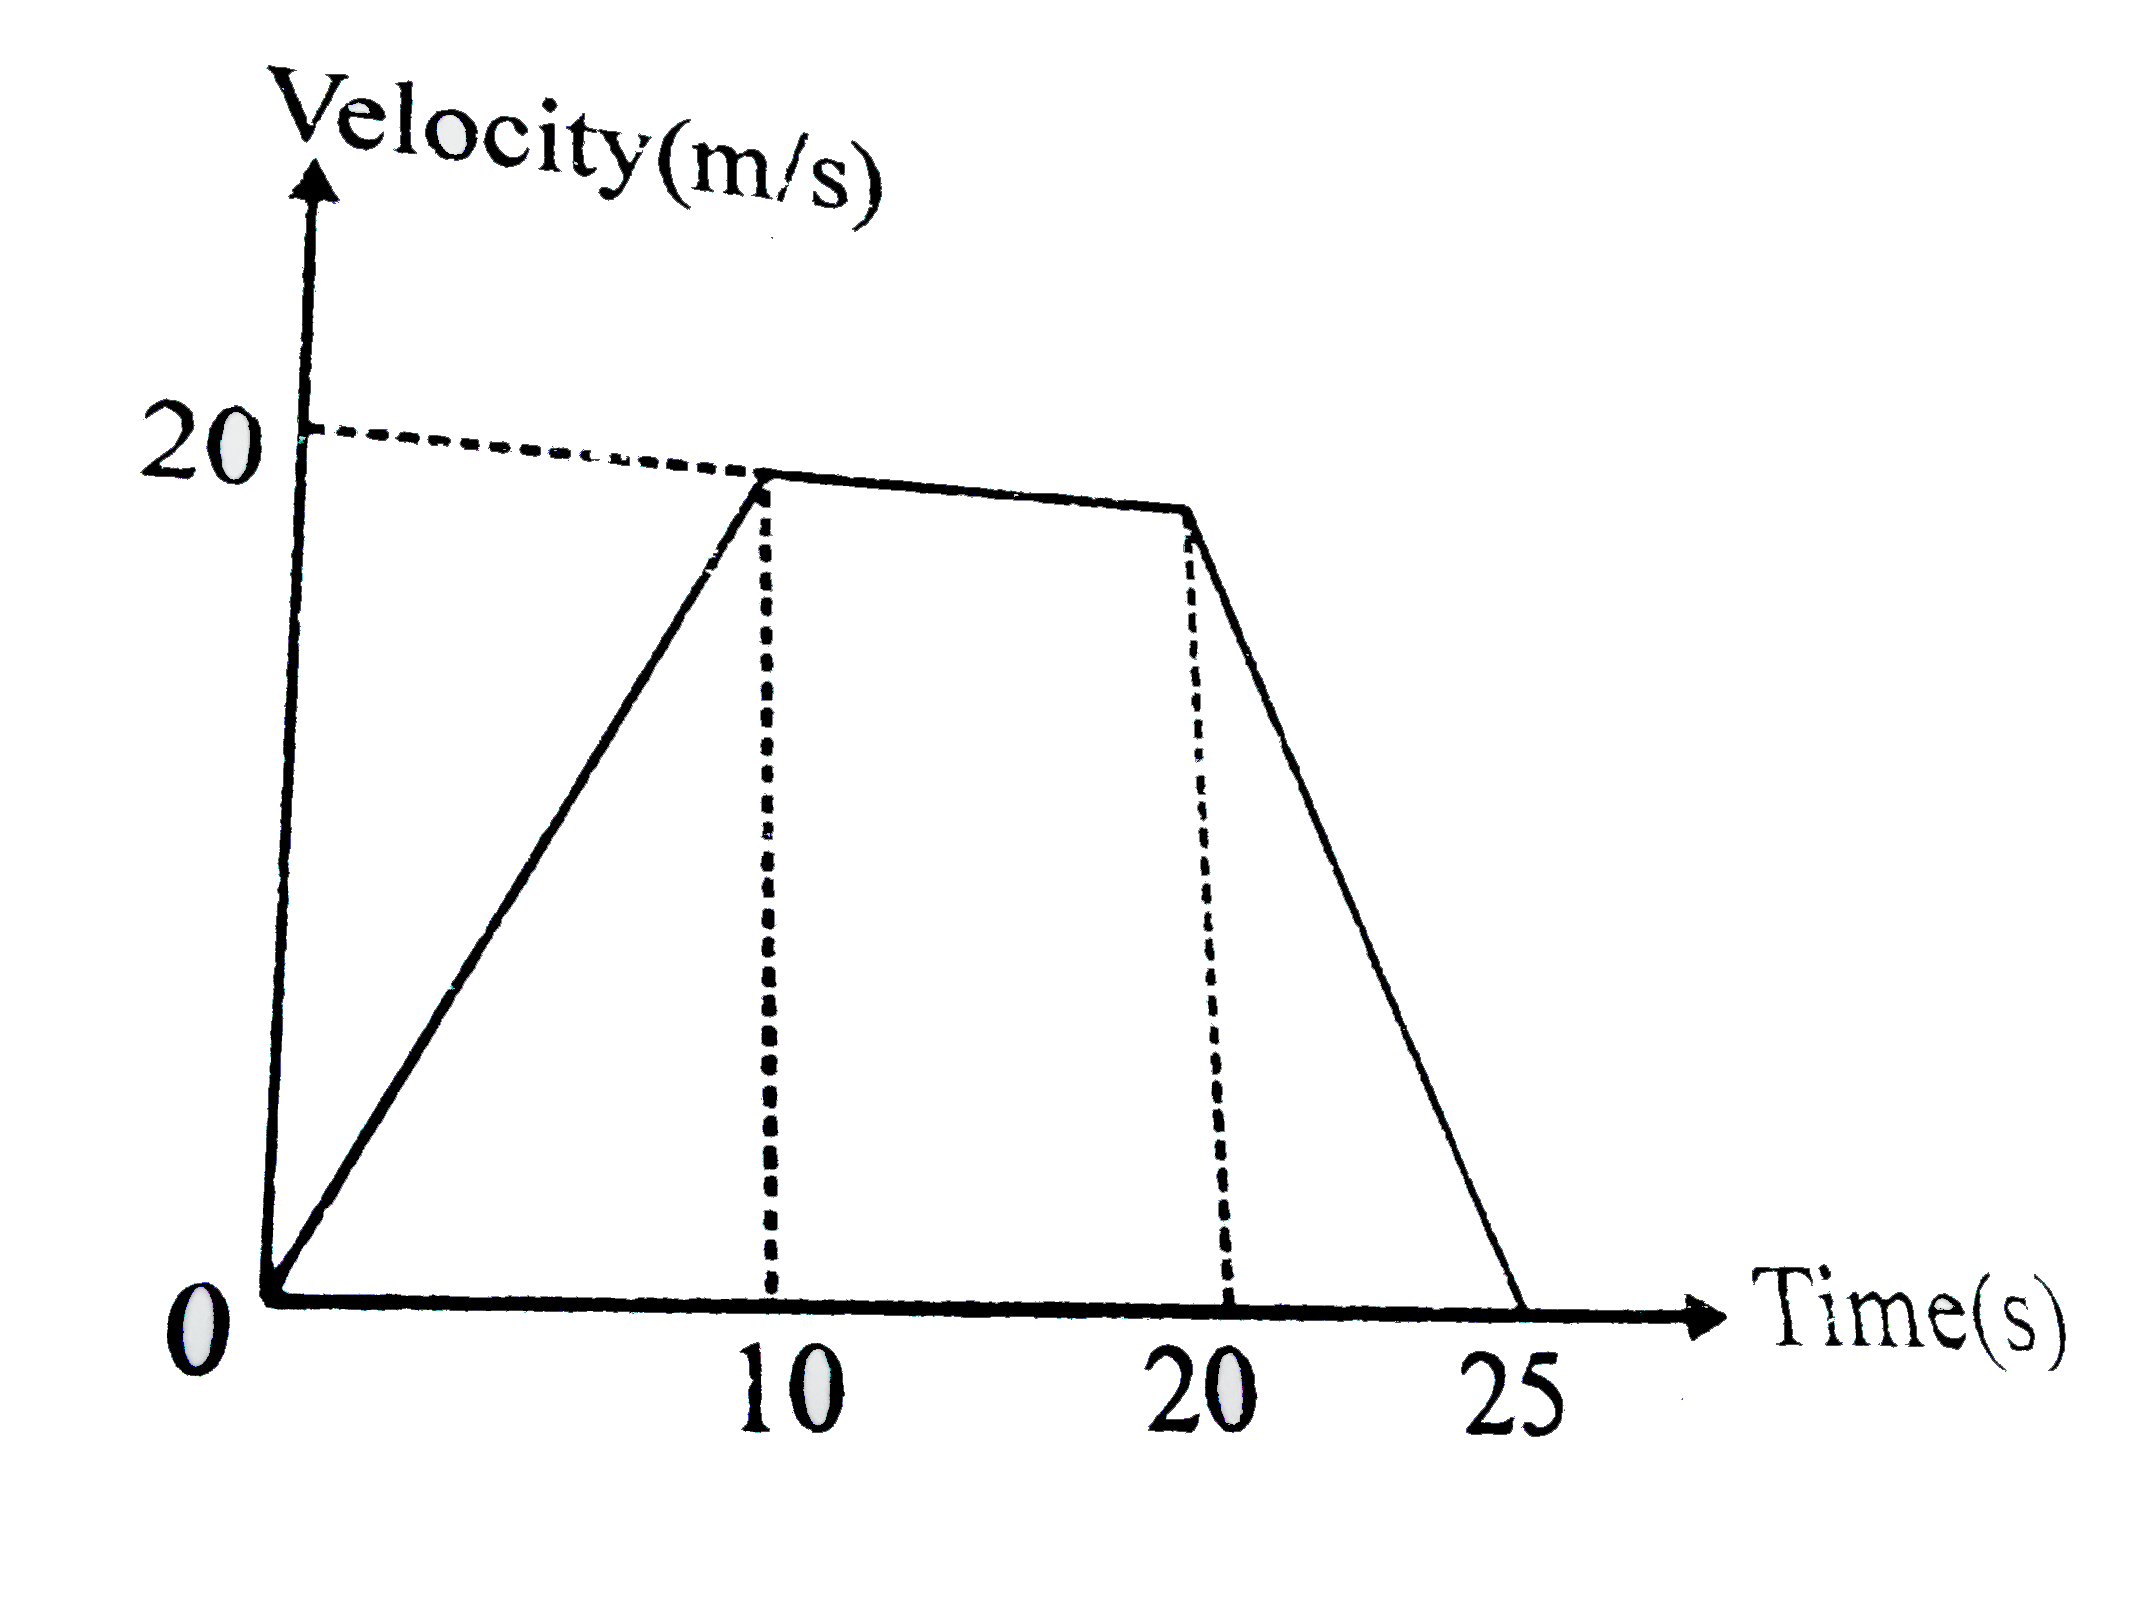
View SolutionThe velocity-time graph of a car moving along a straight road is shown in figure. The average velocity of the car in first 25 seconds is
 View Solution


