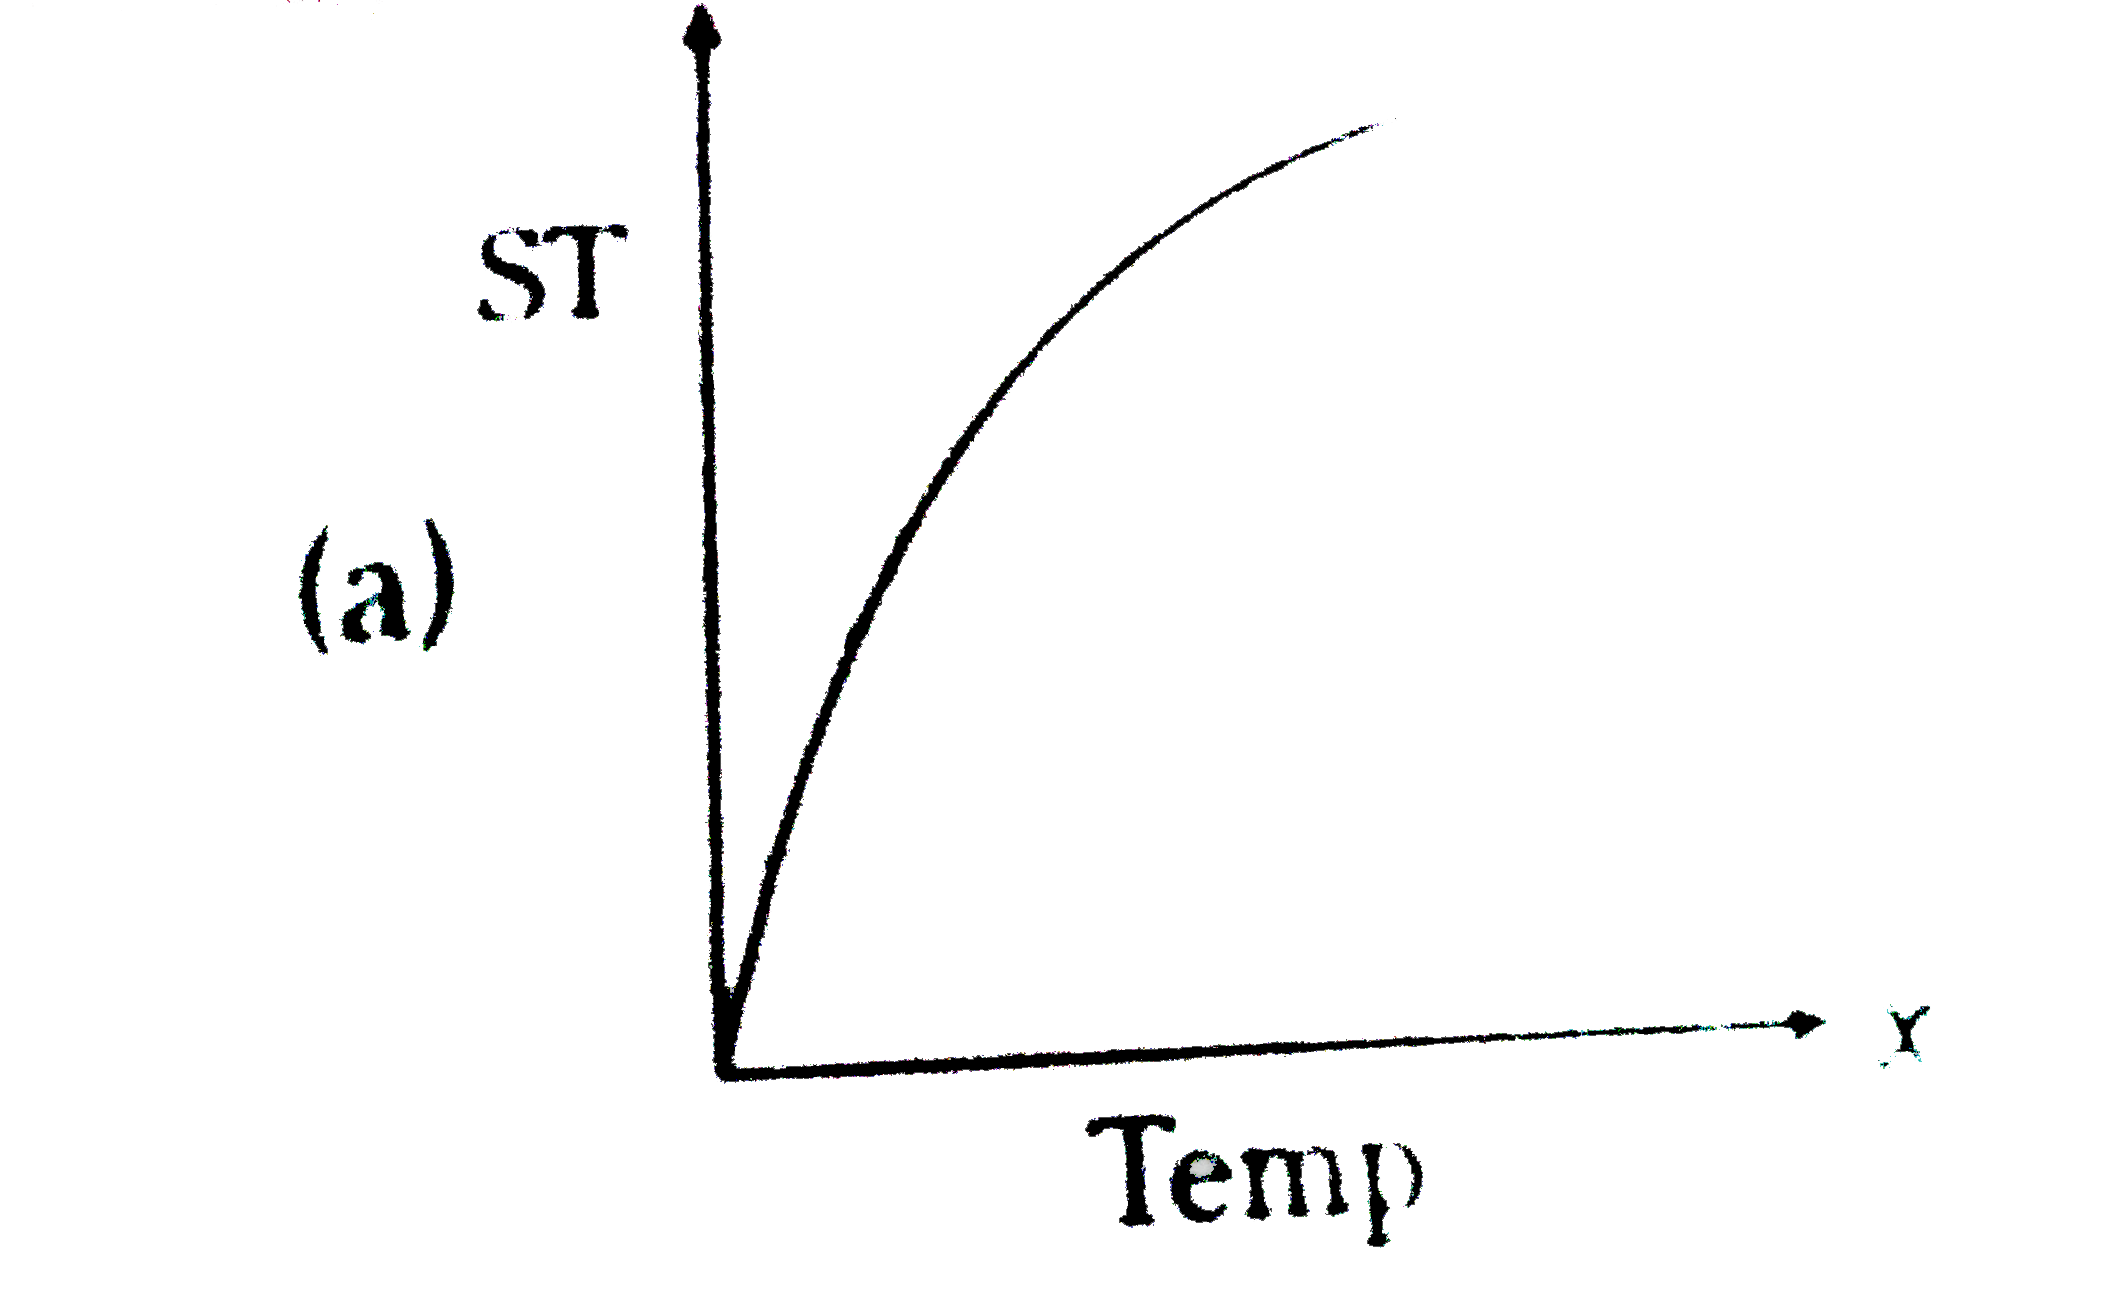
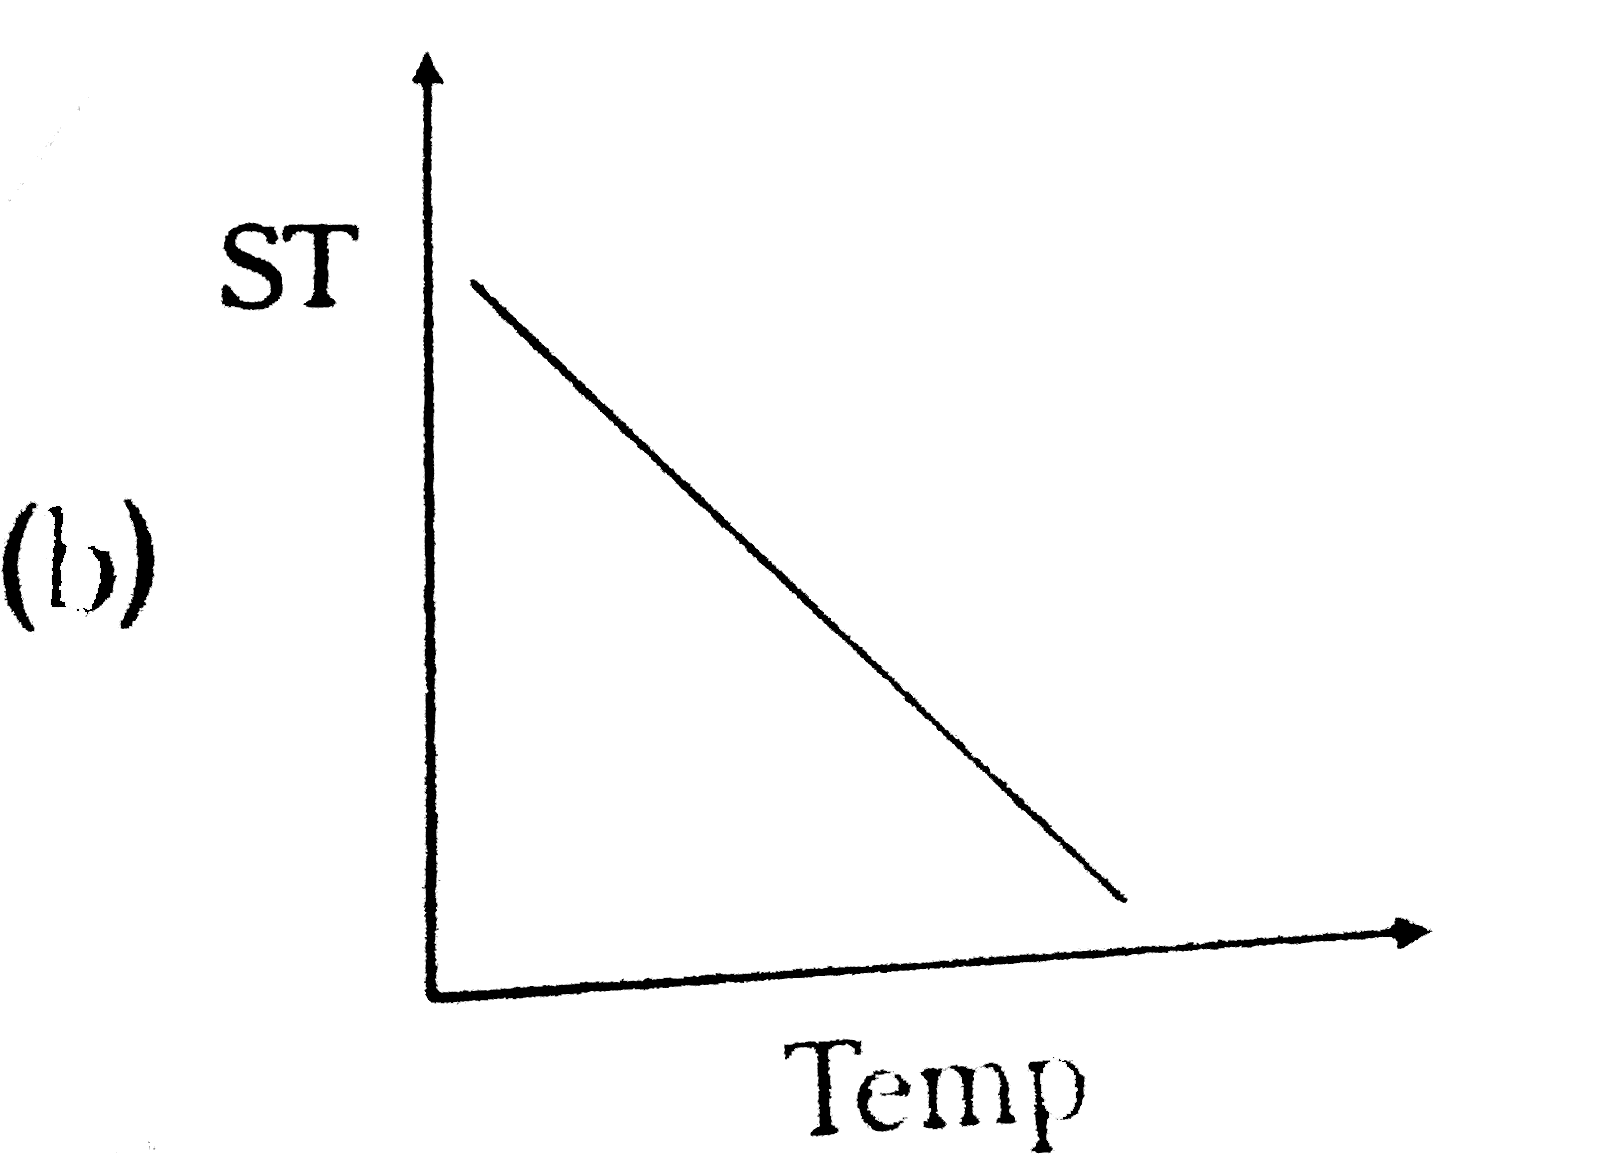
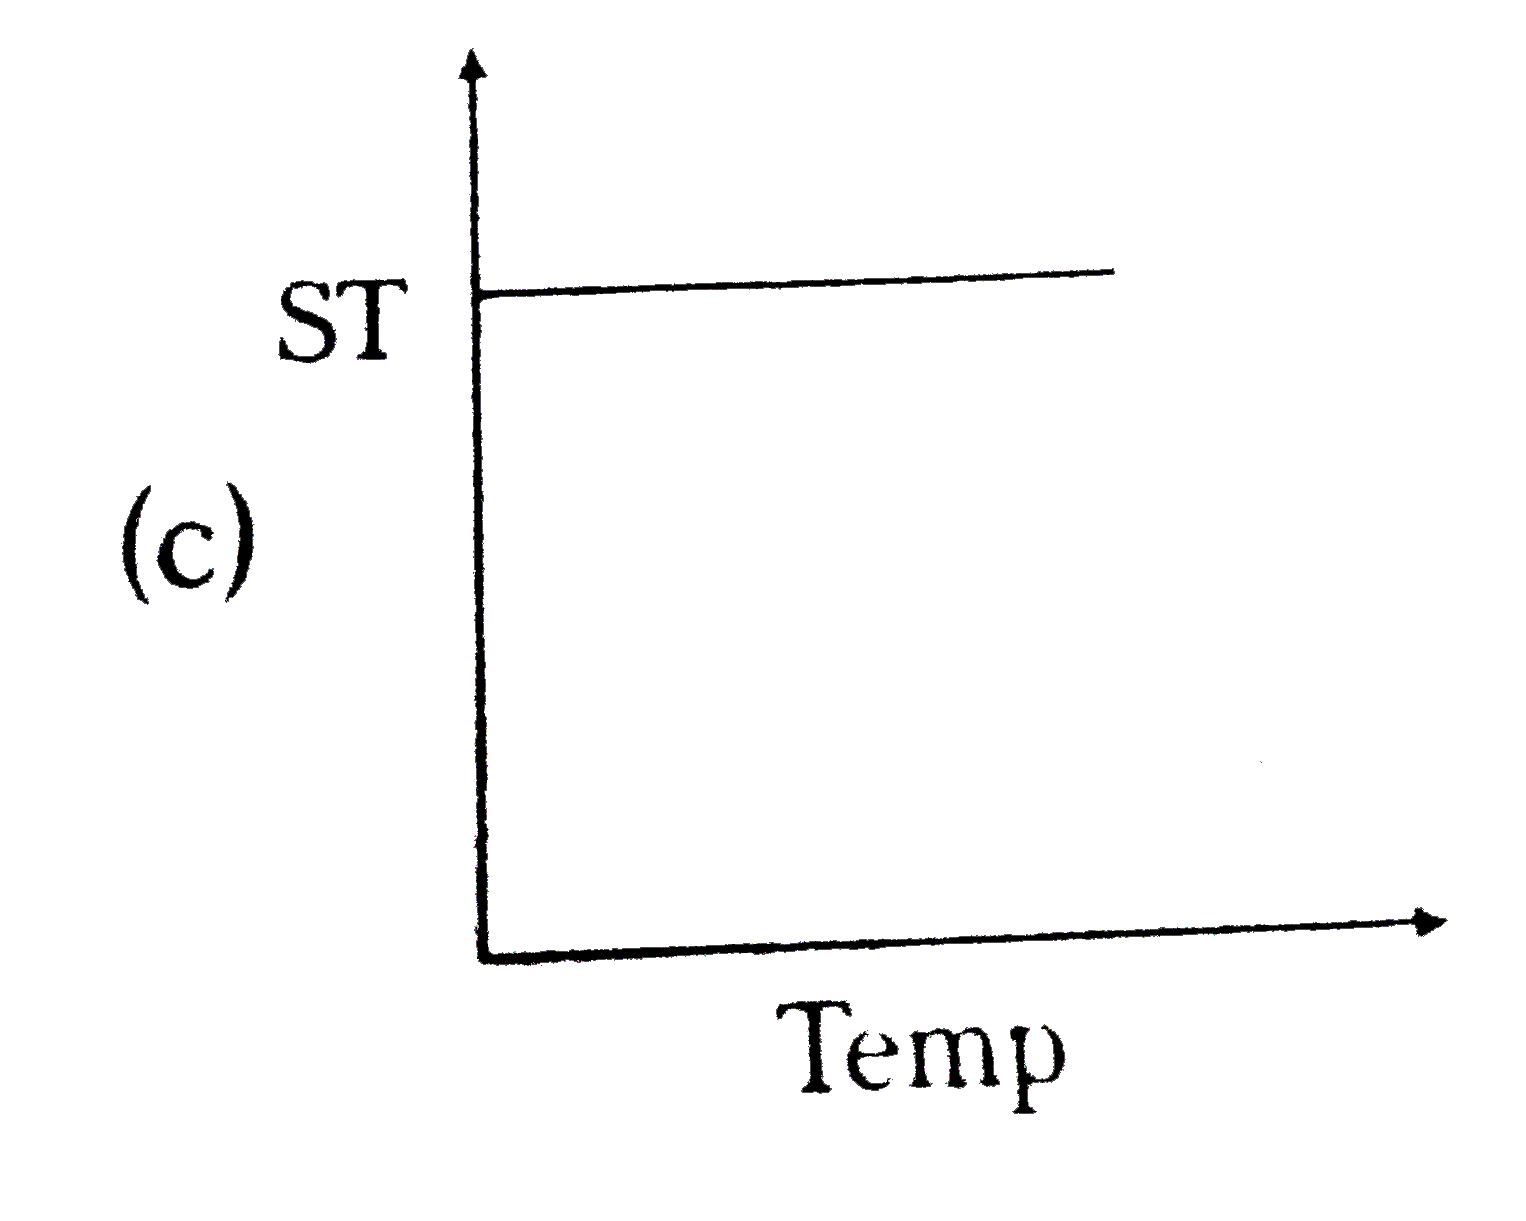
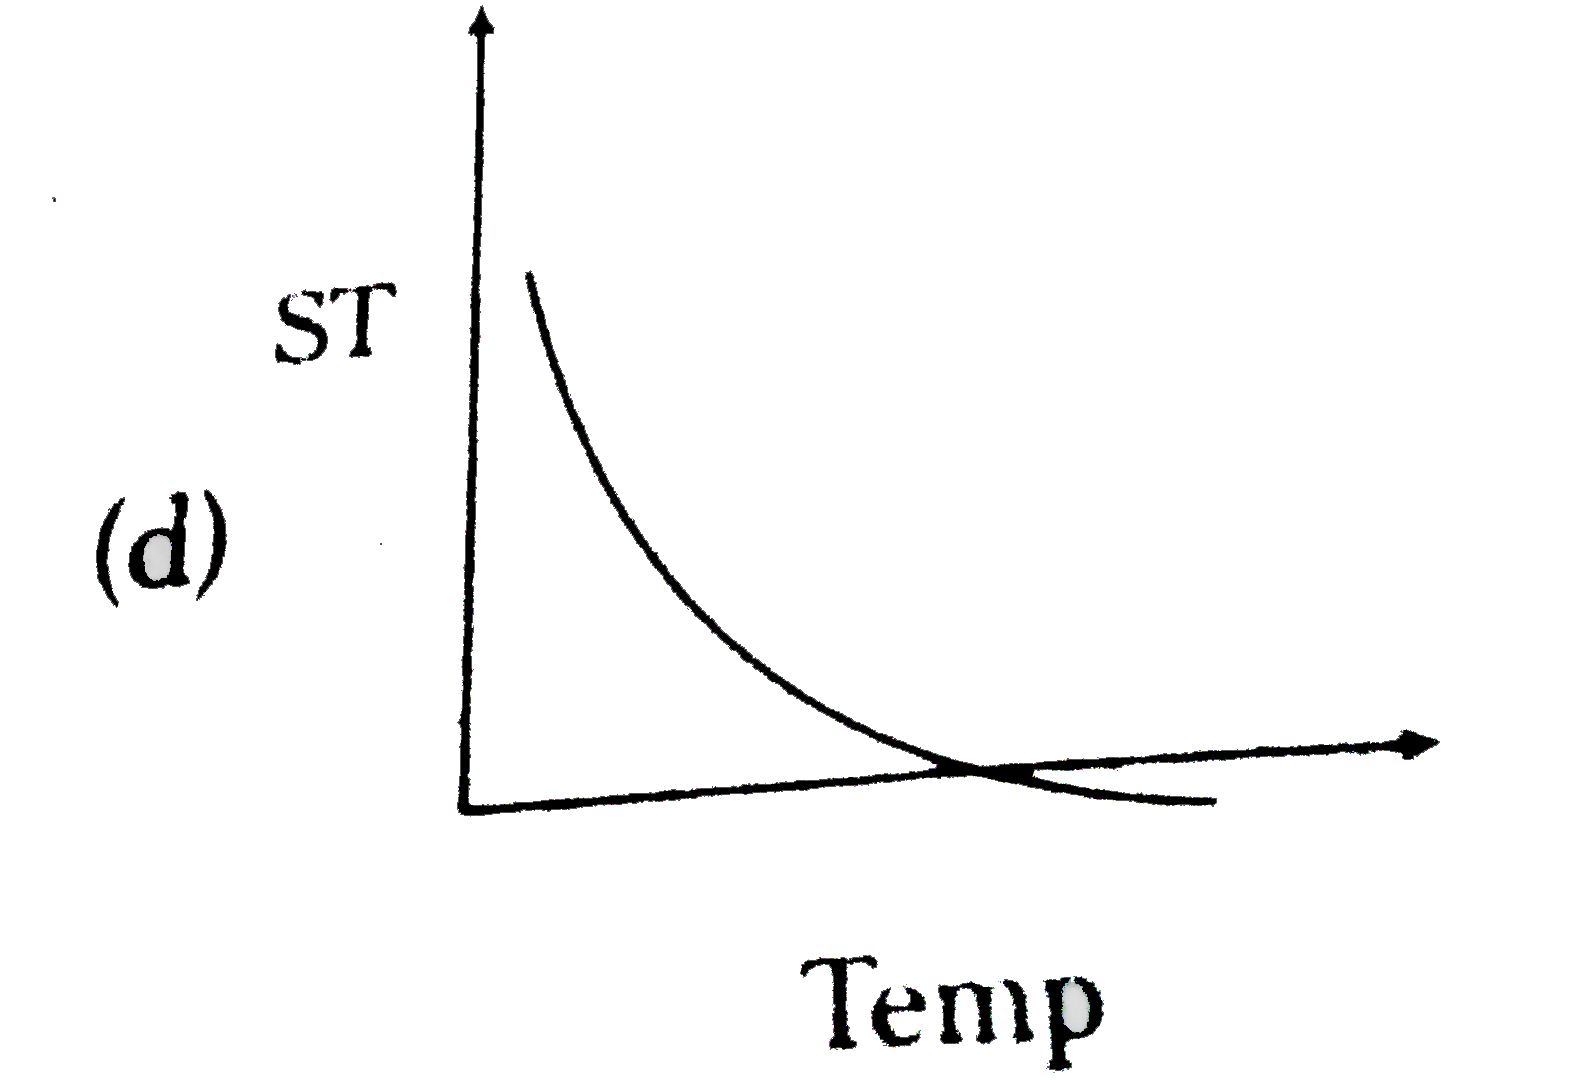
Which graph represents the variation of surface tension with temperature over small temperature ranges for water?


The correct Answer is:B
T_(c)=T_(0)(1-alphat)" i.e., surface tension decreses linerly with increase intemperature.
Topper's Solved these Questions
- FLUID MECHANICSBOOK - DC PANDEY ENGLISHCHAPTER - FLUID MECHANICSEXERCISE - B) Medical entrance special format question
19 Videos
- FLUID MECHANICSBOOK - DC PANDEY ENGLISHCHAPTER - FLUID MECHANICSEXERCISE - Match the columns
6 Videos
- FLUID MECHANICSBOOK - DC PANDEY ENGLISHCHAPTER - FLUID MECHANICSEXERCISE - Check point 13.4
10 Videos
- EXPERIMENTSBOOK - DC PANDEY ENGLISHCHAPTER - EXPERIMENTSEXERCISE - Subjective
15 Videos
- GENERAL PHYSICSBOOK - DC PANDEY ENGLISHCHAPTER - GENERAL PHYSICSEXERCISE - INTEGER_TYPE
2 Videos
Similar Questions
Following is the variation of physical adsorption with temperature.
View SolutionTemperature range for plant growth is
View SolutionDraw a graph to show the variation in density of water with temperature in the temperature range from 0∘C to 10∘C.
View SolutionWhich of the following curve represent variation of density of water with temperature best-
View SolutionThe value of surface tension of a liquid at critical temperature
View SolutionWhat is temperature range of the atmosphere ?
View SolutionWhich of the following graph represents the variation of resistivity (ρ) with temperature (T) for copper?
View SolutionThe graph which represents the variation of mean kinetic energy of moleules with temperature ∘C is ?
View SolutionShow on a graph, the variation of resistivity with temperature for a typical semiconductor.
View SolutionOn increasing temperature , surface tension of water
View Solution
