Draw a graph to show the variation in density of water with temperature in the temperature range from 0∘C to 10∘C.
To draw a graph showing the variation in density of water with temperature from 0°C to 10°C, follow these steps:
1. Prepare the Axes:
- Draw two perpendicular lines to represent the axes of the graph.
- Label the horizontal axis (X-axis) as "Temperature (°C)" and the vertical axis (Y-axis) as "Density (g/cm³)".
2. Mark the Temperature Scale:
- On the X-axis, mark the temperature values from 0°C to 10°C. You can choose increments of 2°C, so you will have points at 0, 2, 4, 6, 8, and 10.
3. Mark the Density Scale:
- On the Y-axis, mark the density values. The density of water varies as follows:
- At 0°C: approximately 0.9998 g/cm³
- At 2°C: approximately 0.9997 g/cm³
- At 4°C: approximately 1.0000 g/cm³ (maximum density)
- At 6°C: approximately 0.9994 g/cm³
- At 8°C: approximately 0.9980 g/cm³
- At 10°C: approximately 0.9970 g/cm³
- You can choose increments of 0.001 g/cm³ for the density scale.
4. Plot the Points:
- Plot the points for each temperature against its corresponding density:
- (0, 0.9998)
- (2, 0.9997)
- (4, 1.0000)
- (6, 0.9994)
- (8, 0.9980)
- (10, 0.9970)
5. Draw the Graph:
- Connect the plotted points with a smooth curve. The curve should rise to a peak at 4°C and then fall as the temperature increases.
6. Label the Graph:
- Add a title to the graph, such as "Variation of Density of Water with Temperature".
- Optionally, label the maximum density point at 4°C for clarity.
- Draw two perpendicular lines to represent the axes of the graph.
- Label the horizontal axis (X-axis) as "Temperature (°C)" and the vertical axis (Y-axis) as "Density (g/cm³)".
- On the X-axis, mark the temperature values from 0°C to 10°C. You can choose increments of 2°C, so you will have points at 0, 2, 4, 6, 8, and 10.
- On the Y-axis, mark the density values. The density of water varies as follows:
- At 0°C: approximately 0.9998 g/cm³
- At 2°C: approximately 0.9997 g/cm³
- At 4°C: approximately 1.0000 g/cm³ (maximum density)
- At 6°C: approximately 0.9994 g/cm³
- At 8°C: approximately 0.9980 g/cm³
- At 10°C: approximately 0.9970 g/cm³
- You can choose increments of 0.001 g/cm³ for the density scale.
- Plot the points for each temperature against its corresponding density:
- (0, 0.9998)
- (2, 0.9997)
- (4, 1.0000)
- (6, 0.9994)
- (8, 0.9980)
- (10, 0.9970)
- Connect the plotted points with a smooth curve. The curve should rise to a peak at 4°C and then fall as the temperature increases.
- Add a title to the graph, such as "Variation of Density of Water with Temperature".
- Optionally, label the maximum density point at 4°C for clarity.
Topper's Solved these Questions
- HEAT AND ENERGYBOOK - ICSECHAPTER - HEAT AND ENERGYEXERCISE - EXERCISE -6(A) (Multiple Choice Question)
5 Videos
- HEAT AND ENERGYBOOK - ICSECHAPTER - HEAT AND ENERGYEXERCISE - EXERCISE -6(B)
12 Videos
- FLUIDSBOOK - ICSECHAPTER - FLUIDSEXERCISE - TOPIC 2 (4 Marks Questions )
16 Videos
- ICSE ANNUAL EXAMINATION -2020BOOK - ICSECHAPTER - ICSE ANNUAL EXAMINATION -2020EXERCISE - SECTION-II
45 Videos
Similar Questions
Knowledge Check
Which of the following graph shows the variationi of density of water increase in temperature ?
A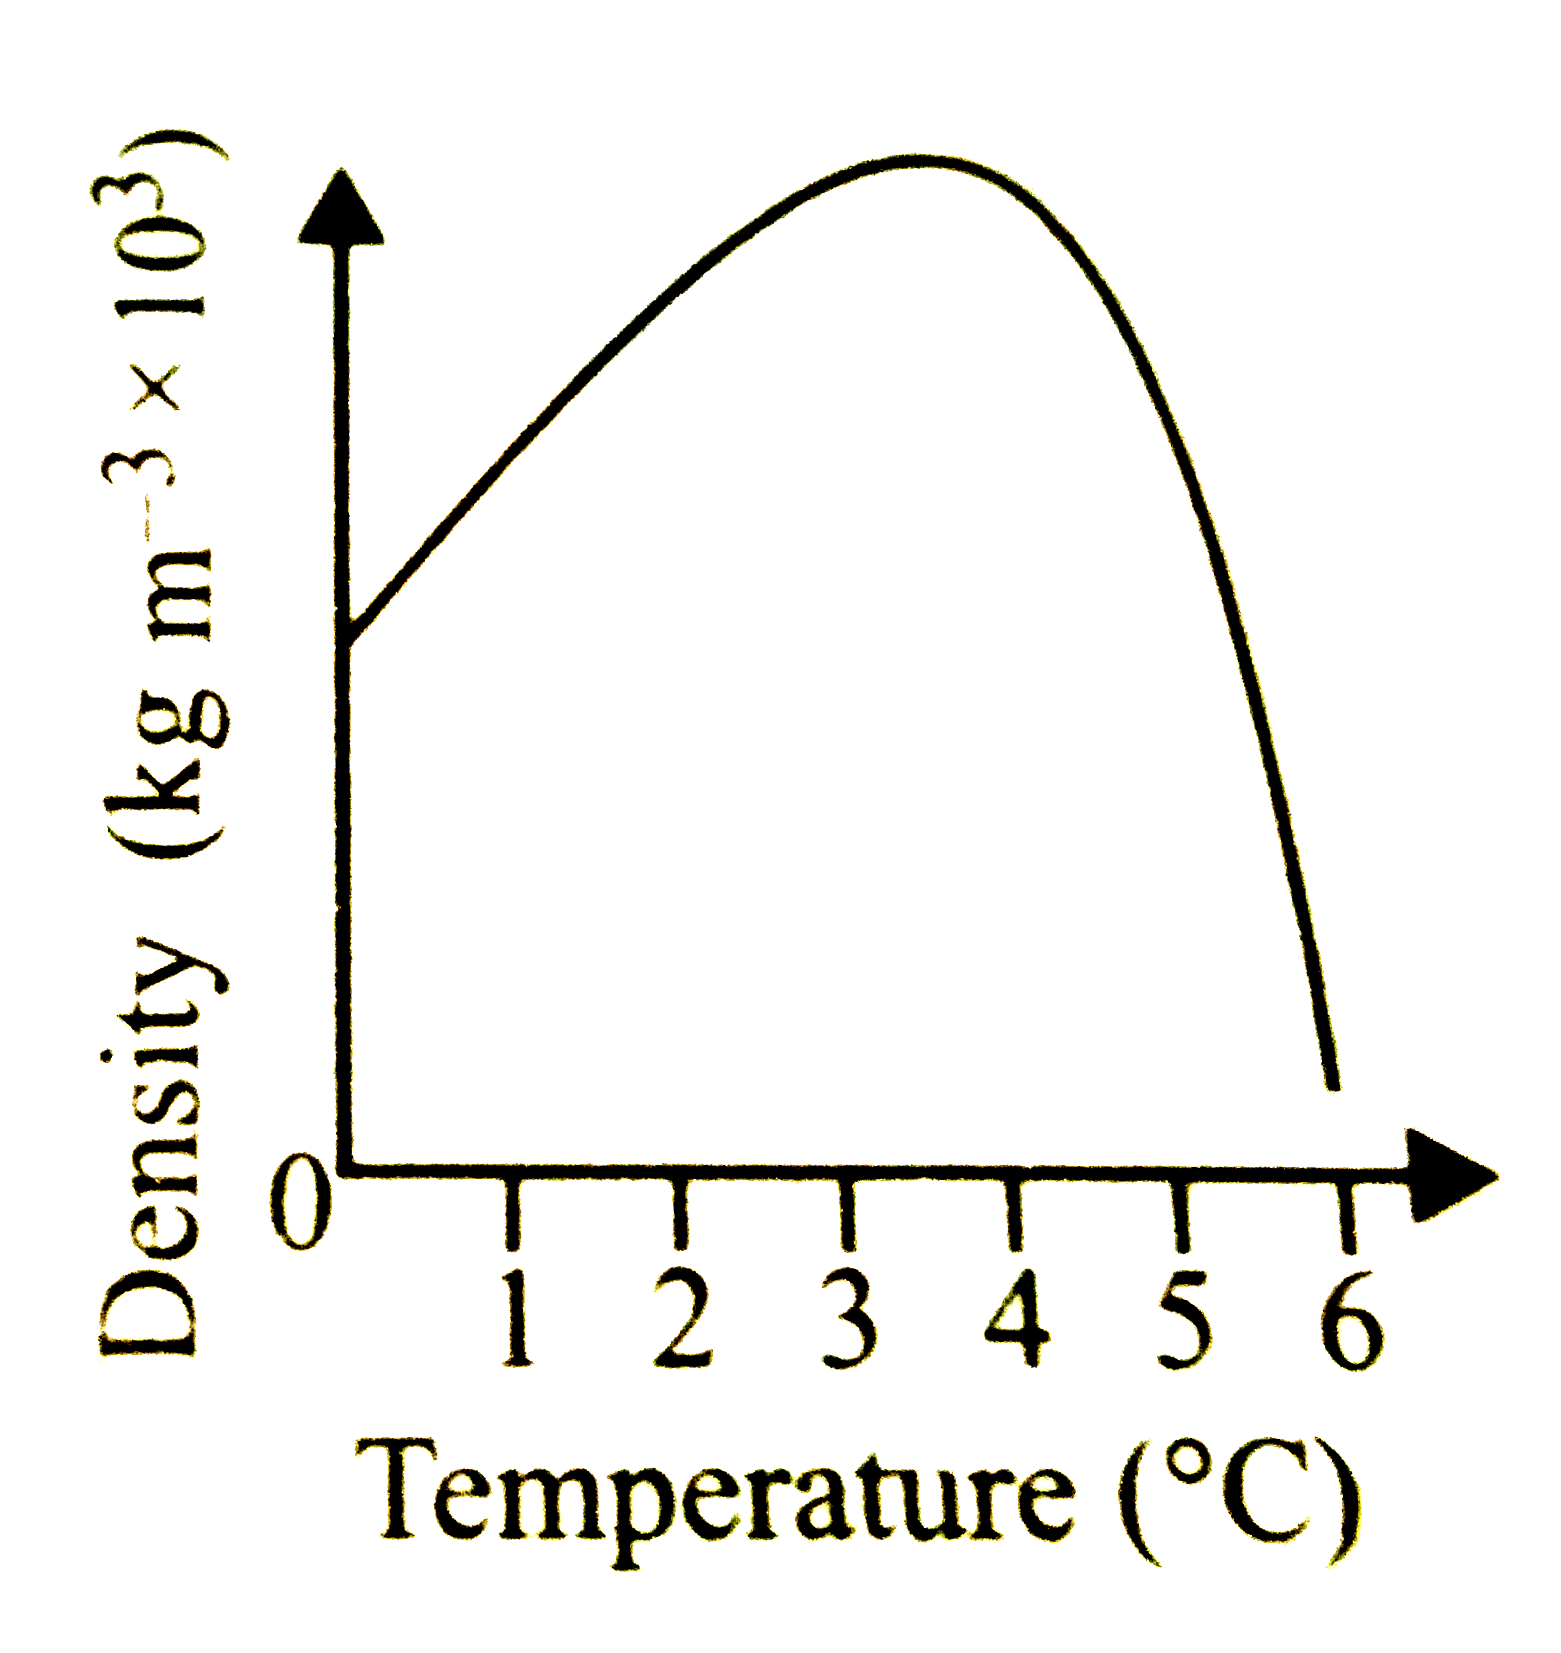 B
B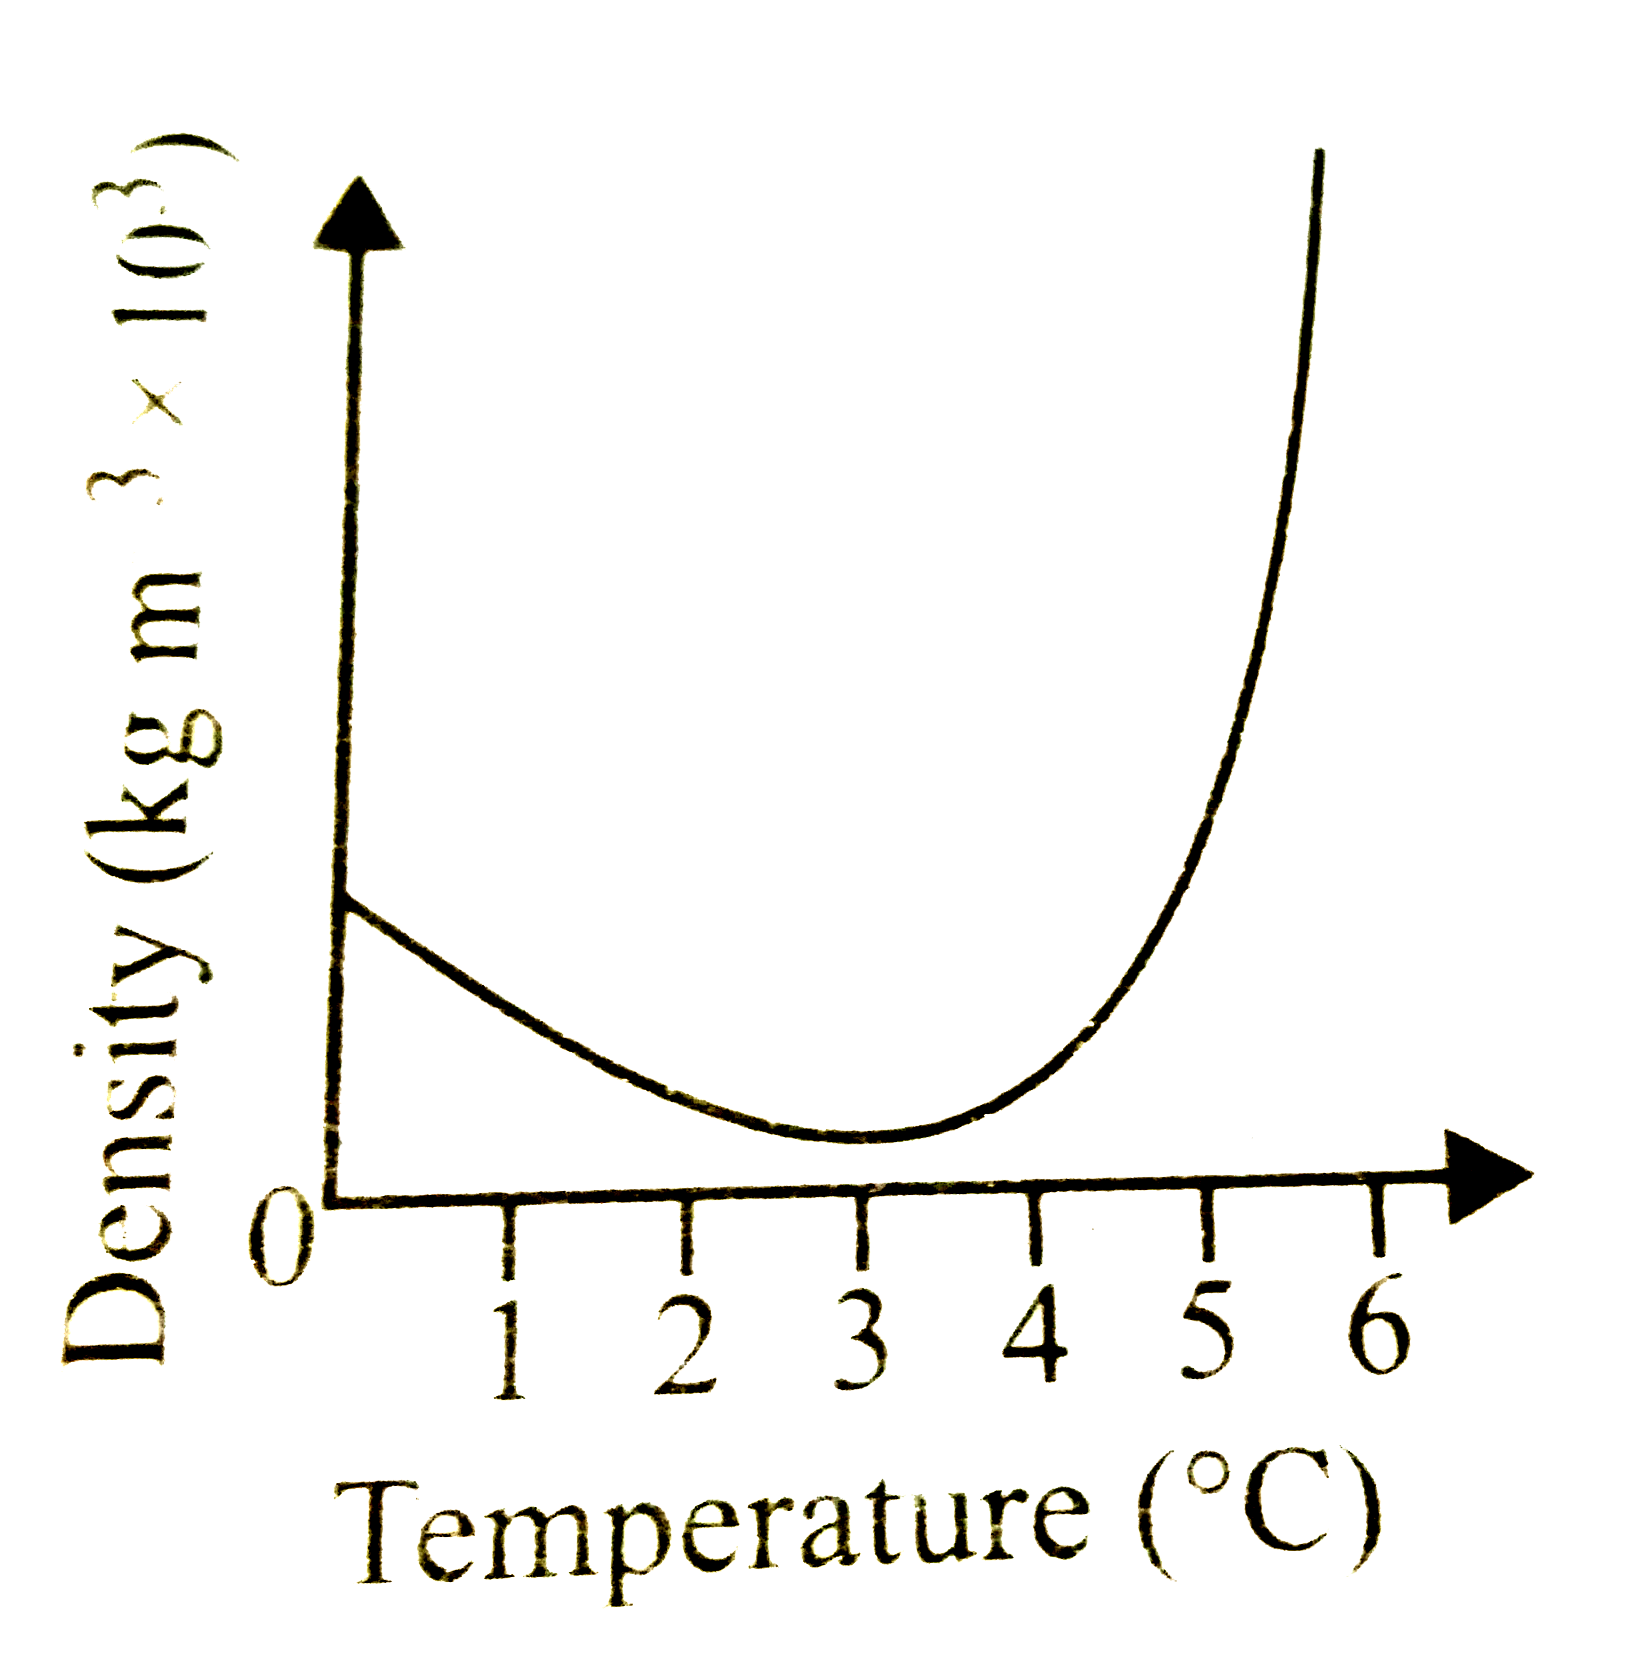 C
C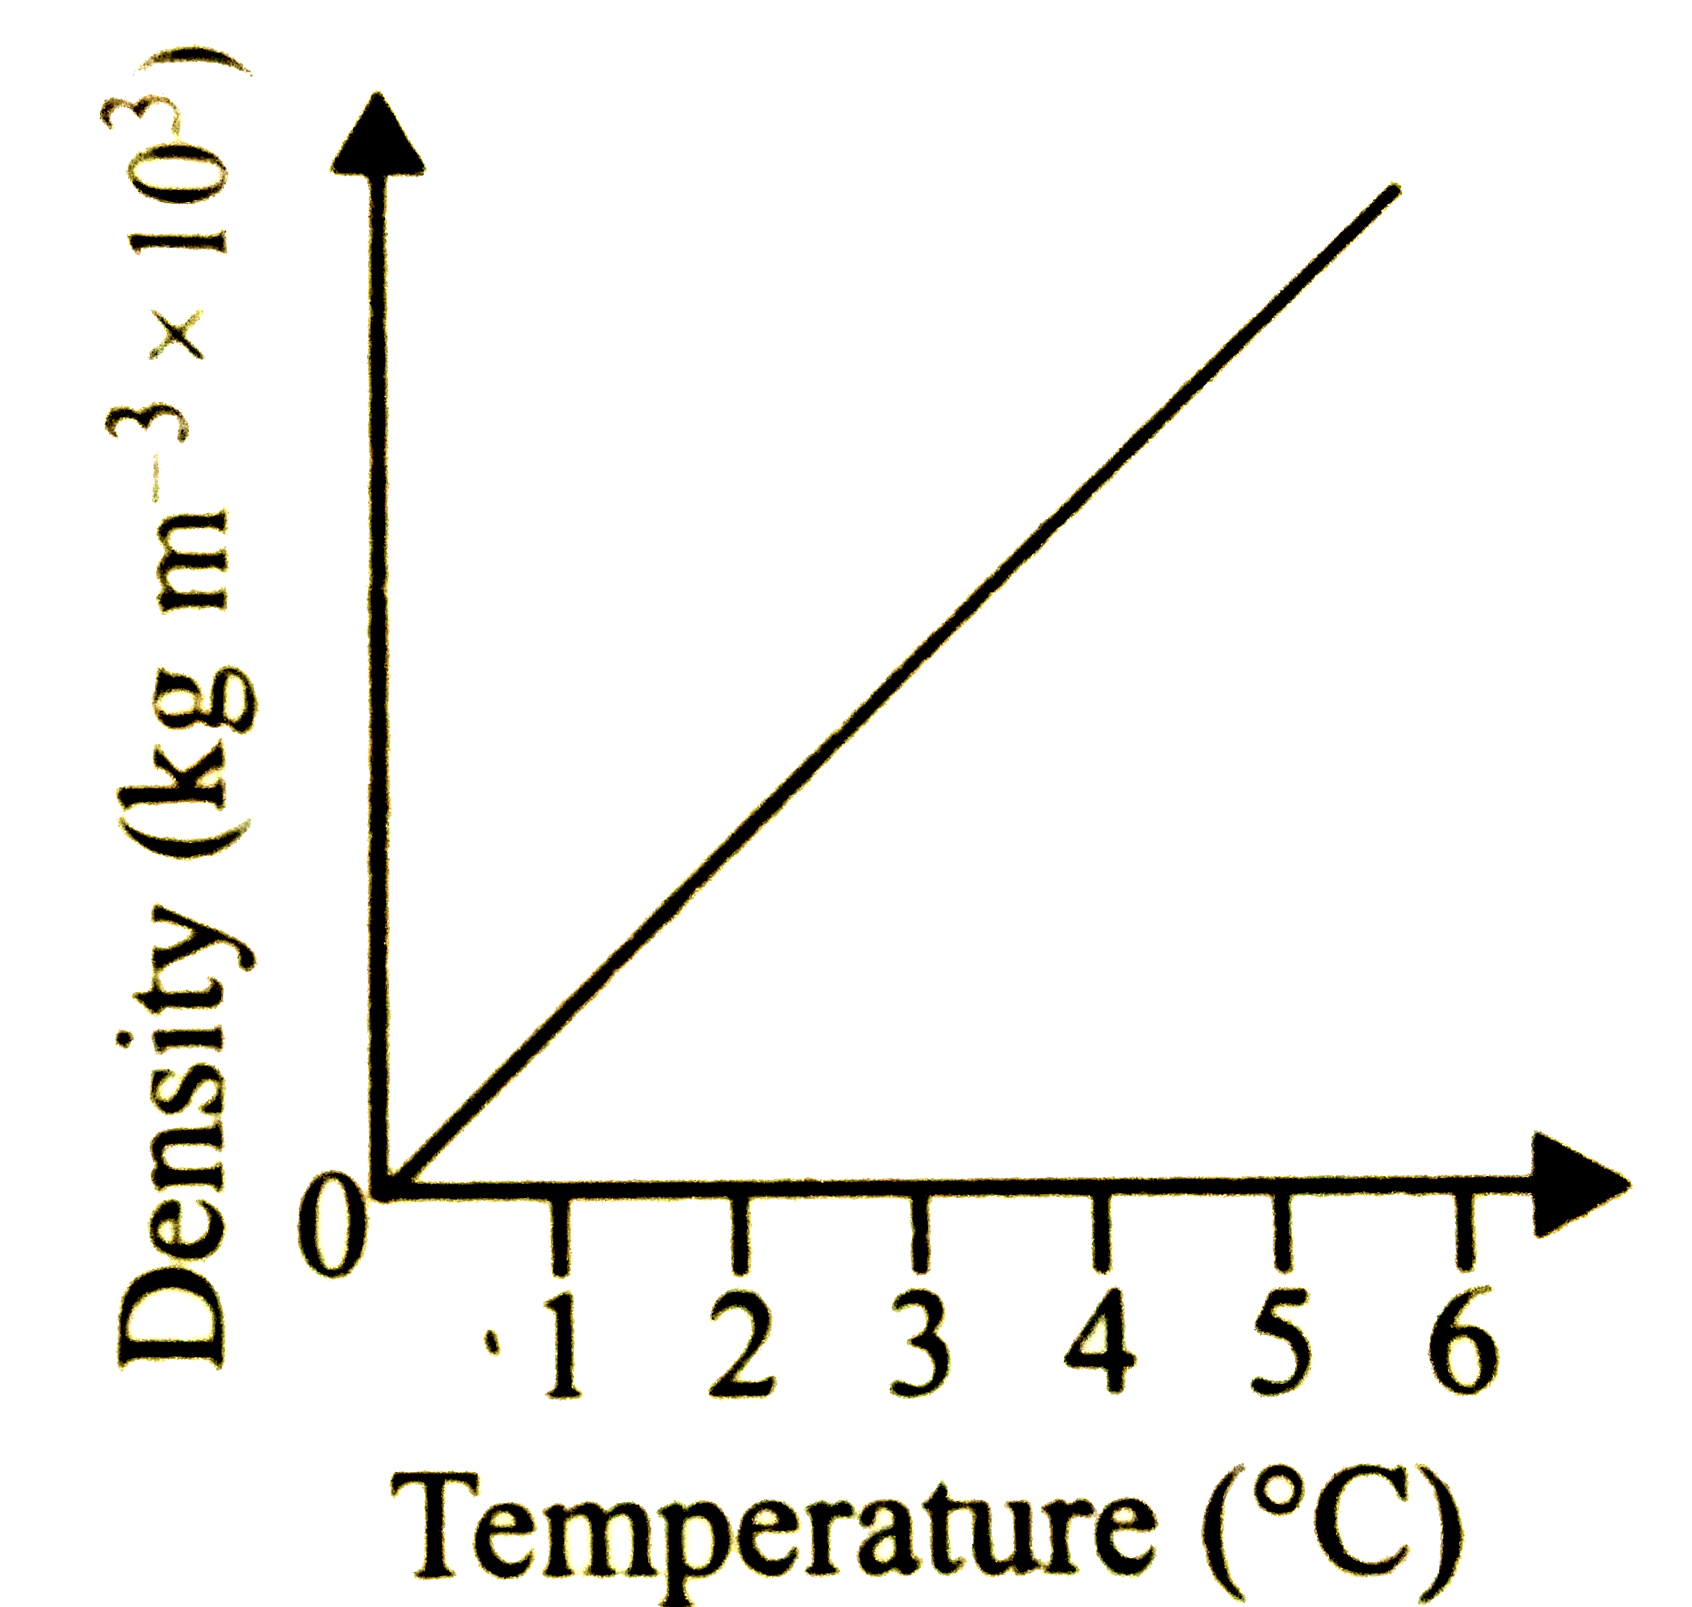 D
D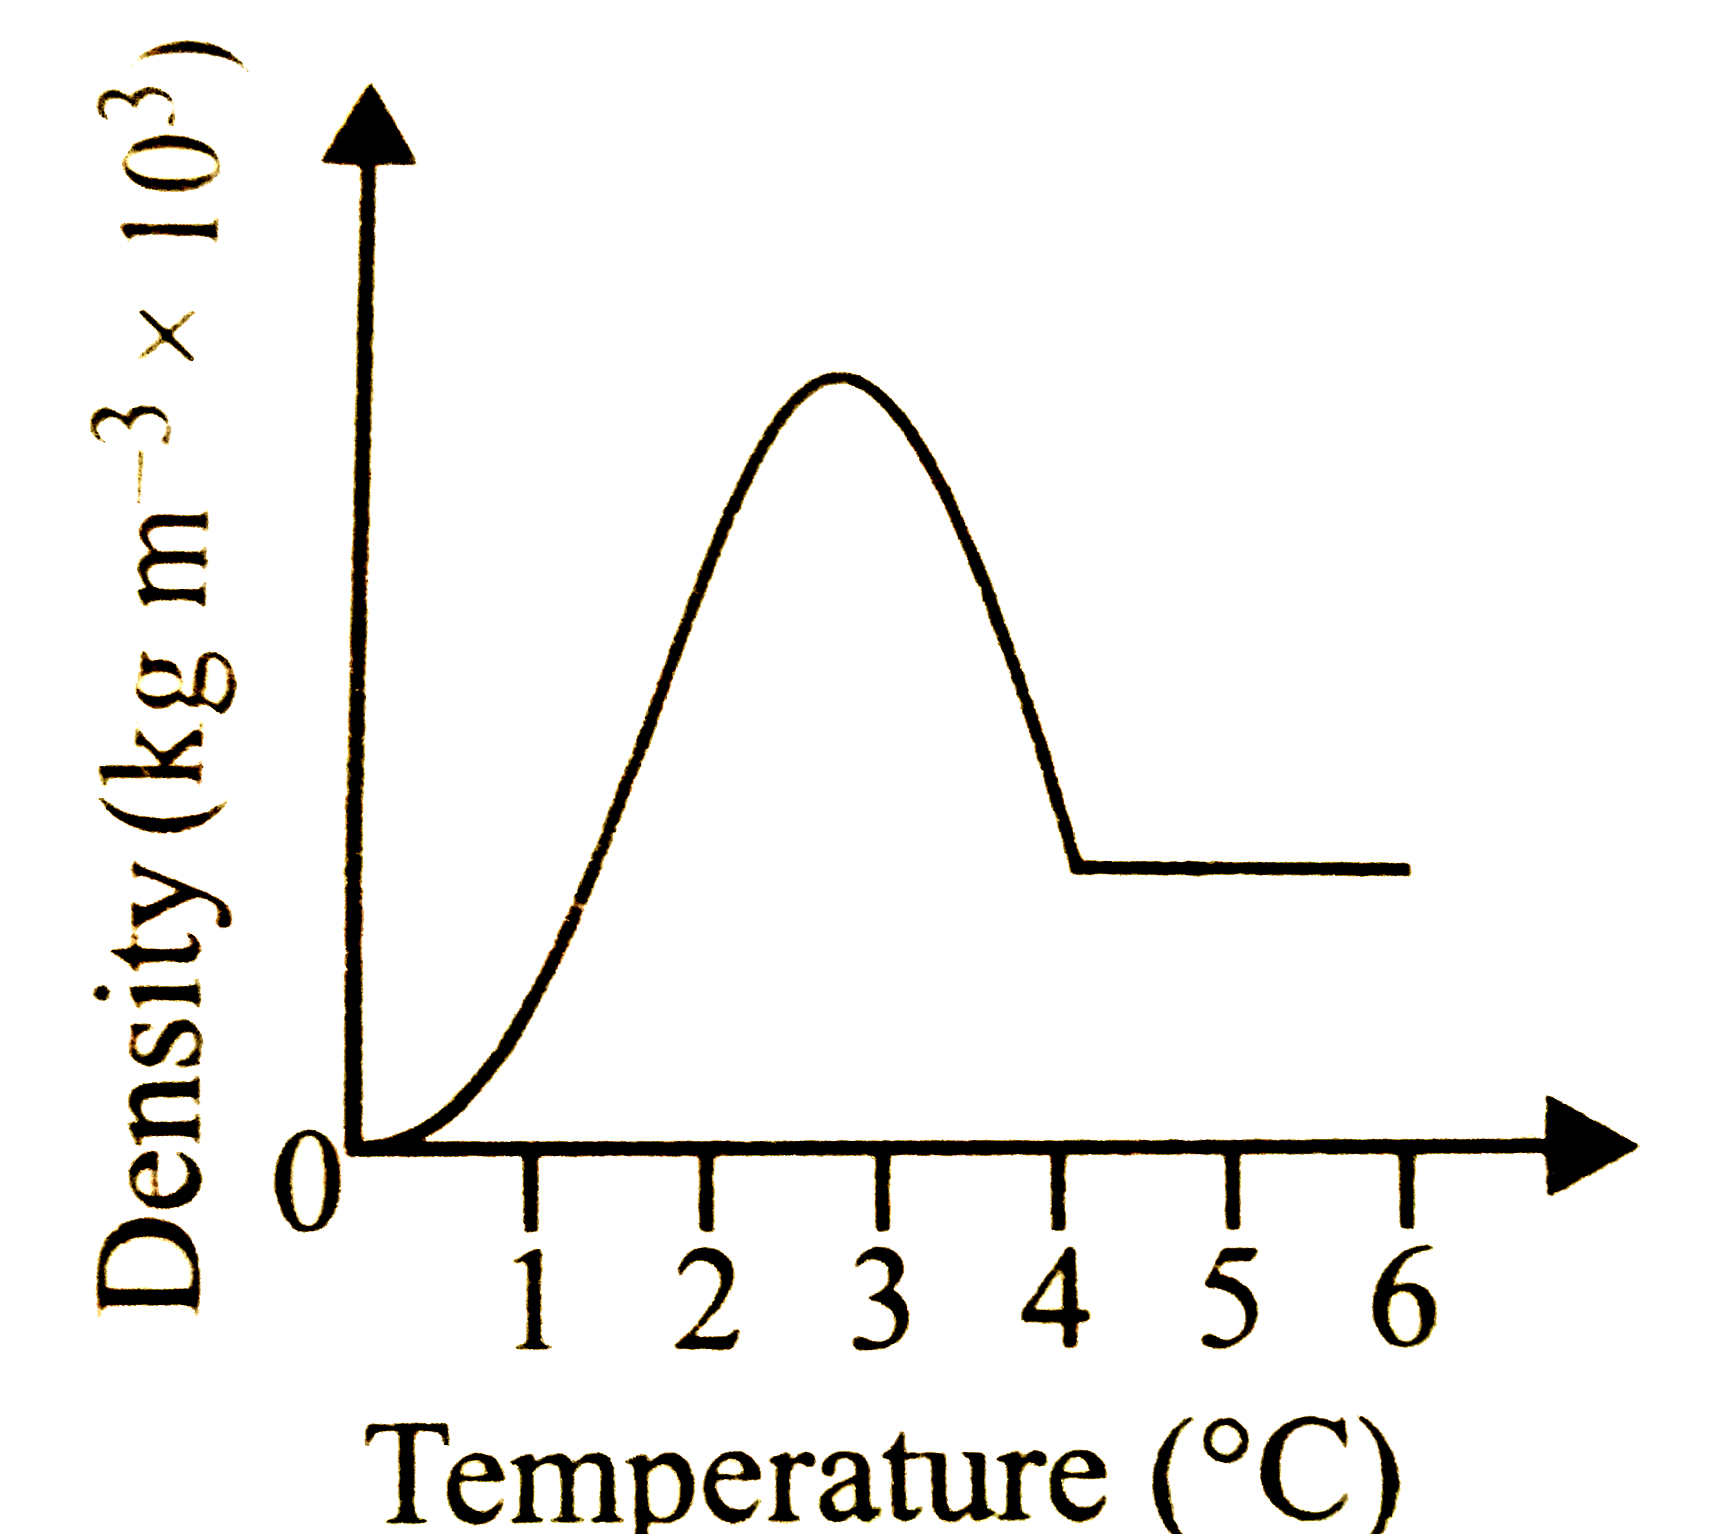
Which graph represents the variation of surface tension with temperature over small temperature ranges for water?
A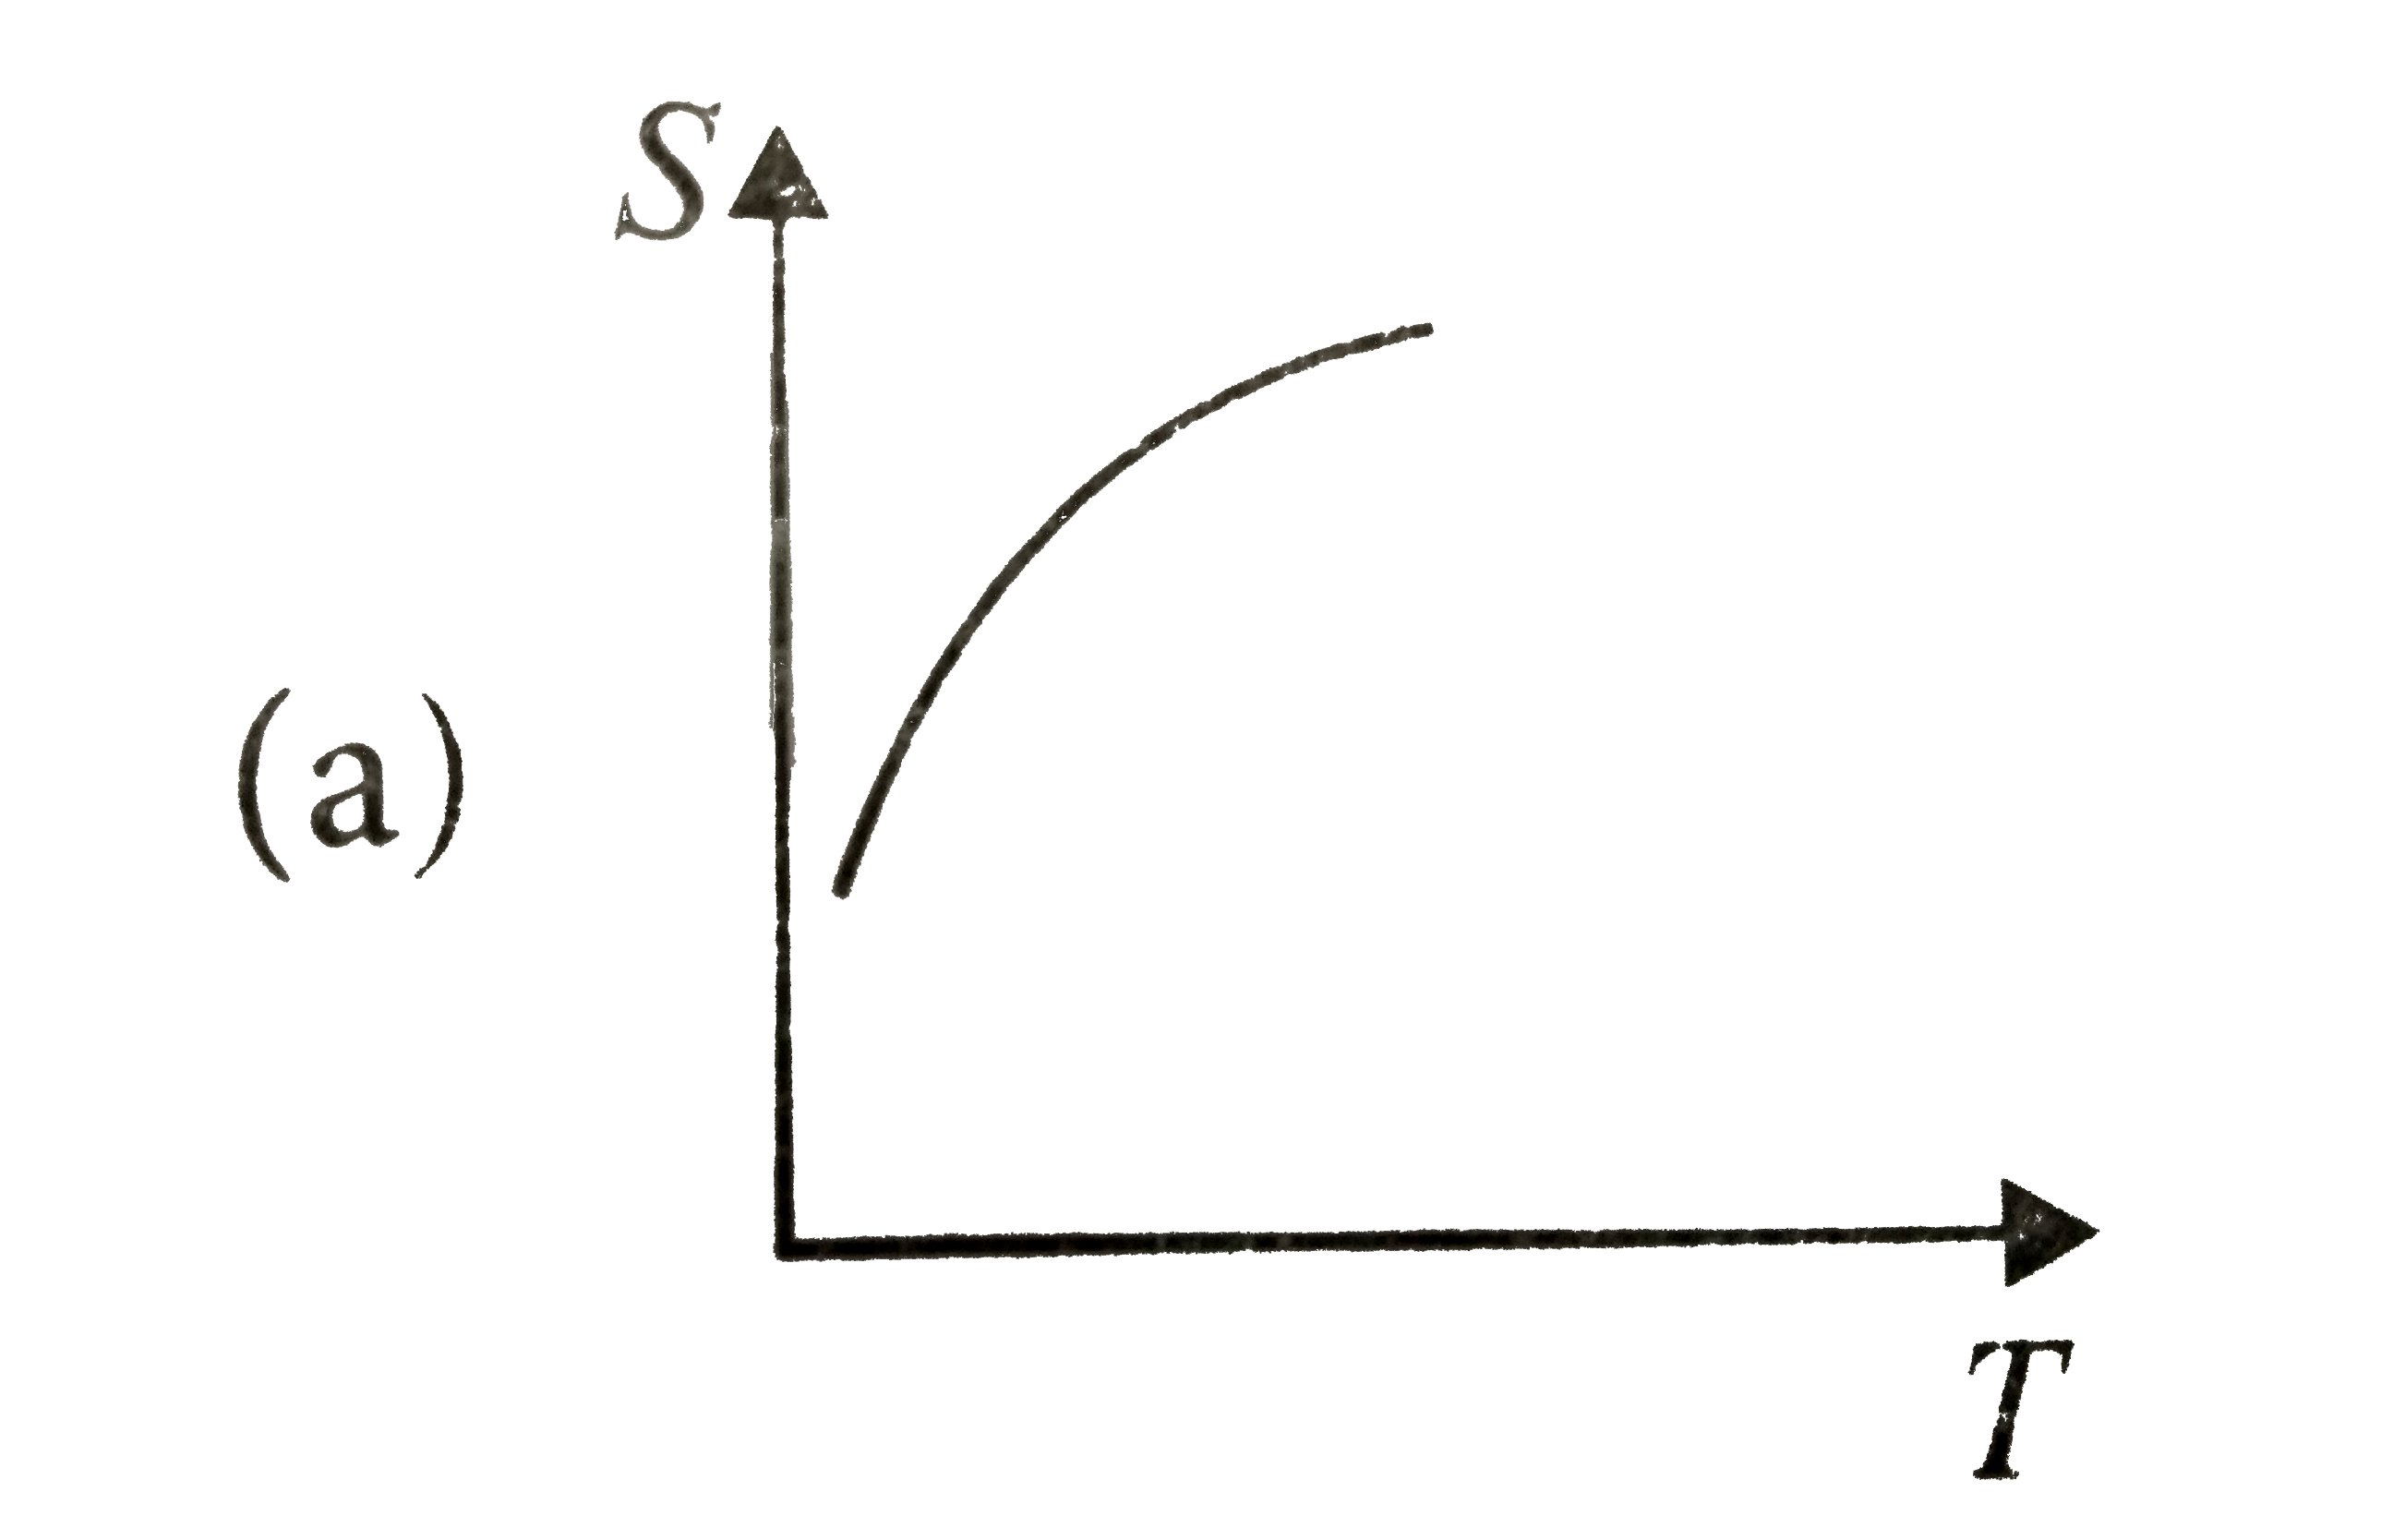 B
B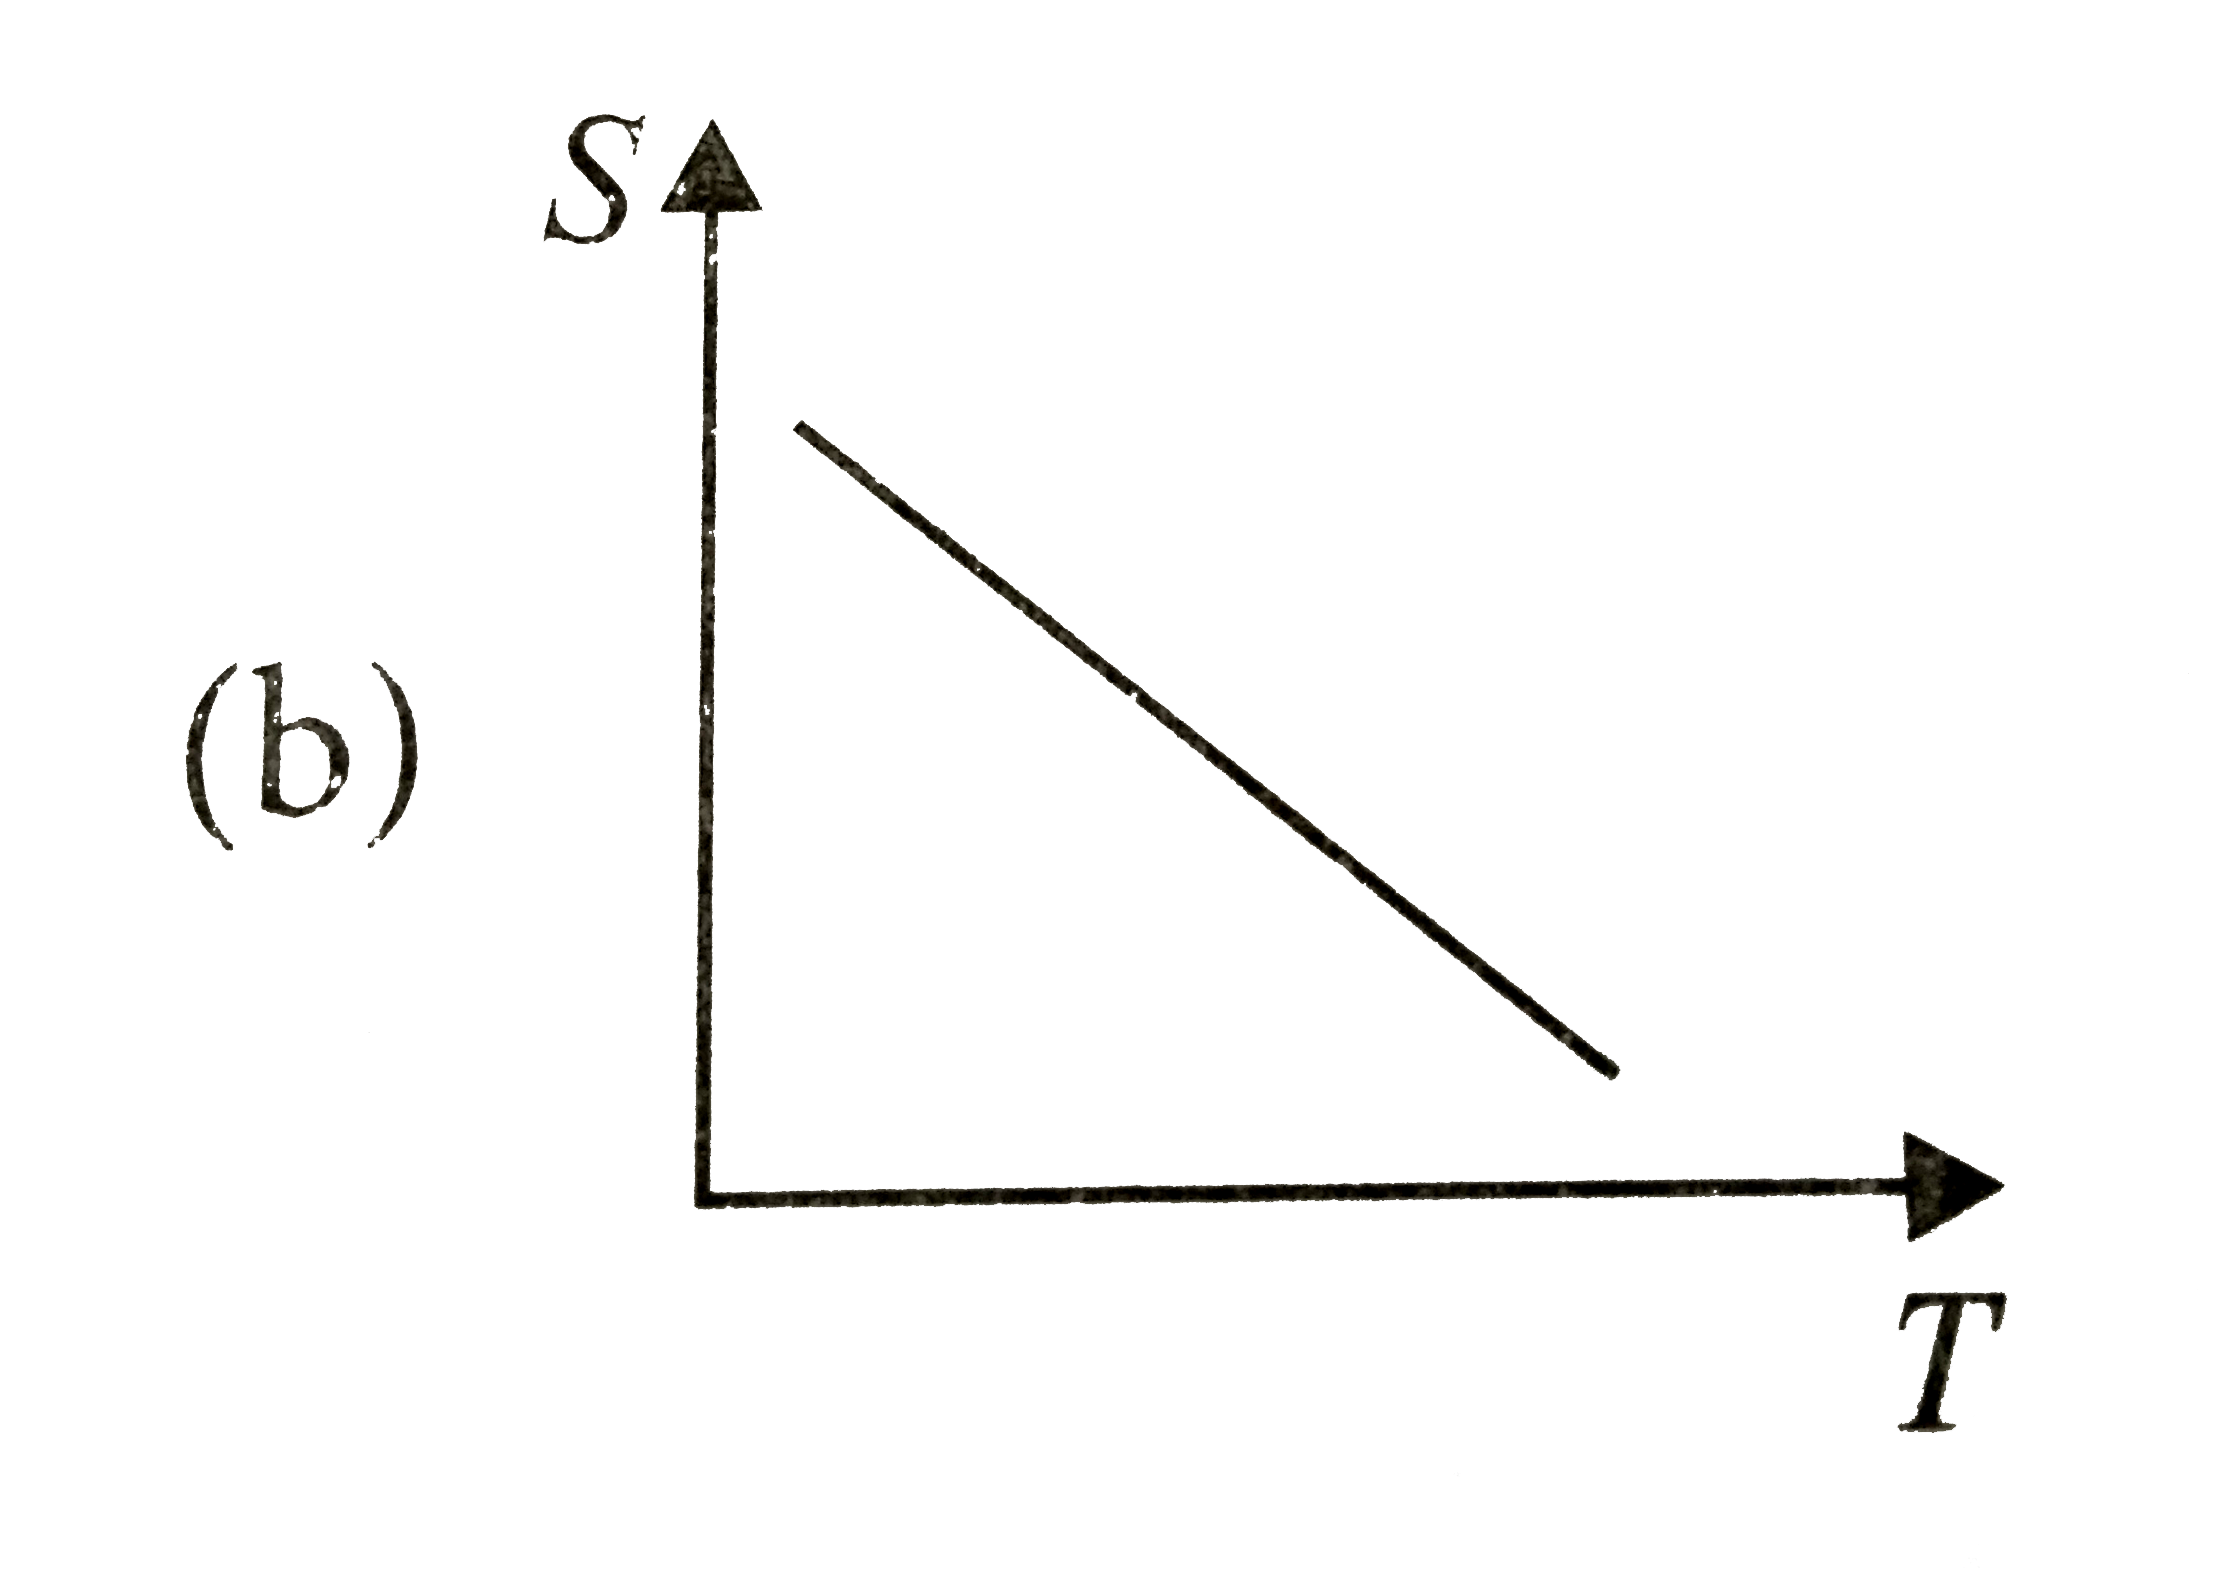 C
C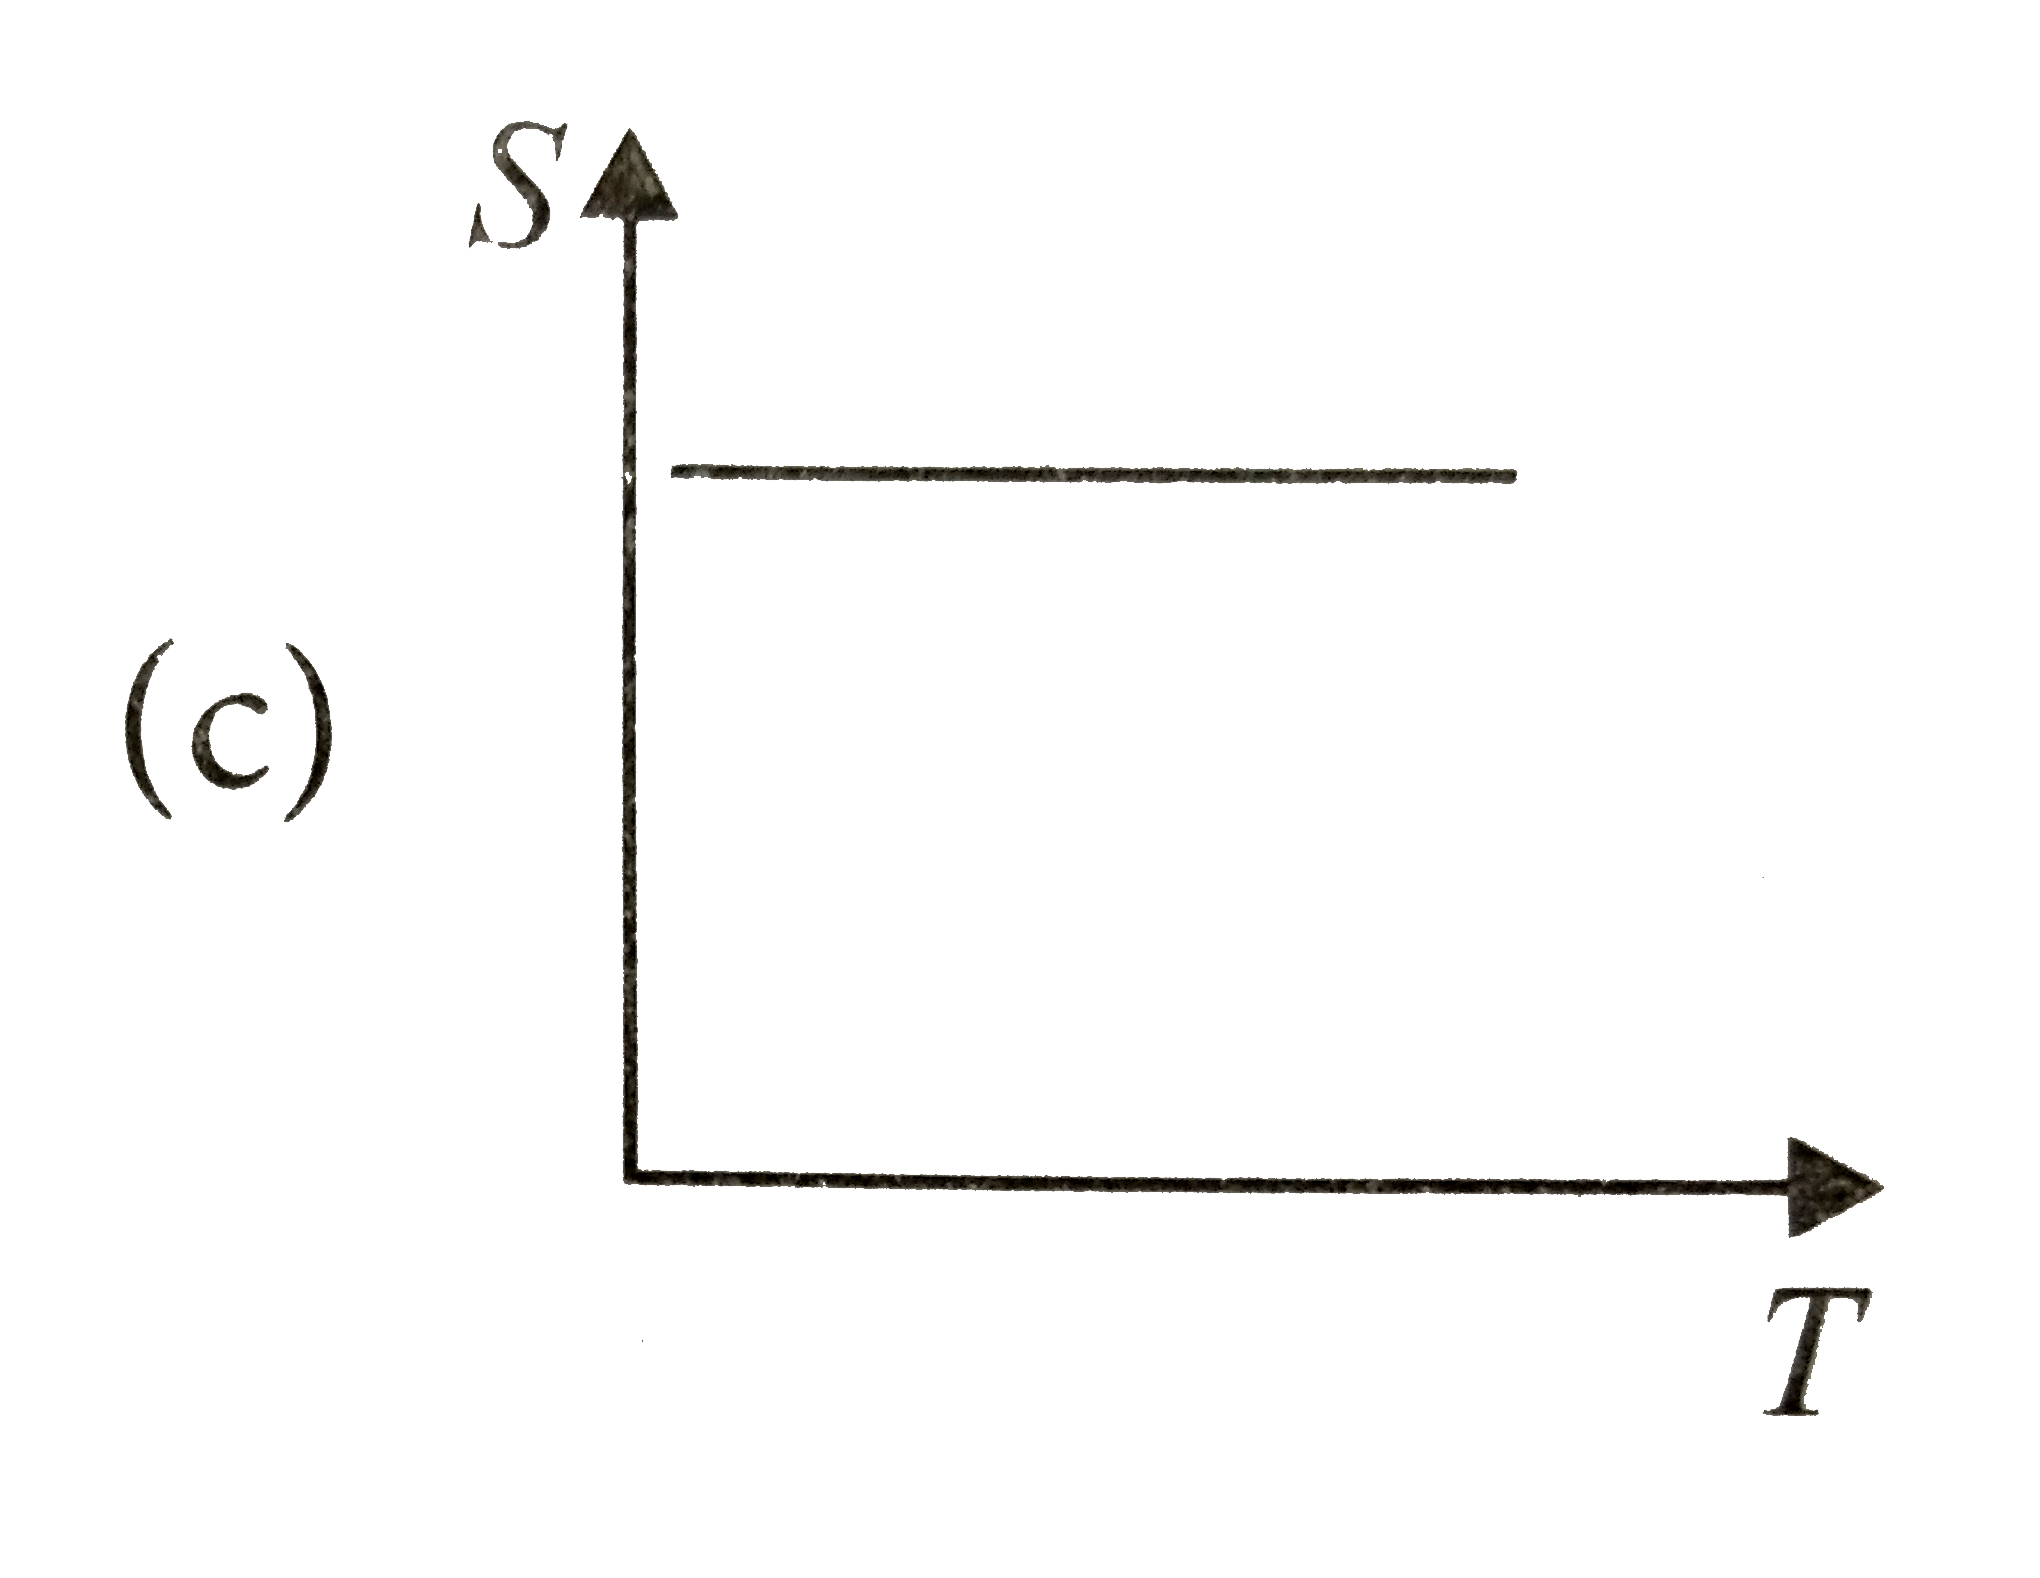 D
D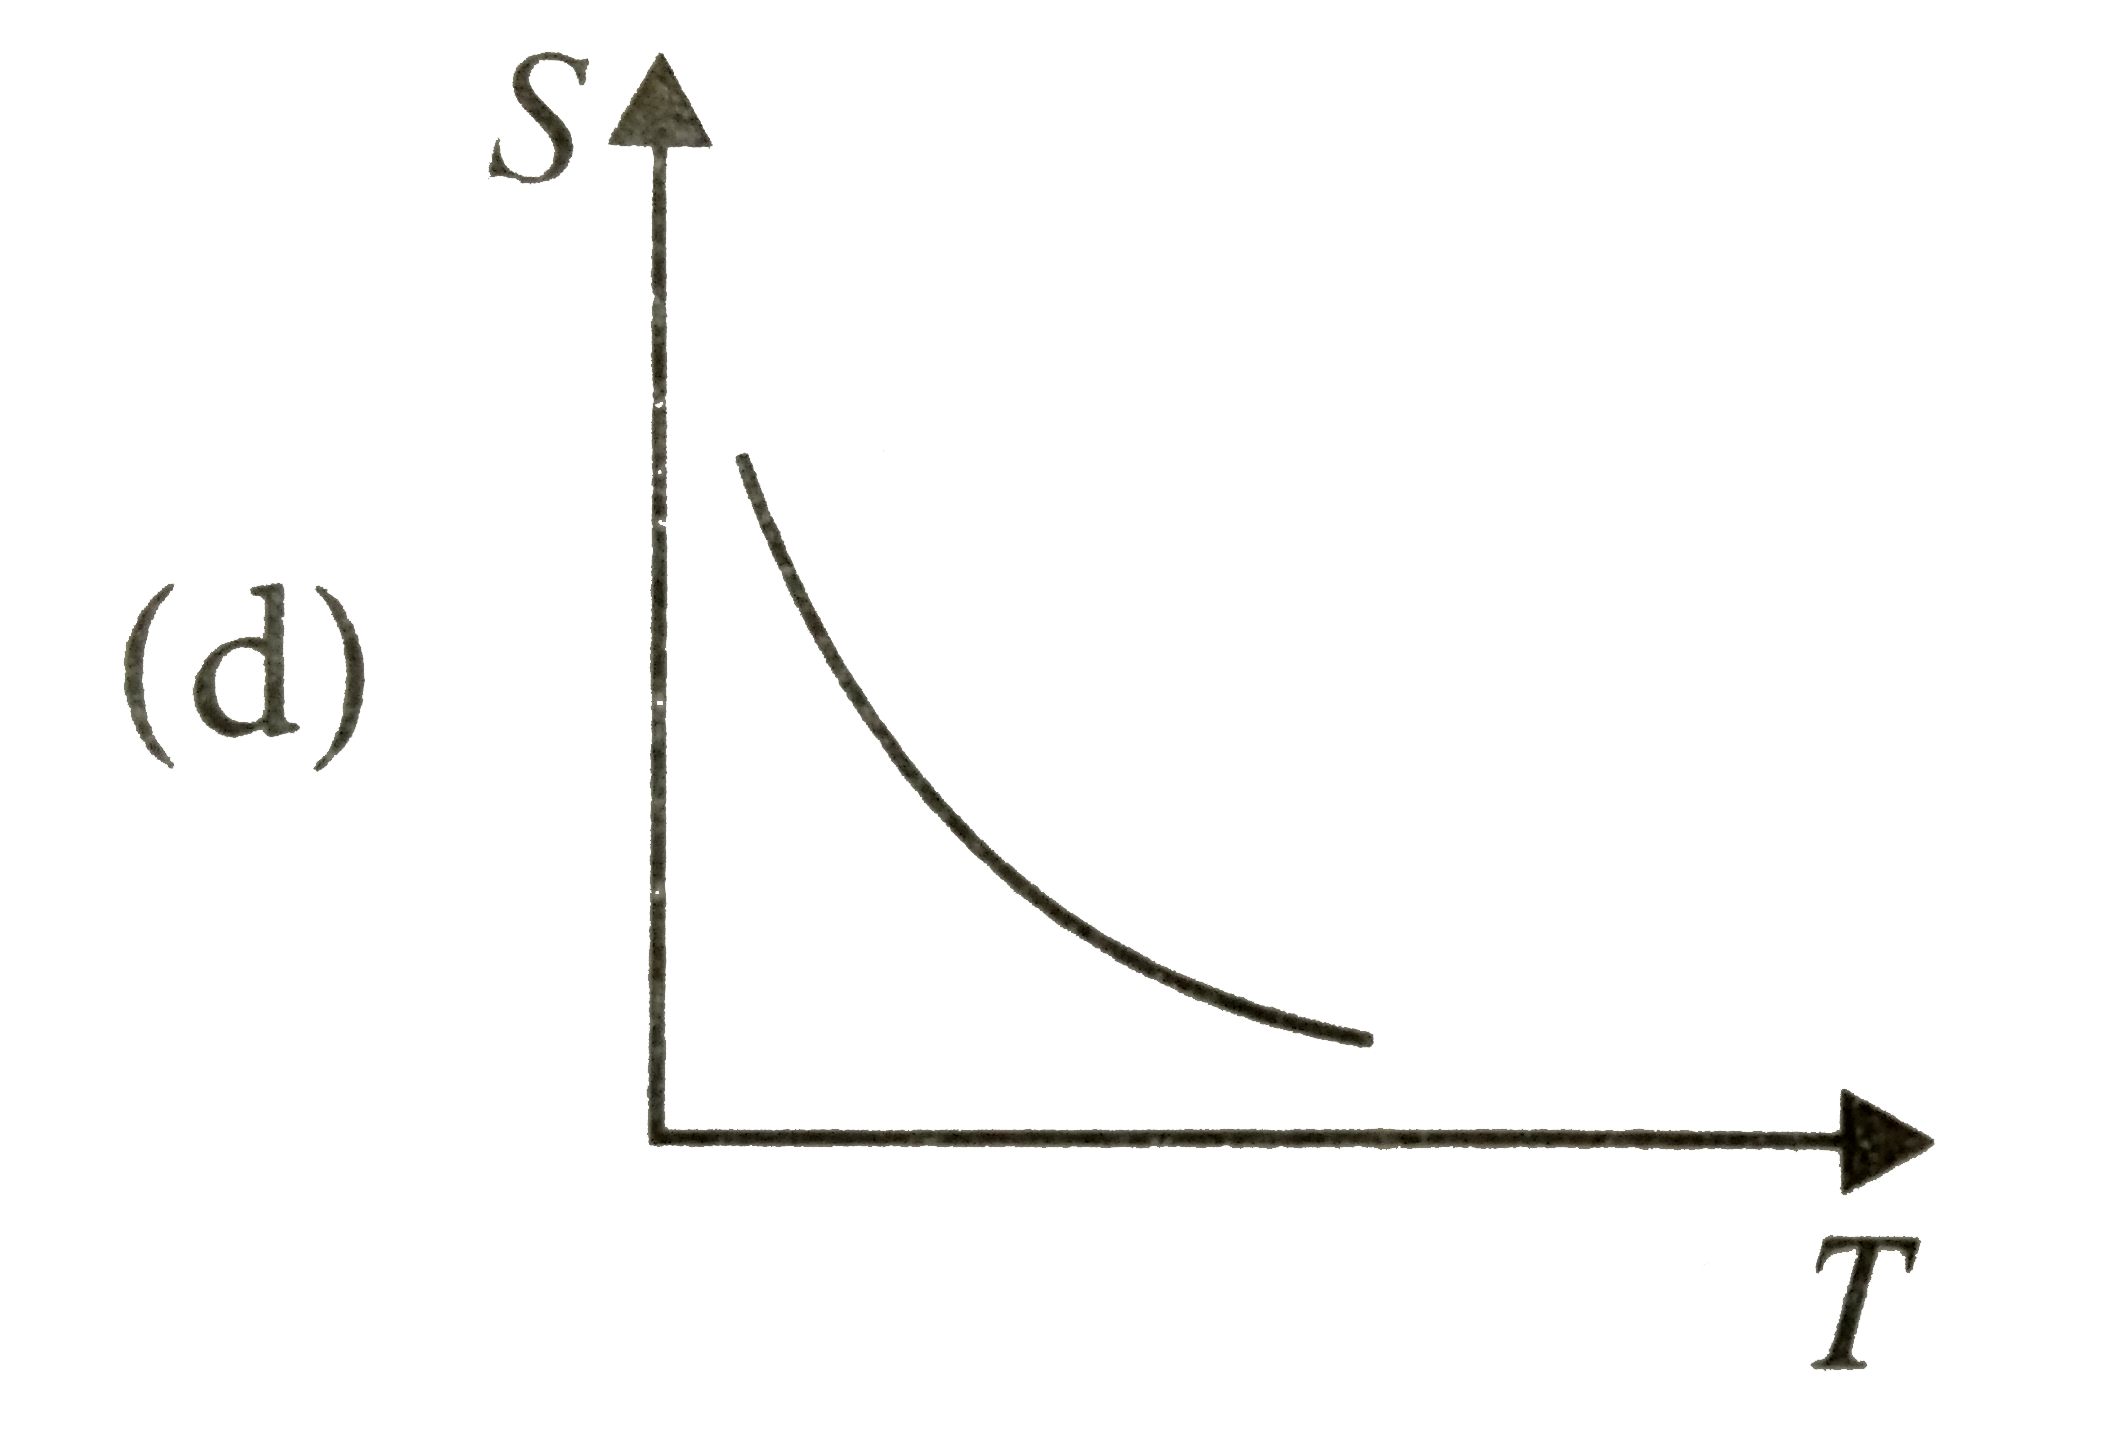
Which of the following curve represent variation of density of water with temperature best-
View SolutionShow on a graph, the variation of resistivity with temperature for a typical semiconductor.
View SolutionShow variation of resistivity of copper as a function of temperature in a graph.
View SolutionThe bacteria that grow best at the temperature ranging from 45∘ to 65∘C are called
View SolutionMost substances contract on freezing . However, water does not belong to this category. We know that water expands on freezing. Further , coefficient of volume expansion of water in the temperature range from 0∘C to 4∘C is negative and above 4∘C it is positive . This behaviour of water shapes the freezing of lakes as the atmospheric temperature goes down and it is still above 4∘C.
If the atmospheric temperature is below 0∘C and ice begins to form at t = 0 , thickness of ice sheet formed up to a time 't' will be directly proprotional to
View SolutionThe total energy radiated from a block body source at constant temperature is collected for one minute and is used to heat a quantity of water. The temperature of water is found to increase from 20∘C to 20.5∘C. If the absolute temperature of the blackbody is doubled and the experiment is repeated with the same quantity of water of 20∘C, the temperature of water will be:
View Solution