Which of the diagram shown in figure represents variation of total mechanical energy of a pendulum oscillating in air as function of time?Solution in Gujrati
n-type semiconductor - room temperature
n-type semiconductor - 0 K temperature
n-type semiconductor - temperature
intrinsic semiconductor
The correct Answer is:A
Step by step video & image solution for Which of the diagram shown in figure represents variation of total mechanical energy of a pendulum oscillating in air as function of time? by Physics experts to help you in doubts & scoring excellent marks in Class 12 exams.
Topper's Solved these Questions
- BOOK - KUMAR PRAKASHANCHAPTER - SEMICONDUCTOR ELECTRONICS : MATERIALS, DEVICES AND SIMPLE CIRCUITS EXERCISE - Section-D : Multiple Choice Questions (MCQs) (MCQs asked in Competitive Exams)129videos
SEMICONDUCTOR ELECTRONICS : MATERIALS, DEVICES AND SIMPLE CIRCUITS
- BOOK - KUMAR PRAKASHANCHAPTER - SEMICONDUCTOR ELECTRONICS : MATERIALS, DEVICES AND SIMPLE CIRCUITS EXERCISE - Section-C: NCERT Exemplar Solution (Long Answer Type Questions)10videos
SEMICONDUCTOR ELECTRONICS : MATERIALS, DEVICES AND SIMPLE CIRCUITS
- BOOK - KUMAR PRAKASHANCHAPTER - SAMPLE QUESTION PAPER EXERCISE - PART-B SECTION-C5videos
SAMPLE QUESTION PAPER
- BOOK - KUMAR PRAKASHANCHAPTER - WAVE OPTICSEXERCISE - SECTION-D (MULTIPLCE CHOICE QUESTIONS (MCQS)) (MCQS FROM DARPAN BASED ON TEXTBOOK)239videos
WAVE OPTICS
Similar Questions
At absolute zero temperature Si acts as ……..
01:18View Solution
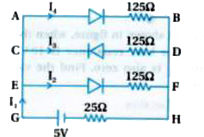
If each diode in figure has a forward bias resistance of 25Ω and infinite resistance in reverse bias, what will be the values of the current I1,I2,I3andI4?01:24View SolutionTwo charges –q and +q are located at points (0, 0, –a) and (0, 0, a), respectively.
(a) What is the electrostatic potential at the points (0, 0, z) and (x, y, 0) ?
(b) Obtain the dependence of potential on the distance r of a point from the origin when r/a>>1 .
(c) How much work is done in moving a small test charge from the point (5,0,0) to (–7,0,0) along the x-axis? Does the answer change if the path of the test charge between the same points is not along the x-axis?01:50View SolutionAccording to particle theory of light what is the velocity of light in a dense medium, compared to that in rare medium ?
02:23View SolutionWhich of the diagrams shown in figure, represents variation of total mechanical energy of a pendulum oscillating in air as function of time ?
01:18View SolutionIn the diagram shown find the time period of pendulum for small oscillations
05:26View SolutionThe potential energy U(x) of a particle moving along x- axis is shown in figure. Which one of the following graphs represents the variation of kinetic energy of this particel if its total mechanical enery is E_(0)
01:25View SolutionThe velocity-time diagram of a harmonic oscillator is shown in the adjoining figure. The frequency of oscillation is
02:55View SolutionWhich of the diagram shown in figures respresents variation of total mechanical energy of a pendulam oscillation in air as function of time?
03:35View SolutionThe phase space diagram for harmonic motion is a circle centered at the origin as shown in figure. The to circles represent the same oscillator but for different initial conditions and E_(1) and E_(2) are the total mechanical energy, respectively . Then
01:45View SolutionA satellite is orbiting earth at a distance r. Variations of its kinetic energy. potential energy and total energy, is sohwn in the figure. Of the three curves shown in figure, identify the type of mechanical energy they represent.
01:29View SolutionThe variation of the potential energy of harmonic oscillator is as shown in the figure. The spring constant is
01:39View Solutionनीचे दिए गए चित्रों में से कौन-सा आरेख समय के फलन के रूप में हवा में दोलन करते हुए किसी लोलक की कुल यांत्रिकीय ऊर्जा में परिवर्तन को दर्शाता है?
05:53View Solutionचित्र में दर्शाए गए आरेखों में से कौन-सा आरेख वायु में दोलन करते हुए किसी लोलक की कुल यांत्रिक ऊर्जा में समय के साथ होने वाले परिवर्तन का सही निरुपण करता है?
01:19View SolutionWhich of the diagram shown in figure represents variation of total mechanical energy of a pendulum oscillating in air as function of time?
01:29View SolutionWhich of the diagram shown in figures respresents variation of total mechanical energy of a pendulam oscillation in air as function of time?
02:41View Solution

