Which of the diagram shown in figure represents variation of total mechanical energy of a pendulum oscillating in air as function of time?Solution in Gujrati
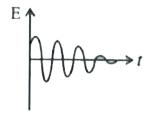
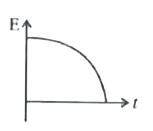
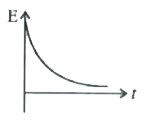
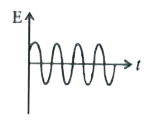
The correct Answer is:C
When a pendulum oscillates in air ,it will lose energy continuously due to air resistance . Thus , mechanical energy of the pendulum decreases continuously with time .
The fluctuation is represented by curve
Topper's Solved these Questions
- WORK, ENERGY AND POWER BOOK - KUMAR PRAKASHANCHAPTER - WORK, ENERGY AND POWER EXERCISE - SECTION - D NCERT Exemplar Solutions (Very Short Answer Type Questions)
12 Videos
- WORK, ENERGY AND POWER BOOK - KUMAR PRAKASHANCHAPTER - WORK, ENERGY AND POWER EXERCISE - SECTION - D NCERT Exemplar Solutions (Short Answer Type Questions)
10 Videos
- WORK, ENERGY AND POWER BOOK - KUMAR PRAKASHANCHAPTER - WORK, ENERGY AND POWER EXERCISE - SECTION - C Objective Questions (VSQs)
52 Videos
- WAVESBOOK - KUMAR PRAKASHANCHAPTER - WAVESEXERCISE - SECTION-F (Questions From Module) (Sample questions for preparation of competitive exams)
23 Videos
Similar Questions
A through inclined is placed on car moving with a constant velocity u on horizontal ground . A block of mass M rests on the inclined plane . Is any work done by force of friction then a dissipation of energy ?
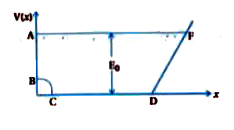
View SolutionA graph of potential energy V(x) verses x is shown in figure .A particle of energy E0 is executing motion in it . Draw graph of velocity and kinetic energy verses x for one complete cycle AFA.
View SolutionIf →A=2ˆi−2ˆjand→B=2ˆk then →A.→B……
View SolutionIn a standing wave formed by two atoms separated by 1.21Å, there are 3 nodes and 2 antinodes. Find its wavelength.
View SolutionWhich of the diagrams shown in figure, represents variation of total mechanical energy of a pendulum oscillating in air as function of time ?
View SolutionIn the diagram shown find the time period of pendulum for small oscillations
View SolutionThe potential energy U(x) of a particle moving along x- axis is shown in figure. Which one of the following graphs represents the variation of kinetic energy of this particel if its total mechanical enery is E_(0)
View SolutionThe velocity-time diagram of a harmonic oscillator is shown in the adjoining figure. The frequency of oscillation is
View SolutionWhich of the diagram shown in figures respresents variation of total mechanical energy of a pendulam oscillation in air as function of time?
View SolutionThe phase space diagram for harmonic motion is a circle centered at the origin as shown in figure. The to circles represent the same oscillator but for different initial conditions and E_(1) and E_(2) are the total mechanical energy, respectively . Then
View SolutionA satellite is orbiting earth at a distance r. Variations of its kinetic energy. potential energy and total energy, is sohwn in the figure. Of the three curves shown in figure, identify the type of mechanical energy they represent.
View SolutionThe variation of the potential energy of harmonic oscillator is as shown in the figure. The spring constant is
View Solutionनीचे दिए गए चित्रों में से कौन-सा आरेख समय के फलन के रूप में हवा में दोलन करते हुए किसी लोलक की कुल यांत्रिकीय ऊर्जा में परिवर्तन को दर्शाता है?
View Solutionचित्र में दर्शाए गए आरेखों में से कौन-सा आरेख वायु में दोलन करते हुए किसी लोलक की कुल यांत्रिक ऊर्जा में समय के साथ होने वाले परिवर्तन का सही निरुपण करता है?
View SolutionWhich of the diagram shown in figures respresents variation of total mechanical energy of a pendulam oscillation in air as function of time?
View Solution
